What causes a 5% growth in this graph?What appears on the chart is a change in the direction of upward fluctuations!
Now, why should these upward fluctuations or upward prospects appear on the chart, is a question that must be answered over time!
I hope that this time, like the previous analysis, we will reach the desired results with this indicator!
Good luck...
NZD (New Zealand Dollar)

Potential bullish rise?NZD/JPY could fall towards the pivot which acts as a pullback support and could bounce to the swing high resistance.
Pivot: 87.33
1st Support: 86.80
1st Resistance: 89.02
Disclaimer:
The above opinions given constitute general market commentary, and do not constitute the opinion or advice of IC Markets or any form of personal or investment advice.
Any opinions, news, research, analyses, prices, other information, or links to third-party sites contained on this website are provided on an "as-is" basis, are intended only to be informative, is not an advice nor a recommendation, nor research, or a record of our trading prices, or an offer of, or solicitation for a transaction in any financial instrument and thus should not be treated as such. The information provided does not involve any specific investment objectives, financial situation and needs of any specific person who may receive it. Please be aware, that past performance is not a reliable indicator of future performance and/or results. Past Performance or Forward-looking scenarios based upon the reasonable beliefs of the third-party provider are not a guarantee of future performance. Actual results may differ materially from those anticipated in forward-looking or past performance statements. IC Markets makes no representation or warranty and assumes no liability as to the accuracy or completeness of the information provided, nor any loss arising from any investment based on a recommendation, forecast or any information supplied by any third-party.

Bullish momentum to extend?NZD/CHF has bounced off the pivot, which is a pullbakc support and oculd bounce to 1st resistance, which lines up with the 61.8% Fibonacci projection.
Pivot: 0.45632
1st Support: 0.45518
1st Resistance: 0.46002
Disclaimer:
The above opinions given constitute general market commentary, and do not constitute the opinion or advice of IC Markets or any form of personal or investment advice.
Any opinions, news, research, analyses, prices, other information, or links to third-party sites contained on this website are provided on an "as-is" basis, are intended only to be informative, is not an advice nor a recommendation, nor research, or a record of our trading prices, or an offer of, or solicitation for a transaction in any financial instrument and thus should not be treated as such. The information provided does not involve any specific investment objectives, financial situation and needs of any specific person who may receive it. Please be aware, that past performance is not a reliable indicator of future performance and/or results. Past Performance or Forward-looking scenarios based upon the reasonable beliefs of the third-party provider are not a guarantee of future performance. Actual results may differ materially from those anticipated in forward-looking or past performance statements. IC Markets makes no representation or warranty and assumes no liability as to the accuracy or completeness of the information provided, nor any loss arising from any investment based on a recommendation, forecast or any information supplied by any third-party.

GBP/NZD Gave Fake Breakout , Short Setup Valid To Get 200 Pips !Here is my 4H Chart on GBP/NZD , We Have A Fake Breakout and then the price Back below my old res and we have a very good bearish Price Action on 2 And 4 Hours T.F Also the price playing very good around my res and i`m waiting the price to retest the broken area and giving a good bearish price action on smaller time frames to can get a confirmation to enter , So i see it`s a good chance to sell this pair if it go up a little to retest the broken area and then we can sell it and targeting 100 to 200 pips . and if we have a daily closure again above my new res then this idea will not be valid anymore .
Reasons To Enter :
1- Perfect Breakout .
2- Clear Bearish Price Action .
3- Bigger T.F Giving Good Bearish P.A .
4 - Perfect 15 Mins Closure .
5- The Price Respect The Res Again .

NZDJPY to stall at earlier swing high?NZDJPY - 24h expiry
Selling posted close to the previous high of 88.58.
88.13 has been pivotal.
Early optimism is likely to lead to gains although extended attempts higher are expected to fail.
Expect trading to remain mixed and volatile.
Preferred trade is to sell into rallies.
We look to Sell at 88.32 (stop at 88.76)
Our profit targets will be 87.01 and 86.81
Resistance: 88.06 / 88.30 / 88.58
Support: 87.60 / 87.30 / 86.96

NZD Buys & Sells Pending mitigation on both sides of this. The sweep to the upside takes out plenty of liquidity on the HTF, while the buys look like accumulation. Either setup valid, but I'd be mindful of AUD and the liquidity it's building up. Liquidity sweeps of AUD would further confirm these setups.

NZD/JPY Made Clear Reversal Pattern,Long Setup To Get 100 Pips !Here is my 4H Chart On NZD/JPY , The price creating a very clear reversal pattern ( Inverted Head & Shoulders pattern ) and the price made a very good bullish price action now but the price still below my neckline. so we can enter a buy trade if we have a 4H Candle Closure above my neckline to confirm the pattern , and we can targeting from 50 to 100 pips with a decent stop loss , if we have not a 4H Closure above neckline this idea will not be valid anymore.
Reasons To Enter :
1- Perfect Touch For The Area .
2- Clear Bullish Price Action .
3- Bigger T.F Giving Good Bullish P.A .
4- Clear Reversal Pattern .

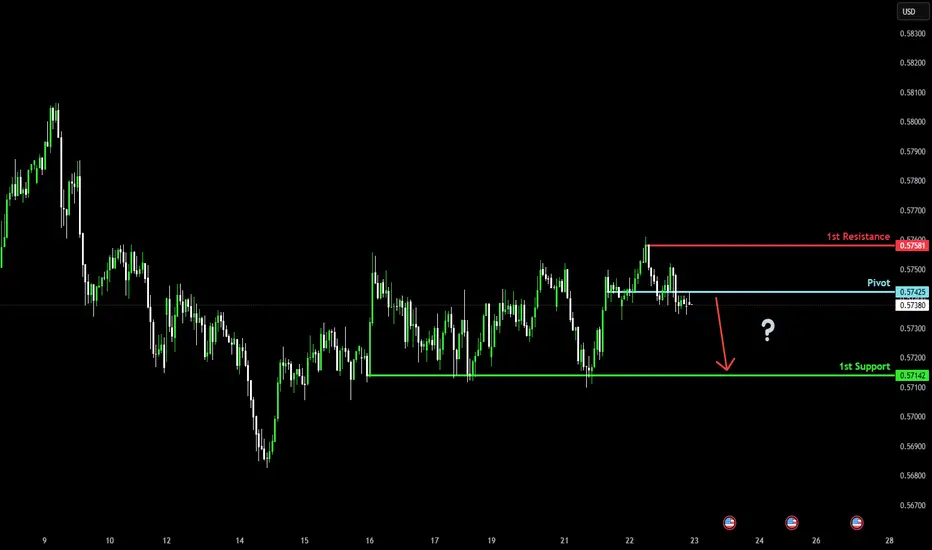
Bearish reversal?The kiwi (NZD/USD) is reacting off the pivot which is a pullback resistance, and could drop to the 1st support which is a multi-swing low support.
Pivot: 0.5742
1st Support: 0.5714
1st Resistance: 0.5758
Disclaimer:
The above opinions given constitute general market commentary, and do not constitute the opinion or advice of IC Markets or any form of personal or investment advice.
Any opinions, news, research, analyses, prices, other information, or links to third-party sites contained on this website are provided on an "as-is" basis, are intended only to be informative, is not an advice nor a recommendation, nor research, or a record of our trading prices, or an offer of, or solicitation for a transaction in any financial instrument and thus should not be treated as such. The information provided does not involve any specific investment objectives, financial situation and needs of any specific person who may receive it. Please be aware, that past performance is not a reliable indicator of future performance and/or results. Past Performance or Forward-looking scenarios based upon the reasonable beliefs of the third-party provider are not a guarantee of future performance. Actual results may differ materially from those anticipated in forward-looking or past performance statements. IC Markets makes no representation or warranty and assumes no liability as to the accuracy or completeness of the information provided, nor any loss arising from any investment based on a recommendation, forecast or any information supplied by any third-party.
Bearish reversal off major resistance?EUR/NZD is rising towards the resistance level which is an overlap resistance that lines up with the 50% Fibonacci retracement and could reverse from this level to our take profit.
Entry: 2.03005
Why we like it:
There is an overlap resistance level that lines up with the 50% Fibonacci retracement.
Stop loss: 2.04813
Why we like it:
There is a swing high resistance level.
Take profit: 2.00466
Why we like it:
There is a pullback support level that aligns with the 50% Fibonacci retracement.
Enjoying your TradingView experience? Review us!
Please be advised that the information presented on TradingView is provided to Vantage (‘Vantage Global Limited’, ‘we’) by a third-party provider (‘Everest Fortune Group’). Please be reminded that you are solely responsible for the trading decisions on your account. There is a very high degree of risk involved in trading. Any information and/or content is intended entirely for research, educational and informational purposes only and does not constitute investment or consultation advice or investment strategy. The information is not tailored to the investment needs of any specific person and therefore does not involve a consideration of any of the investment objectives, financial situation or needs of any viewer that may receive it. Kindly also note that past performance is not a reliable indicator of future results. Actual results may differ materially from those anticipated in forward-looking or past performance statements. We assume no liability as to the accuracy or completeness of any of the information and/or content provided herein and the Company cannot be held responsible for any omission, mistake nor for any loss or damage including without limitation to any loss of profit which may arise from reliance on any information supplied by Everest Fortune Group.

Bearish drop off?NZD/JPY has rejected off the resistance level, which is an overlap resistance that aligns with the 138.2% Fibonacci extension and the 61.8% Fibonacci retracement and could drop from this level to our take profit.
Entry: 87.44
Why we like it:
There is an overlap resistance that aligns with the 138.2% Fibonacci extension and the 61.8% Fibonacci retracement.
Stop loss: 88.10
Why we like it:
There is a pullback resistance level.
Take profit: 86.56
Why we like it:
There is a pullback support that is slightly below the 38.2% Fibonacci retracement.
Enjoying your TradingView experience? Review us!
Please be advised that the information presented on TradingView is provided to Vantage (‘Vantage Global Limited’, ‘we’) by a third-party provider (‘Everest Fortune Group’). Please be reminded that you are solely responsible for the trading decisions on your account. There is a very high degree of risk involved in trading. Any information and/or content is intended entirely for research, educational and informational purposes only and does not constitute investment or consultation advice or investment strategy. The information is not tailored to the investment needs of any specific person and therefore does not involve a consideration of any of the investment objectives, financial situation or needs of any viewer that may receive it. Kindly also note that past performance is not a reliable indicator of future results. Actual results may differ materially from those anticipated in forward-looking or past performance statements. We assume no liability as to the accuracy or completeness of any of the information and/or content provided herein and the Company cannot be held responsible for any omission, mistake nor for any loss or damage including without limitation to any loss of profit which may arise from reliance on any information supplied by Everest Fortune Group.

GBPNZD: Bullish Forecast & Outlook
The analysis of the GBPNZD chart clearly shows us that the pair is finally about to go up due to the rising pressure from the buyers.
❤️ Please, support our work with like & comment! ❤️

NZDCAD Will Explode! BUY!
My dear friends,
Please, find my technical outlook for NZDCAD below:
The price is coiling around a solid key level - 0.8037
Bias - Bullish
Technical Indicators: Pivot Points High anticipates a potential price reversal.
Super trend shows a clear buy, giving a perfect indicators' convergence.
Goal - 0.8048
Safe Stop Loss - 0.8031
About Used Indicators:
The pivot point itself is simply the average of the high, low and closing prices from the previous trading day.
Disclosure: I am part of Trade Nation's Influencer program and receive a monthly fee for using their TradingView charts in my analysis.
———————————
WISH YOU ALL LUCK

GBPNZD – Second Long Entry from 2.3186 | Targeting 2.4074📈 GBPNZD – Second Long Entry from 2.3186 | Targeting 2.407 4 🏁
Overview:
This is a continuation of the previous bullish idea shared on GBPNZD . After the initial move, price has retraced to a key support zone, offering a second entry opportunity at 2.3186 . The bullish structure remains intact, and this setup offers a strong risk-to-reward potential for swing traders. 📊
🔍 Technical Breakdown:
✅ Trend: Bullish structure remains valid on the Daily and 4H charts
✅ Support Zone: 2.3150–2.3186 acted as demand on the previous leg up
✅ Entry: Long from 2.3186 (second entry as per previous plan)
✅ Target: 2.4074 (same target remains in play)
✅ Stop Loss: Below recent swing low or structural invalidation (~2.3070)
✅ Risk/Reward: 1:8+ depending on SL placement
📌 Confluence Factors:
🔹 Price respecting ascending trendline support
🔹 Clean break and retest of 2.3300 resistance turned support previously
🔹 Momentum indicators show bullish divergence on lower timeframes
🔹 High probability setup on pullback in a trending market
🧠 Trade Management Tips:
Consider scaling in from 2.3186 with partial positions
Monitor price reaction around 2.3400 – a key intraday level
Trail stop or lock in profits as price approaches 2.3700 and 2.3900
Final target at 2.4074 , where strong resistance is expected
📅 Outlook:
As long as price holds above the 2.3100 key support zone, bulls remain in control. A clean break above 2.3400 could confirm momentum resumption. Medium-term traders should watch for continuation patterns like bull flags or breakouts above minor highs.
⚠️ Disclaimer:
This is a technical idea shared for educational purposes only. Always conduct your own analysis and manage risk according to your personal trading strategy. 🛡️

NZDJPY Will Go Up! Long!
Please, check our technical outlook for NZDJPY.
Time Frame: 4h
Current Trend: Bullish
Sentiment: Oversold (based on 7-period RSI)
Forecast: Bullish
The market is approaching a significant support area 86.230.
The underlined horizontal cluster clearly indicates a highly probable bullish movement with target 87.213 level.
P.S
Please, note that an oversold/overbought condition can last for a long time, and therefore being oversold/overbought doesn't mean a price rally will come soon, or at all.
Like and subscribe and comment my ideas if you enjoy them!

GBP/NZD SHORT FROM RESISTANCE
Hello, Friends!
We are now examining the GBP/NZD pair and we can see that the pair is going up locally while also being in a uptrend on the 1W TF. But there is also a powerful signal from the BB upper band being nearby, indicating that the pair is overbought so we can go short from the resistance line above and a target at 2.320 level.
Disclosure: I am part of Trade Nation's Influencer program and receive a monthly fee for using their TradingView charts in my analysis.
✅LIKE AND COMMENT MY IDEAS✅

GBPNZD - Looking To Sell Pullbacks In The Short TermH4 - Strong bearish move.
Uptrend line breakout.
No opposite signs.
Currently it looks like a pullback is happening.
Expecting bearish continuation after pullback until the strong resistance zone holds.
If you enjoy this idea, don’t forget to LIKE 👍, FOLLOW ✅, SHARE 🙌, and COMMENT ✍! Drop your thoughts and charts below to keep the discussion going. Your support helps keep this content free and reach more people! 🚀

NZDUSD H1 | Potential Bearish Reversal off Key Fibonacci LevelKIWI (NZD/USD) is rising towards the sell entry which is a pullback resistance that aligns with the 138.2% Fibonacci extension and could reverse from this level to the take profit.
Sell entry is at 0.5767, whichis a pullback resistance that lines up with the 138.2% Fibonacci extension.
Stop loss is at 0.5782, whichis a pullback resistance.
Take profit is at 0.5727, whichis a pullback support.
Stratos Markets Limited (tradu.com):
CFDs are complex instruments and come with a high risk of losing money rapidly due to leverage. 68% of retail investor accounts lose money when trading CFDs with this provider. You should consider whether you understand how CFDs work and whether you can afford to take the high risk of losing your money.
Stratos Europe Ltd (tradu.com ):
CFDs are complex instruments and come with a high risk of losing money rapidly due to leverage. 70% of retail investor accounts lose money when trading CFDs with this provider. You should consider whether you understand how CFDs work and whether you can afford to take the high risk of losing your money.

Bearish drop off?EUR/NZD has reacted off the pivot and could drop to the 1st support which acts as an overlap support that aligns with the 50% Fibonacci retracement.
Pivot: 2.02316
1st Support: 2.00328
1st Resistance: 2.03475
Disclaimer:
The above opinions given constitute general market commentary, and do not constitute the opinion or advice of IC Markets or any form of personal or investment advice.
Any opinions, news, research, analyses, prices, other information, or links to third-party sites contained on this website are provided on an "as-is" basis, are intended only to be informative, is not an advice nor a recommendation, nor research, or a record of our trading prices, or an offer of, or solicitation for a transaction in any financial instrument and thus should not be treated as such. The information provided does not involve any specific investment objectives, financial situation and needs of any specific person who may receive it. Please be aware, that past performance is not a reliable indicator of future performance and/or results. Past Performance or Forward-looking scenarios based upon the reasonable beliefs of the third-party provider are not a guarantee of future performance. Actual results may differ materially from those anticipated in forward-looking or past performance statements. IC Markets makes no representation or warranty and assumes no liability as to the accuracy or completeness of the information provided, nor any loss arising from any investment based on a recommendation, forecast or any information supplied by any third-party.

GBP/NZD - Wedge Breakdown (20.10.2025)📊 Setup Overview:
GBP/NZD has formed a Rising Wedge Pattern on the 30-min chart, signaling a potential trend reversal from the recent bullish structure. The pair has also completed a Cloud Cross, indicating early bearish momentum as price begins to break below the wedge support line. OANDA:GBPNZD
📈 Trade Plan: Bias: Bearish
Sell Entry Zone: Below 2.3400 (after candle close confirmation)
1st Target: 2.3288 ✅
2nd Target: 2.3277 🎯
Resistance Zone: 2.3479 – 2.3523
🧩 Technical Highlights:
1.Rising Wedge pattern breakdown – early bearish signal
2.Ichimoku Cloud Cross confirms downside pressure
3.Volume profile thinning below 2.34, showing potential liquidity vacuum
4.Clean bearish structure with clear risk–reward setup
#GBPNZD #ForexAnalysis #WedgePattern #BearishBreakout #Ichimoku #PriceAction #TechnicalAnalysis #ChartSetup #SwingTrade #TradingView #FXMarket #Kabhi_TA_Trading #ChartsDontLie #TradersDontQuit #ForexSignals
⚠️ Disclaimer:
This analysis is for educational purposes only and not financial advice.
Always confirm setups with your own analysis and manage risk properly before entering any trade.
💬 Support This Analysis:
If this setup helped your trading view — LIKE 👍, COMMENT 💬 your thoughts, and FOLLOW ✅ for more daily forex setups and chart breakdowns from Kabhi_TA_Trading!

Bullish bounce?NZD/JPY is falling towards the pivot, which is a pullback support and could bounce to the 1st resistance, which acts as a swing high resistance.
Pivot: 86.77
1st Support: 85.67
1st Resistance: 88.49
Disclaimer:
The above opinions given constitute general market commentary, and do not constitute the opinion or advice of IC Markets or any form of personal or investment advice.
Any opinions, news, research, analyses, prices, other information, or links to third-party sites contained on this website are provided on an "as-is" basis, are intended only to be informative, is not an advice nor a recommendation, nor research, or a record of our trading prices, or an offer of, or solicitation for a transaction in any financial instrument and thus should not be treated as such. The information provided does not involve any specific investment objectives, financial situation and needs of any specific person who may receive it. Please be aware, that past performance is not a reliable indicator of future performance and/or results. Past Performance or Forward-looking scenarios based upon the reasonable beliefs of the third-party provider are not a guarantee of future performance. Actual results may differ materially from those anticipated in forward-looking or past performance statements. IC Markets makes no representation or warranty and assumes no liability as to the accuracy or completeness of the information provided, nor any loss arising from any investment based on a recommendation, forecast or any information supplied by any third-party.

Bullish reversal?NZD/CHF is reacting off the pivot which is a pullback support and could rise to the 1st resistance.
Pivot: 0.45550
1st Support: 0.45147
1st Resistance: 0.46124
Disclaimer:
The above opinions given constitute general market commentary, and do not constitute the opinion or advice of IC Markets or any form of personal or investment advice.
Any opinions, news, research, analyses, prices, other information, or links to third-party sites contained on this website are provided on an "as-is" basis, are intended only to be informative, is not an advice nor a recommendation, nor research, or a record of our trading prices, or an offer of, or solicitation for a transaction in any financial instrument and thus should not be treated as such. The information provided does not involve any specific investment objectives, financial situation and needs of any specific person who may receive it. Please be aware, that past performance is not a reliable indicator of future performance and/or results. Past Performance or Forward-looking scenarios based upon the reasonable beliefs of the third-party provider are not a guarantee of future performance. Actual results may differ materially from those anticipated in forward-looking or past performance statements. IC Markets makes no representation or warranty and assumes no liability as to the accuracy or completeness of the information provided, nor any loss arising from any investment based on a recommendation, forecast or any information supplied by any third-party.

NZDCAD Will Move Lower! Sell!
Here is our detailed technical review for NZDCAD.
Time Frame: 9h
Current Trend: Bearish
Sentiment: Overbought (based on 7-period RSI)
Forecast: Bearish
The market is testing a major horizontal structure 0.803.
Taking into consideration the structure & trend analysis, I believe that the market will reach 0.794 level soon.
P.S
Please, note that an oversold/overbought condition can last for a long time, and therefore being oversold/overbought doesn't mean a price rally will come soon, or at all.
Like and subscribe and comment my ideas if you enjoy them!

NZDCHF: Long Signal Explained
NZDCHF
- Classic bullish formation
- Our team expects pullback
SUGGESTED TRADE:
Swing Trade
Long NZDCHF
Entry - 0.4539
Sl - 0.4535
Tp - 0.4545
Our Risk - 1%
Start protection of your profits from lower levels
Disclosure: I am part of Trade Nation's Influencer program and receive a monthly fee for using their TradingView charts in my analysis.
❤️ Please, support our work with like & comment! ❤️
