NZD-CAD Free Signal! Buy!
Hello,Traders!
NZDCAD taps into demand and holds structure, with Smart Money accumulation pointing to higher pricing. Imbalance fills hint at continuation toward premium levels.
-------------------
Stop Loss: 0.8105
Take Profit: 0.8158
Entry: 0.8136
Time Frame: 3H
-------------------
Buy!
Comment and subscribe to help us grow!
Check out other forecasts below too!
Disclosure: I am part of Trade Nation's Influencer program and receive a monthly fee for using their TradingView charts in my analysis.
NZD (New Zealand Dollar)

Do you think the New Zealand dollar could strengthen?
Hi
Dears
I think we should still see a correction in the currency because the intensity of the previous wave of decline was quite high and we should look for sell orders to be collected.
What do you think?

NZD/CAD: This Hard As Stone Support Area Will Be Our Next TargetHere is my 4H NZD/CAD chart, this will be my third time to enter from this area of support. If u take a closer look u will see how strong and stubborn this support area and it pushes the price very high each time it comes near it, so I will enter a buy trade once the price is near it and it gives me a bullish price action. I will be targeting from 100 to 150 pips in this trade.

Bullish bounce off pullback support?EUR/NZD is falling towards the support level, which is a pullback support that is slightly below the 38.2% Fibonacci retracement and could bounce from this level to our take profit.
Entry: 2.0023
Why we like it:
There is a pullback support that is slightly below the 38.2% Fibonacci retracement.
Stop loss: 1.97903
Why we like it:
There is a pullback support that lines up with the 78.6% Fibonacci retracement.
Take profit: 2.02914
Why we like it:
There is a pullback resistance level.
Enjoying your TradingView experience? Review us!
Please be advised that the information presented on TradingView is provided to Vantage (‘Vantage Global Limited’, ‘we’) by a third-party provider (‘Everest Fortune Group’). Please be reminded that you are solely responsible for the trading decisions on your account. There is a very high degree of risk involved in trading. Any information and/or content is intended entirely for research, educational and informational purposes only and does not constitute investment or consultation advice or investment strategy. The information is not tailored to the investment needs of any specific person and therefore does not involve a consideration of any of the investment objectives, financial situation or needs of any viewer that may receive it. Kindly also note that past performance is not a reliable indicator of future results. Actual results may differ materially from those anticipated in forward-looking or past performance statements. We assume no liability as to the accuracy or completeness of any of the information and/or content provided herein and the Company cannot be held responsible for any omission, mistake nor for any loss or damage including without limitation to any loss of profit which may arise from reliance on any information supplied by Everest Fortune Group.

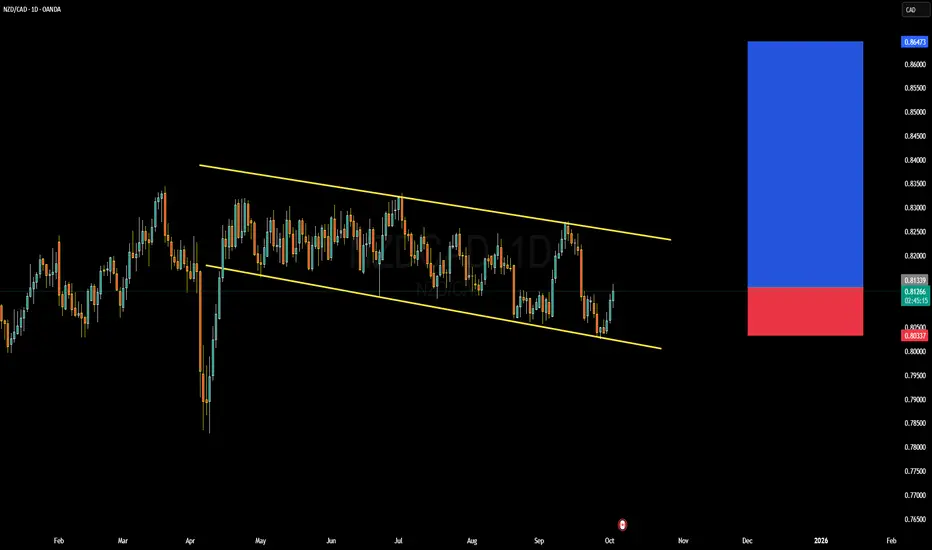
NZDCAD Forming Falling WedgeNZD/CAD is currently holding near a structural demand zone, after a sustained downtrend in recent months. Price has shown multiple rejections of lower levels, forming a potential accumulation base—this hints at a possible swing reversal if bulls step in with conviction. On the upside, the key pivot zone around 0.85-0.86 becomes resistance to watch for a breakout. If broken, price could target 0.860+ as the next clean supply area.
Fundamentally, both New Zealand and Canada are commodity exporters, which ties their currencies closely to global commodity trends. The NZD tends to benefit from softness in CAD when energy prices weaken, and vice versa. At present, global demand for oil is under pressure, which is a headwind for CAD. Meanwhile, New Zealand’s economy is exhibiting moderate resilience, and dairy export strength may lend supportive tailwinds to NZD. These dynamics slightly favor NZD in the cross.
With technical structure and macro tailwinds aligned, the risk/reward is better skewed toward a long entry from the demand zone, provided price holds and shows bullish confirmation (e.g. a strong reversal candle). I’d place stop below the recent swing low and scale into potential breakout above resistance. But if price breaks down decisively below the demand shelf, the bearish bias resumes and invalidates the bullish thesis.
NZDCHF: Will Start Falling! Here is Why:
Balance of buyers and sellers on the NZDCHF pair, that is best felt when all the timeframes are analyzed properly is shifting in favor of the sellers, therefore is it only natural that we go short on the pair.
Disclosure: I am part of Trade Nation's Influencer program and receive a monthly fee for using their TradingView charts in my analysis.
❤️ Please, support our work with like & comment! ❤️
GBPNZD Set To Grow! BUY!
My dear friends,
Please, find my technical outlook for GBPNZD below:
The price is coiling around a solid key level - 2.3091
Bias - Bullish
Technical Indicators: Pivot Points Low anticipates a potential price reversal.
Super trend shows a clear buy, giving a perfect indicators' convergence.
Goal - 2.3159
About Used Indicators:
The pivot point itself is simply the average of the high, low and closing prices from the previous trading day.
Disclosure: I am part of Trade Nation's Influencer program and receive a monthly fee for using their TradingView charts in my analysis.
———————————
WISH YOU ALL LUCK

GBP-NZD Free Signal! Sell!
Hello,Traders!
GBPNZD rejected a premium supply zone after liquidity sweep, confirming smart money distribution. Price aims to rebalance inefficiency below, with sell-side liquidity at 2.3074 in focus.
-------------------
Stop Loss: 2.3152
Take Profit: 2.3074
Entry: 2.3120
Time Frame: 3H
-------------------
Sell!
Comment and subscribe to help us grow!
Check out other forecasts below too!
Disclosure: I am part of Trade Nation's Influencer program and receive a monthly fee for using their TradingView charts in my analysis.

NZDCAD: Bearish Forecast & Outlook
The charts are full of distraction, disturbance and are a graveyard of fear and greed which shall not cloud our judgement on the current state of affairs in the NZDCAD pair price action which suggests a high likelihood of a coming move down.
Disclosure: I am part of Trade Nation's Influencer program and receive a monthly fee for using their TradingView charts in my analysis.
❤️ Please, support our work with like & comment! ❤️

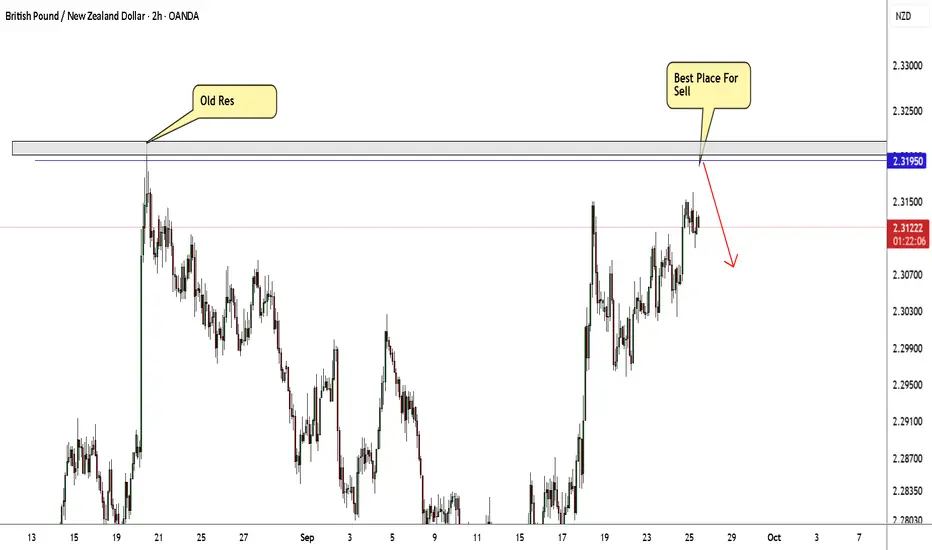
GBP/NZD Near Strong Res Area , Short Valid To Get 150 Pips !Here is my opinion on 2H GBP/NZD Chart , the price Very Near to touch a very strong res area that forced the price to respect it and go down for more than 500 pips for 1 time , and now the price trying to touch it so now i`m waiting the price to go back to retest the same area again and give me a good bearish price action to can enter a sell trade and we can targeting from 100 : 200 pips . if we have a daily closure above my res area this idea will not be valid anymore .
Entry Reasons :
1- Very Strong Daily Res Area .
2- Perfect Bearish Price Action .
3- Bigger Time Frames Confirmed .
NZDUSD H1 | Bullish Rise in PlayThe kiwi (NZD/USD) has bounced off the buy entry, which is a pullback support and oculd rise from this levle to the upside.
Buy entry is at 0.5808, whichis a pullback support.
Stop loss is at 0.5785, whichis a pullback support.
Take profit is at 0.5870, which has a pullback resistance.
High Risk Investment Warning
Trading Forex/CFDs on margin carries a high level of risk and may not be suitable for all investors. Leverage can work against you.
Stratos Markets Limited (tradu.com ):
CFDs are complex instruments and come with a high risk of losing money rapidly due to leverage. 65% of retail investor accounts lose money when trading CFDs with this provider. You should consider whether you understand how CFDs work and whether you can afford to take the high risk of losing your money.
Stratos Europe Ltd (tradu.com ):
CFDs are complex instruments and come with a high risk of losing money rapidly due to leverage. 66% of retail investor accounts lose money when trading CFDs with this provider. You should consider whether you understand how CFDs work and whether you can afford to take the high risk of losing your money.
Stratos Global LLC (tradu.com ):
Losses can exceed deposits.
Please be advised that the information presented on TradingView is provided to Tradu (‘Company’, ‘we’) by a third-party provider (‘TFA Global Pte Ltd’). Please be reminded that you are solely responsible for the trading decisions on your account. There is a very high degree of risk involved in trading. Any information and/or content is intended entirely for research, educational and informational purposes only and does not constitute investment or consultation advice or investment strategy. The information is not tailored to the investment needs of any specific person and therefore does not involve a consideration of any of the investment objectives, financial situation or needs of any viewer that may receive it. Kindly also note that past performance is not a reliable indicator of future results. Actual results may differ materially from those anticipated in forward-looking or past performance statements. We assume no liability as to the accuracy or completeness of any of the information and/or content provided herein and the Company cannot be held responsible for any omission, mistake nor for any loss or damage including without limitation to any loss of profit which may arise from reliance on any information supplied by TFA Global Pte Ltd.
The speaker(s) is neither an employee, agent nor representative of Tradu and is therefore acting independently. The opinions given are their own, constitute general market commentary, and do not constitute the opinion or advice of Tradu or any form of personal or investment advice. Tradu neither endorses nor guarantees offerings of third-party speakers, nor is Tradu responsible for the content, veracity or opinions of third-party speakers, presenters or participants.

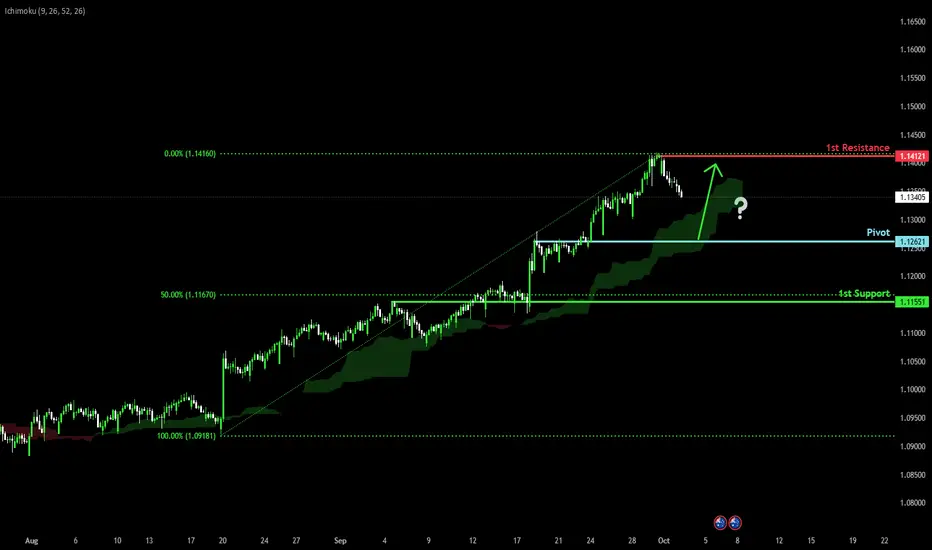
Bullish continuation setup?AUD/NZD is falling towards the pivot, which is a pullback support and could bounce to the swing high resistance.
Pivot: 1.12621
1st Support: 1.11551
1st Resistance: 1.14121
Disclaimer:
The above opinions given constitute general market commentary, and do not constitute the opinion or advice of IC Markets or any form of personal or investment advice.
Any opinions, news, research, analyses, prices, other information, or links to third-party sites contained on this website are provided on an "as-is" basis, are intended only to be informative, is not an advice nor a recommendation, nor research, or a record of our trading prices, or an offer of, or solicitation for a transaction in any financial instrument and thus should not be treated as such. The information provided does not involve any specific investment objectives, financial situation and needs of any specific person who may receive it. Please be aware, that past performance is not a reliable indicator of future performance and/or results. Past Performance or Forward-looking scenarios based upon the reasonable beliefs of the third-party provider are not a guarantee of future performance. Actual results may differ materially from those anticipated in forward-looking or past performance statements. IC Markets makes no representation or warranty and assumes no liability as to the accuracy or completeness of the information provided, nor any loss arising from any investment based on a recommendation, forecast or any information supplied by any third-party.
Bullish momentum building?NZD/CAD has reacted off the pivot which acts as a pullback support and could potentially rise to the 1st resistance.
Pivot: 0.81142
1st Support: 0.80640
1st Resistance: 0.81973
Disclaimer:
The above opinions given constitute general market commentary, and do not constitute the opinion or advice of IC Markets or any form of personal or investment advice.
Any opinions, news, research, analyses, prices, other information, or links to third-party sites contained on this website are provided on an "as-is" basis, are intended only to be informative, is not an advice nor a recommendation, nor research, or a record of our trading prices, or an offer of, or solicitation for a transaction in any financial instrument and thus should not be treated as such. The information provided does not involve any specific investment objectives, financial situation and needs of any specific person who may receive it. Please be aware, that past performance is not a reliable indicator of future performance and/or results. Past Performance or Forward-looking scenarios based upon the reasonable beliefs of the third-party provider are not a guarantee of future performance. Actual results may differ materially from those anticipated in forward-looking or past performance statements. IC Markets makes no representation or warranty and assumes no liability as to the accuracy or completeness of the information provided, nor any loss arising from any investment based on a recommendation, forecast or any information supplied by any third-party.

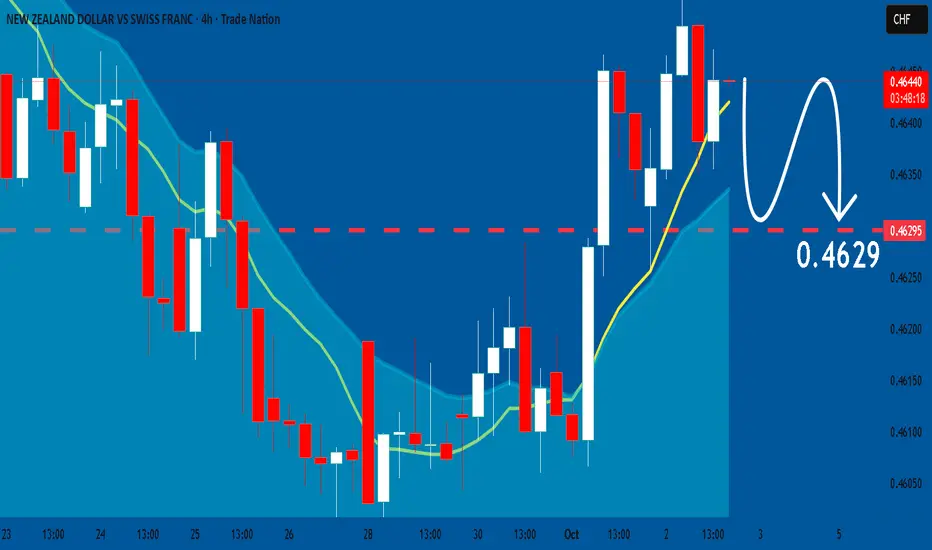
Bullish rise?NZD/CHF has bounced off the pivot and oculd rise to the 50% Fibonacci resistance.
Pivot: 0.46183
1st Support: 0.45888
1st Resistance: 0.46786
Disclaimer:
The above opinions given constitute general market commentary, and do not constitute the opinion or advice of IC Markets or any form of personal or investment advice.
Any opinions, news, research, analyses, prices, other information, or links to third-party sites contained on this website are provided on an "as-is" basis, are intended only to be informative, is not an advice nor a recommendation, nor research, or a record of our trading prices, or an offer of, or solicitation for a transaction in any financial instrument and thus should not be treated as such. The information provided does not involve any specific investment objectives, financial situation and needs of any specific person who may receive it. Please be aware, that past performance is not a reliable indicator of future performance and/or results. Past Performance or Forward-looking scenarios based upon the reasonable beliefs of the third-party provider are not a guarantee of future performance. Actual results may differ materially from those anticipated in forward-looking or past performance statements. IC Markets makes no representation or warranty and assumes no liability as to the accuracy or completeness of the information provided, nor any loss arising from any investment based on a recommendation, forecast or any information supplied by any third-party.

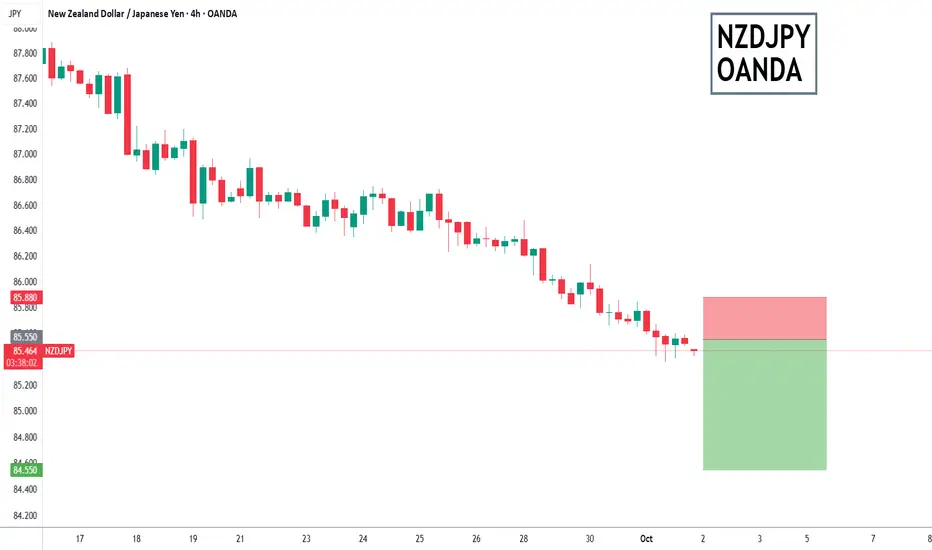
NZDJPY to find sellers at market price?NZDJPY - 24h expiry
Our short term bias remains negative.
The lack of interest is a concern for bulls.
There is no clear indication that the downward move is coming to an end.
Offers ample risk/reward to sell at the market.
20 1hour EMA is at 85.57.
We look to Sell at 85.55 (stop at 85.88)
Our profit targets will be 84.55 and 84.35
Resistance: 85.85 / 86.13 / 86.48
Support: 85.38 / 85.00 / 84.50
Risk Disclaimer
The trade ideas beyond this page are for informational purposes only and do not constitute investment advice or a solicitation to trade. This information is provided by Signal Centre, a third-party unaffiliated with OANDA, and is intended for general circulation only. OANDA does not guarantee the accuracy of this information and assumes no responsibilities for the information provided by the third party. The information does not take into account the specific investment objectives, financial situation, or particular needs of any particular person. You should take into account your specific investment objectives, financial situation, and particular needs before making a commitment to trade, including seeking, under a separate engagement, as you deem fit.
You accept that you assume all risks in independently viewing the contents and selecting a chosen strategy.
Where the research is distributed in Singapore to a person who is not an Accredited Investor, Expert Investor or an Institutional Investor, Oanda Asia Pacific Pte Ltd (“OAP“) accepts legal responsibility for the contents of the report to such persons only to the extent required by law. Singapore customers should contact OAP at 6579 8289 for matters arising from, or in connection with, the information/research distributed.
GBPNZD Sellers In Panic! BUY!
My dear friends,
GBPNZD looks like it will make a good move, and here are the details:
The market is trading on 2.3177 pivot level.
Bias - Bullish
Technical Indicators: Supper Trend generates a clear long signal while Pivot Point HL is currently determining the overall Bullish trend of the market.
Goal - 2.3199
Recommended Stop Loss - 2.3165
About Used Indicators:
Pivot points are a great way to identify areas of support and resistance, but they work best when combined with other kinds of technical analysis
Disclosure: I am part of Trade Nation's Influencer program and receive a monthly fee for using their TradingView charts in my analysis.
———————————
WISH YOU ALL LUCK

NZDCAD FREE SIGNAL|SHORT|
✅NZDCAD Price has tapped into the supply level after a corrective push, rejecting inefficiency and signaling continuation lower. ICT perspective suggests targeting liquidity resting below recent lows. Time Frame 4H.
—————————
Entry: 0.8115
Stop Loss: 0.8135
Take Profit: 0.8085
Time Frame: 4H
—————————
SHORT🔥
✅Like and subscribe to never miss a new idea!✅

Continuation of bearish momentumThe Kiwi (NZD/USD) is rising towards the pivot which acts as a pullback resistance and could drop to the pullback support.
Pivot: 0.5839
1st Support: 0.5762
1st Resistance: 0.5884
Disclaimer:
The above opinions given constitute general market commentary, and do not constitute the opinion or advice of IC Markets or any form of personal or investment advice.
Any opinions, news, research, analyses, prices, other information, or links to third-party sites contained on this website are provided on an "as-is" basis, are intended only to be informative, is not an advice nor a recommendation, nor research, or a record of our trading prices, or an offer of, or solicitation for a transaction in any financial instrument and thus should not be treated as such. The information provided does not involve any specific investment objectives, financial situation and needs of any specific person who may receive it. Please be aware, that past performance is not a reliable indicator of future performance and/or results. Past Performance or Forward-looking scenarios based upon the reasonable beliefs of the third-party provider are not a guarantee of future performance. Actual results may differ materially from those anticipated in forward-looking or past performance statements. IC Markets makes no representation or warranty and assumes no liability as to the accuracy or completeness of the information provided, nor any loss arising from any investment based on a recommendation, forecast or any information supplied by any third-party.

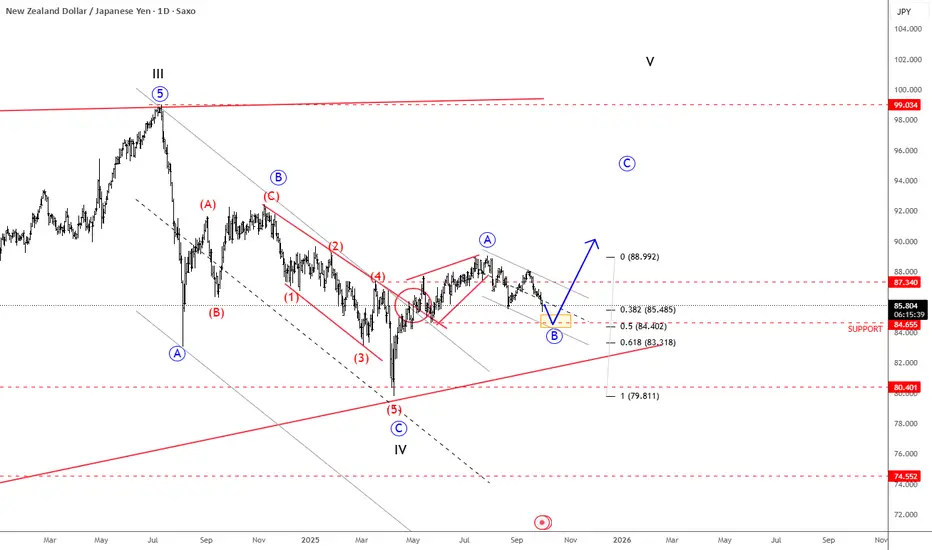
NZDJPY Is Forming A Bullish SetupNew Zealand dollar turned up against the Japanese Yen since April, when we saw a strong rebound from 80.40 support, a key level going back to March 2023. The recovery is quite strong, and it looks like a leading diagonal pattern into wave A; so it's a motive wave structure that already pushed above the 87.34 resistance, which is a strong bullish signal, suggesting more upside ahead. So if we are correct, then current retracement is a contra-trend move; possibly wave B that has a nice support at 85-84 area, which is not that far away, so we may get a new bounce in a few weeks; ideally an impulse, out of a current downward channel.
NZDCAD Set To Fall! SELL!
My dear friends,
My technical analysis for NZDCAD is below:
The market is trading on 0.8065 pivot level.
Bias - Bearish
Technical Indicators: Both Super Trend & Pivot HL indicate a highly probable Bearish continuation.
Target - 0.8053
Recommended Stop Loss - 0.8072
About Used Indicators:
A pivot point is a technical analysis indicator, or calculations, used to determine the overall trend of the market over different time frames.
Disclosure: I am part of Trade Nation's Influencer program and receive a monthly fee for using their TradingView charts in my analysis.
———————————
WISH YOU ALL LUCK

NZD/CHF BULLS WILL DOMINATE THE MARKET|LONG
Hello, Friends!
The BB lower band is nearby so NZD-CHF is in the oversold territory. Thus, despite the downtrend on the 1W timeframe I think that we will see a bullish reaction from the support line below and a move up towards the target at around 0.467.
Disclosure: I am part of Trade Nation's Influencer program and receive a monthly fee for using their TradingView charts in my analysis.
✅LIKE AND COMMENT MY IDEAS✅

NZDJPY LONG FROM DEMAND LEVEL|
✅NZDJPY Price is tapping into a higher-timeframe demand zone, where ICT logic highlights discounted entry levels after sustained bearish order flow. Liquidity resting below prior lows is swept, creating conditions for a relief move toward premium levels. Time Frame 5H.
LONG🚀
✅Like and subscribe to never miss a new idea!✅

Bullish reversal off pullback support?NZD/JPY is falling towards the support level, which is a pullback support and could bounce from this level to our take profit.
Entry: 85.61
Why we like it:
There is a pullback support level.
Stop loss: 85.06
Why we like it:
There is a pullback support level.
Take profit: 86.52
Why we like it:
There is an overlap resistance that is slightly below the 38.2% Fibonacci retracement.
Enjoying your TradingView experience? Review us!
Please be advised that the information presented on TradingView is provided to Vantage (‘Vantage Global Limited’, ‘we’) by a third-party provider (‘Everest Fortune Group’). Please be reminded that you are solely responsible for the trading decisions on your account. There is a very high degree of risk involved in trading. Any information and/or content is intended entirely for research, educational and informational purposes only and does not constitute investment or consultation advice or investment strategy. The information is not tailored to the investment needs of any specific person and therefore does not involve a consideration of any of the investment objectives, financial situation or needs of any viewer that may receive it. Kindly also note that past performance is not a reliable indicator of future results. Actual results may differ materially from those anticipated in forward-looking or past performance statements. We assume no liability as to the accuracy or completeness of any of the information and/or content provided herein and the Company cannot be held responsible for any omission, mistake nor for any loss or damage including without limitation to any loss of profit which may arise from reliance on any information supplied by Everest Fortune Group.
