NZD JPY is Yearning to touch that SupportIf I could draw your attention to what price did in my circled area Oct 20-Nov 1. We can see that Price was missing its support after the drastic fall and that there was enough Short sentiment to make sure that it got there before taking off again. I believe that we are in the same situation once again. It may retrace up and find its inner resistance first, or it may not. The NZD can fall faster than most as some in history have made millions off of shorting NZD. I would expect sideways/upper movement for the next 24 H (1 Day), until it touches that resistance line, at which time I would recommend short selling with a limit at the weekly (April) Support 75.65 a bouts. Judging from the (circle price action) I would say it would be within 6 days from now to reach your limit.
PS. I don't think its wise to try to call out when this big guy is going to turn North, go with the trend in my opinion, until it betrays you.
PSS. This is my first post. So I'm sorry if its not well done, but I wanted to give you guys the overall picture of how I see it playing out.
If you sell now:
Risk Return 24:90 Pips (1:3)
Nzdjpysell


NZDJPY (SELL) TREND CONTINUATIONDaily Candle Closes Bearish, SOLD @79.100. NEW resistance, Previous Support @ fair price levels


NZDJPY- 4HWe are in the phase of formation of THE 5TH WAFE OF Wolfe Wave, which happen to be AB=CD (harmony pattern). Wait for the breaking down signal !


NZDJPY Sell on SR re testPrice has broken Support and is currently re testing it from the bottom.
Trend line for additional confirmation.
Fibo 38 retracement for bigger wave and 50 for last move.
I have some concerns on this trade as already have profitable long position on USD/JPY. Correlation for 4H charts is only 53% but for daily it's 71%.


shorting the NZDJPY very soonI would short the NZDJPY and put at sell limit at around 80.000 because the 4hr/1D down trend is forming a LowHigh ...wait for pullback and confirmation before entering


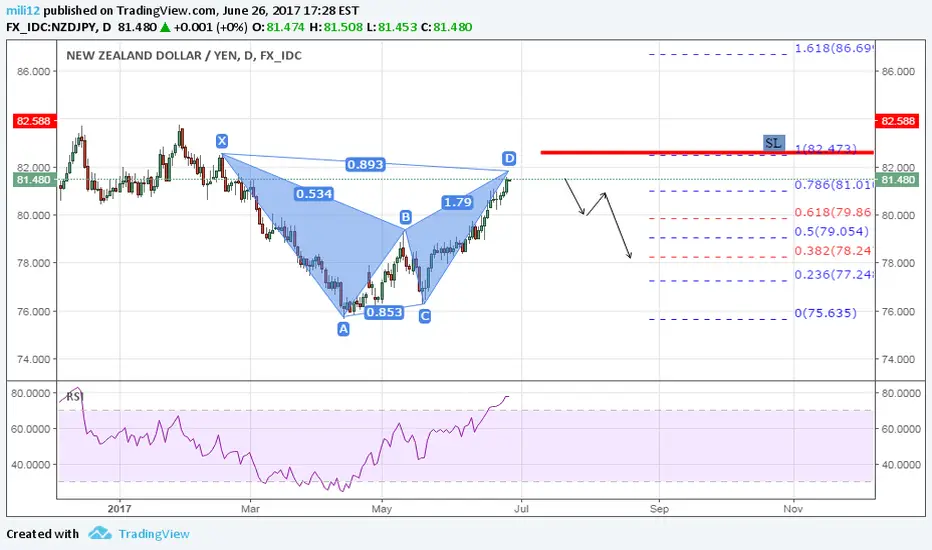
NZDJPY looks Promising - Short is the callWatching this pair since too long, By catching a very good impulse now it's time for some retarcement. Short this pair Now till the market arrows thanks.

NZDJPY - WEEKEND ANALYSIS - POSSIBLE SHORTSHi All,
Here is my weekend Analysis on this pair. Please note that this is only a guide I do not trade in the weekly time frame.
Happy Trading.

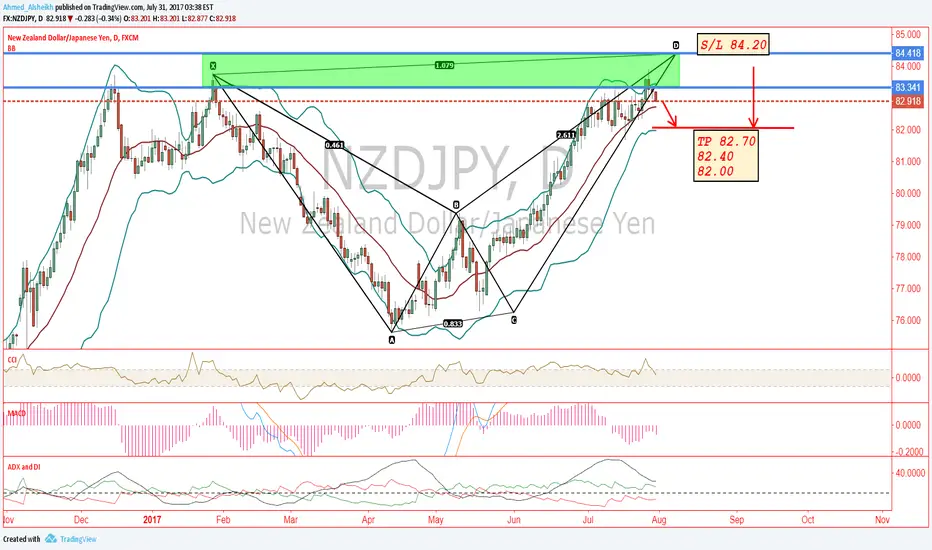
NZDJPY!Hi Guys!
My trading idea for nzdjpy
My entry reason for short (Bearish Bat pattern)
SL u have (red line) , TP (follow arrows)
Trade with care!
Thank You
My telegram channel (free signals)
t.me

NZDJPY Wait for the BreakOUT*please take note that a few hours from now there will be NZD news. This news has potential to cause a breakout. So be careful with taking a position before the news.
NZDJPY on the daily time frame shows on interesting setup that can either way. A break of the resistance will cause a nice move further up. However if it bounced back and breaks the lower range a new down trend will start.
Currently the 4 hour time frame shows a possible 20-40 pips retracement before continuing to go up.
Trade Plan:
Wait for a break-out to either direction. Alternatively if price bounced back to the lower range but doesnt break it, this means the 4 hour time frame retracement has been completed and price will go up.
Use a 60 or 80 pip stop loss
Buy take profit: 81.30 > 82.50
Sell take profit: 77.90

Double Top at StructureHey guys,
my usual analysis starts from higher timeframes such as the daily. There i've highlighted a key level of structure looking left, a resistance area that could stop the price's rally. As i go down on lower timeframe such as 4h i can see there are two tests of this specific level (also a psychological level, 79.00) both failing in making new highs. This makes me think a reversal could be setting up and therefore i'm getting involved in the short side of this, with stops above the highs and target1 at the retest of the lows; target 2 to be determined.
If you want to share your view or simply ask questions, feel free to comment below.
Otherwise, see you in the next chart!

Double Top @ StructureHey guys,
my usual analysis starts from higher timeframes such as the daily. There i've highlighted a key level of structure looking left, a resistance area that could stop the price's rally. As i go down on lower timeframe such as 4h i can see there are two tests of this specific level (also a psychological level, 79.00) both failing in making new highs. This makes me think a reversal could be setting up and therefore i'm getting involved in the short side of this, with stops above the highs and target1 at the retest of the lows; target 2 to be determined.
If you want to share your view or simply ask questions, feel free to comment below.
Otherwise, see you in the next chart!
