NZDUSD - buy nowNZDUSD was in a recent downtrend for the last few weeks and was struggling to stay bullish, but recently it has just broken a strong resistance trend line which it tested several times and failed to break through. NZDUSD is very likely to hit the next major resistance zone which is market as the "TAKE PROFIT" LEVEL. There are many clear signs of new bullish movements. BUY NZDUSD now
Nzdusddaily

NZDUSD - Time to buy nowNZDUSD was in a recent downtrend for the last few weeks and was struggling to stay bullish, but recently it has just broken a strong resistance trend line which it tested several times and failed to break through. NZDUSD is very likely to hit the next major resistance zone which is market as the "TAKE PROFIT" LEVEL. There are many clear signs of new bullish movements. TIME TO BUY NZDUSD Now

Growth is gaining momentum: an upward wave in developmentIn its current phase, USDJPY is showing signs of gradual strengthening. After a period of consolidation, the upward movement is becoming more pronounced, and the wave structure points to the formation of a bullish scenario. Buyers maintain the initiative, limiting the depth of pullbacks.
The chart shows that the price is consolidating above local support zones, while the sequence of waves is taking on a clearer upward character. This dynamic creates the foundation for a new impulse and confirms interest in continued growth.
The fundamental backdrop also favors strengthening: demand for the dollar remains supported by expectations of a dovish Bank of Japan policy, which reinforces buyer positions and sustains upward movement.
As a result, the pair remains in a recovery phase, where the market’s next steps may confirm the formation of a sustainable bullish trend.

NZDUSD - buy nowNZDUSD was in a recent downtrend for the last few weeks and was struggling to stay bullish, but recently it has just broken a strong resistance trend line which it tested several times and failed to break through. NZDUSD is very likely to hit the next major resistance zone which is market as the "TAKE PROFIT" LEVEL. There are many clear signs of new bullish movements. BUY NZDUSD Now

NZD/USD Price Outlook – Trade Setup📊 Technical Structure
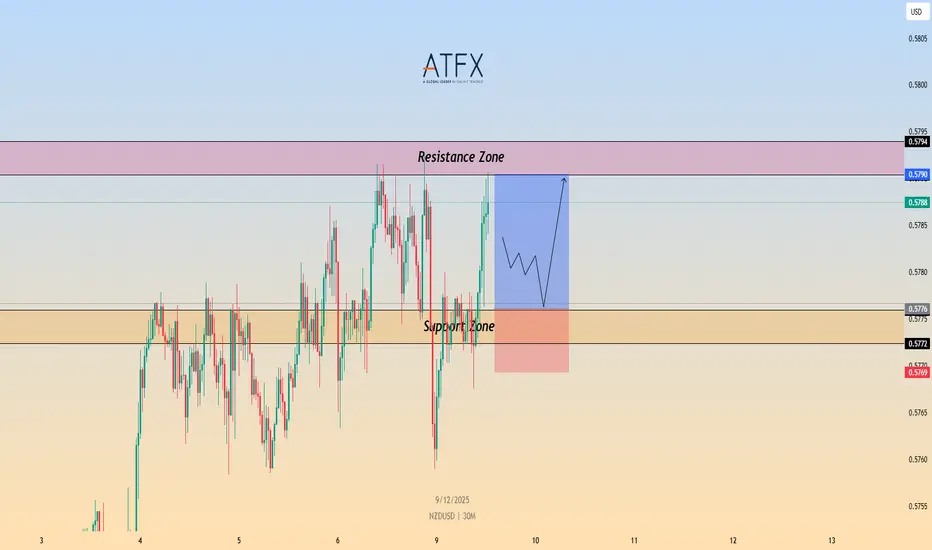
OANDA:NZDUSD NZD/USD is trading slightly softer around 0.5775, holding above the 0.5772–0.5776 support zone while repeatedly failing to sustain a break above the 0.5790–0.5794 resistance area. The pair remains range-bound ahead of major US employment data and the FOMC rate decision, with price action showing a tightening consolidation pattern.
As long as NZD/USD holds above the support band, dips may continue to attract buyers for another attempt toward the resistance zone. A clean break below 0.5769 would invalidate the bullish scenario and expose deeper downside. Conversely, a breakout above 0.5794 could trigger short-covering momentum toward higher levels.
🎯 Trade Setup
Idea: Buy dips near support and target a retest of the resistance zone.
Entry: 0.5772 – 0.5776
Stop Loss: 0.5769
Take Profit 1: 0.5790
Take Profit 2: 0.5794
Risk–Reward Ratio: ~1 : 2.12
Bullish bias remains valid as long as price holds above 0.5772–0.5776 A 30M/1H close below 0.5769 invalidates the setup.
🌐 Macro Background
Markets expect the Fed to cut rates by 25 bps on Wednesday, but traders fear a hawkish cut — meaning the Fed cuts once but signals fewer cuts ahead. This supports the USD in the short term, weighing on NZD/USD.
China, New Zealand’s largest trading partner, posted its largest trade surplus since June, reflecting stronger export performance. A strong China surplus is generally positive for the Kiwi, but this effect is being overshadowed by Fed-related USD strength.
Later today, traders will focus on the delayed US ADP four-week average and JOLTS job openings data. Stronger-than-expected numbers could further support the USD, while softer data may help NZD/USD stabilize near support.
🔑 Key Technical Levels
Resistance Zone: 0.5790 – 0.5794
Support Zone: 0.5776 – 0.5772
Invalidation Level: 0.5769 (30M/1H close below)
📌 Trade Summary
NZD/USD is consolidating below 0.5800 as markets await US employment data and the Fed decision. The technical structure supports buying dips into the support zone, targeting a move toward 0.5790–0.5794. A break below 0.5769 invalidates the bullish setup and suggests a shift in momentum.
⚠️ Disclaimer
This analysis is for reference only and does not constitute trading advice. Trading involves significant risk, and proper risk management is essential.
NZDUSD - great time to buy nowNZDUSD was in a recent downtrend for the last few weeks and was struggling to stay bullish, but recently it has just broken a strong resistance trend line which it tested several times and failed to break through. NZDUSD is very likely to hit the next major resistance zone which is market as the "TAKE PROFIT" LEVEL. There are many clear signs of new bullish movements. Time to buy NZDUSD..

NZDUSD - buy nowNZDUSD was in a recent downtrend for the last few weeks and struggled to stay bullish, but recently it has just broken a strong resistance trend line which it tested several times and failed to break through. NZDUSD is very likely to hit the next major resistance zone which is market as the "TAKE PROFIT" LEVEL. There are many clear signs of new bullish movements. BUY NZDUSD now..

NZD/USD Price Outlook – Trade Setup📊 Technical Structure
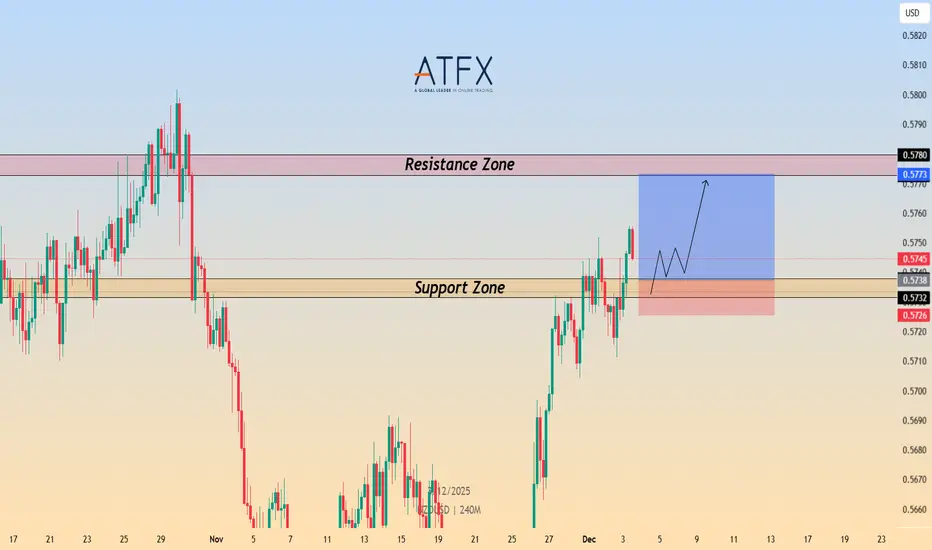
OANDA:NZDUSD NZD/USD holds firm above the 0.5738–0.5732 Support Zone, maintaining its short-term bullish structure. The pair has rebounded strongly from support and is now pressing toward the 0.5773–0.5780 Resistance Zone.
Price action shows a constructive sequence of higher lows on the 4H chart, indicating buyers are defending dips. As long as NZD/USD stays above 0.5732, the bullish outlook remains valid. A clean break above 0.5773 could open a move toward 0.5800+.
A 4H close below 0.5726 would invalidate the bullish structure.
🎯 Trade Setup
Idea: Buy dips toward support, targeting continuation toward resistance.
Entry: 0.5738 – 0.5732
Stop Loss: 0.5726
Take Profit 1: 0.5773
Take Profit 2: 0.5780
Risk–Reward Ratio: ≈ 1 : 3
Bias remains bullish above 0.5738–0.5732
🌐 Macro Background
NZD/USD rises toward 0.5750 as upbeat Chinese Services PMI data boosts risk sentiment. China remains New Zealand’s largest trading partner, making the Kiwi highly sensitive to Chinese economic performance. The November Services PMI beat expectations at 52.1, supporting NZD demand.
The Reserve Bank of New Zealand (RBNZ) delivered a widely expected 25bps rate cut last week but signalled that the easing cycle may be ending. This "less dovish" stance supported NZD on dips.
Meanwhile, US Dollar softness persists as Fed rate-cut expectations strengthen. Markets now price an 89% probability of a December rate reduction. Traders await ADP Employment and ISM Services PMI for further direction.
Overall, stronger Chinese data, a neutral-leaning RBNZ, and dovish Fed expectations favour NZD/USD upside on dips.
🔑 Key Technical Levels
Resistance Zone: 0.5773 – 0.5780
Support Zone: 0.5738 – 0.5732
Bullish Targets: 0.5773 / 0.5780
Invalidation: 4H close below 0.5726
📌 Trade Summary
NZD/USD maintains bullish momentum above the 0.5740 region, supported by upbeat Chinese data and a less-dovish RBNZ stance. With Fed rate-cut expectations weighing on USD, the setup favours buying dips toward support and targeting the 0.5773–0.5780 resistance zone. Structure remains bullish unless price closes below 0.5726.
⚠️ Disclaimer
This analysis is for reference only and does not constitute trading advice. Trading involves significant risk, and proper risk management is essential.
NZDUSD_2025-12-03_15-36-04 1.png
NZD/USD Price Outlook – Trade Setup📊 Technical Structure
FOREXCOM:NZDUSD NZD/USD is consolidating just below the 0.5600 handle after rebounding from multi-month lows near 0.5570. The broader structure remains bearish, with a clear sequence of lower highs and lower lows on the 4H chart.
Price is trading beneath the highlighted Resistance Zone at 0.5635–0.5642, while the Support Zone sits at 0.5577–0.5584. Recent candles show waning downside momentum (longer lower wicks, smaller bodies), hinting at short-term exhaustion, but the downtrend stays intact as long as price holds below the resistance band.
From a structural point of view, rallies into 0.5635–0.5642 are still viewed as areas where sellers may re-enter, targeting a retest of the 0.5584 region.
🎯 Trade Setup
Idea: Sell into resistance in line with the prevailing downtrend.
Entry: 0.5635 – 0.5642 (near Resistance Zone)
Stop Loss: 0.5651 (above resistance & recent swing high)
Take Profit 1: 0.5584 (top of Support Zone)
Take Profit 2: 0.5577 (support lows / extension target)
Risk–Reward Ratio: ≈ 1: : 3.07
Bias: Short-term bearish while NZD/USD trades below 0.5650. A 4H close above this level would invalidate the setup and suggest deeper correction toward 0.5700.
🌐 Macro Background
According to FXStreet’s latest commentary, NZD/USD is struggling to sustain moves above 0.5600, having fallen roughly 9% in less than four months as markets price in a dovish Reserve Bank of New Zealand (RBNZ) stance. Expectations are building for a 25 bps rate cut at Wednesday’s meeting, and the focus is now on the monetary policy statement for clues on further easing into 2026.
RBNZ side:
Markets widely expect one cut this week, with risks tilted toward a dovish message (more easing later if growth and inflation soften).
These expectations are acting as a headwind for the Kiwi, limiting any meaningful rebound despite oversold technical conditions.
USD side:
The US Dollar remains underpinned by reduced confidence in a December Fed rate cut, though upside is capped by upcoming heavy data (PCE, GDP, confidence).
Any stronger-than-expected US data would support the USD, reinforcing NZD/USD downside; softer data could trigger short-term squeezes higher but not necessarily a trend reversal unless the Fed narrative shifts clearly more dovish.
Overall, fundamentals still favour selling NZD on rallies, but the short-term oversold backdrop explains why price is hesitating under 0.5600 rather than collapsing straight to new lows.
🔑 Key Technical Levels
Resistance Zone: 0.5635 – 0.5642
Support Zone: 0.5577 – 0.5584
Intermediate Level: 0.5600 (psychological pivot)
Invalidation (bearish view): Sustained 4H close above 0.5650
📌 Trade Summary
NZD/USD remains in a downtrend, with 0.5635–0.5642 acting as a key supply area. The plan favours selling rallies into resistance, targeting a retest of 0.5584–0.5577, in line with RBNZ-driven Kiwi weakness and a still-supported USD.
Only a clear break above 0.5651 would suggest that bears are losing control and that a broader corrective recovery toward 0.5700 may be underway.
⚠️ Disclaimer
This analysis is for reference only and does not constitute trading advice. Trading involves significant risk, and proper risk management is essential.

NZDUSDNZDUSD
- Completed " 12345 " Impulsive Waves and " A " Corrective Waves
- Break of Structure
- RSI - Divergence
- Fibonacci Level - 61.80%
- Fair Value Gap

NZD/USD: Explosion Wave or Kiwi's Last BreathNZD/USD: Explosion Wave or Kiwi's Last Breath
📈 Weekly Scenarios
Bullish scenario: NZD/USD holds the ~0.582-0.588 zone, then breaks upwards through resistance at ~0.598-0.605 → growth to these levels within the impulse wave.
Consolidation: The price may hang between ~0.588 and ~0.605, forming an accumulation zone until the next move.
Bearish scenario: A downward breakout below ~0.582 with volume → possible decline to ~0.560-0.554 within the correction wave.
✅ Conclusion
NZD/USD is at an important decision point: either a strong upward impulse starts, or a corrective wave reverses.
Key levels—0.582-0.588 (support) and 0.598-0.605 (resistance)—will determine the future path.
The wave structure currently allows for both scenarios; it's important to wait for confirmation through price reaction at the indicated levels.

SELL NZDUSD - easy profitable trade opportunity!For many weeks NZDUSD has been dropping to the downside and is in a very clear downtrend. NZDUSD has tried to gain support but each time it holds onto support, it breaks through to the downside. NZDUSD recently tried to hold onto the latest support zone but once again it broke through which means it's time to sell and take profit at the next support level!

#NZDUSD:DXY Gaining Its Strength Back, Is it end for the Bulls? The OANDA:NZDUSD DXY index shows a change in price character and momentum, indicating a possible price reversal for the shorter term. This aligns with our fundamental analysis, as there’s a likelihood of a China-US trade deal that could significantly influence the demand for the DXY.
There are two possible selling entries, allowing you to choose between a riskier or safer approach. Alongside these entries, we’ve set targets accordingly to your chosen entry.
Good luck and trade safely!
Thank you for your unwavering support! 😊
If you’d like to contribute, here are a few ways you can help us:
- Like our ideas
- Comment on our ideas
- Share our ideas
Team Setupsfx_
❤️🚀

#NZDUSD: Final Drop Before Swing Bullish ReversalThe NZDUSD has dropped significantly in recent months without any proper bullish correction. Currently, the price is approaching a key level from which we believe it could finally reverse. However, as this is a swing setup, it might take months to complete. We wish you the best in trading and stay careful tomorrow.
Good luck,
Team Setupsfx_

NZDUSD is heading upwards - quick buy tradeNZDUSD has broken powerful a very powerful resistance level (the red trendline) - it was held for a few weeks but it finally broke through to the upside. It is now currently in an upward channel (green trendlines)... It is very likely to continue pushing upwards and head to the next resistance zone as the take profit (white line drawn).

NZD/USD Trims Gains, Will Bears Take Full Control?Market Analysis: NZD/USD Trims Gains, Will Bears Take Full Control?
NZD/USD is also moving lower and might extend losses below 0.5845.
Important Takeaways for NZD/USD Analysis Today
- NZD/USD declined steadily from 0.6000 and traded below 0.5900.
- There was a break above a connecting bearish trend line with resistance at 0.5860 on the hourly chart of NZD/USD.
NZD/USD Technical Analysis
On the hourly chart of NZD/USD, the pair also followed a similar pattern and declined from the 0.6000 zone. The New Zealand Dollar moved down and traded below 0.5950 against the US Dollar.
The pair settled below 0.5920 and the 50-hour simple moving average. Finally, it tested 0.5845 and is currently consolidating losses. There was a minor increase above a connecting bearish trend line with resistance at 0.5860.
If the pair recovers, it could face hurdles near the 23.6% Fib retracement level of the downward move from the 0.6007 swing high to the 0.5846 low at 0.5885 and the 50-hour simple moving average.
The next major barrier is at 0.5925 since it coincides with the 50% Fib retracement. If there is a move above 0.5925, the pair could rise toward 0.5945. Any more gains might open the doors for a move toward 0.5990 in the coming days.
On the downside, immediate support on the NZD/USD chart is near the 0.5845 level. The next major stop for the bears might be 0.5800. If there is a downside break below 0.5800, the pair could extend its decline toward 0.5750. The main target for the bears could be 0.5720.
This article represents the opinion of the Companies operating under the FXOpen brand only. It is not to be construed as an offer, solicitation, or recommendation with respect to products and services provided by the Companies operating under the FXOpen brand, nor is it to be considered financial advice.

NZD/USD Rises by ~1.4% in 2 DaysNZD/USD Rises by ~1.4% in 2 Days
As the NZD/USD chart shows, the New Zealand dollar was trading around 0.5820 against the US dollar on Wednesday, but today it has climbed above 0.5895 – an impressive gain of approximately 1.4% in just two days.
The rise in NZD/USD is being driven both by the general weakening of the US dollar ahead of the Federal Reserve’s expected September rate cut, and by strengthening demand for the “kiwi”. As Reuters notes:
→ the New Zealand dollar is often used as a substitute for the yuan because of close trade relations with China;
→ meanwhile, the yuan is strengthening, with Chinese policymakers recommending support for the currency given its low valuation and the need to facilitate trade negotiations with the US.
Technical Analysis of the NZD/USD Chart
It’s worth paying attention to the unusual trading activity (marked by the arrow) and its context:
→ it was the lowest level in more than four months;
→ after a sharp decline, the price stabilised near the lower boundary of the channel;
→ trading was fairly active, and although the price was drifting lower, it failed to generate strong bearish momentum.
It is possible that so-called Smart Money was attracted by the undervalued asset, preventing further declines through buy orders and accumulating long positions. If so, from this perspective it is notable that:
→ the 0.5820 level acted as support on Wednesday – the price rebounded sharply;
→ yesterday NZD/USD moved into the upper half of the channel, breaking through the 0.5875 resistance.
This week’s price rise has formed a trajectory marked by purple lines. NZD/USD might be heading towards the upper boundary of the ascending channel, with the following resistance levels standing out along the way:
→ the former support at 0.5910;
→ the 50% Fibonacci retracement level from the A→B move.
An attempt to break through this resistance zone could result in a pullback towards the lower boundary of the purple channel.
This article represents the opinion of the Companies operating under the FXOpen brand only. It is not to be construed as an offer, solicitation, or recommendation with respect to products and services provided by the Companies operating under the FXOpen brand, nor is it to be considered financial advice.

Market Analysis: NZD/USD Starts Recovery, Key Hurdles AheadMarket Analysis: NZD/USD Starts Recovery, Key Hurdles Ahead
NZD/USD is also rising and could aim for a move above 0.5900 in the short term.
Important Takeaways for NZD/USD Analysis Today
- NZD/USD is slowly moving higher above 0.5830.
- There is a major bearish trend line forming with resistance at 0.5870 on the hourly chart of NZD/USD.
NZD/USD Technical Analysis
On the hourly chart of NZD/USD, the pair followed AUD/USD. The New Zealand Dollar formed a base above the 0.5800 level and started a recovery wave against the US Dollar.
The pair climbed above the 50-hour simple moving average and 0.5830. There was a close above the 23.6% Fib retracement level of the downward move from the 0.5990 swing high to the 0.5830 low.
However, the bears are now active near the 0.5870 zone and a major bearish trend line. The NZD/USD chart suggests that the RSI is back above 60, signaling a positive bias. On the upside, the pair is facing resistance near 0.5870.
The next major hurdle for buyers could be near the 50% Fib retracement at 0.5895. A clear move above 0.5895 might even push the pair toward 0.5910. Any more gains might clear the path for a move toward the 0.5945 pivot zone in the coming sessions.
On the downside, there is support forming near the 0.5830 zone. If there is a downside break below 0.5830, the pair might slide toward 0.5800. Any more losses could lead NZD/USD into a bearish zone to 0.5740.
This article represents the opinion of the Companies operating under the FXOpen brand only. It is not to be construed as an offer, solicitation, or recommendation with respect to products and services provided by the Companies operating under the FXOpen brand, nor is it to be considered financial advice.

NZD/USD Holds Near Four-Month LowNZD/USD Holds Near Four-Month Low
As today’s NZD/USD chart shows, the pair is trading near a four-month low following a sharp decline. The drop occurred yesterday after the Reserve Bank of New Zealand cut the official cash rate by 25 basis points to a three-year low of 3.0% and indicated that the rate could fall further to 2.55% by May 2026.
According to Trading Economics:
- Analysts now expect at least two additional rate cuts before the end of the year;
- There is a risk of deeper cuts depending on incoming economic data.
New Zealand’s exports are also under pressure, particularly due to the 15% US tariffs that came into effect earlier this month, threatening to undermine the country’s competitiveness in key markets. According to Reuters, Citi analysts expect GDP to contract in the second quarter, raising the risk of a recession in New Zealand.
Technical Analysis of the NZD/USD 4-Hour Chart
NZD/USD price action since early July has formed a downward channel (marked in red), reflecting a bearish outlook. Key observations:
→ Yesterday’s drop was sharp, with a very long candle closing near its lows – a bearish signal;
→ However, the lower boundary of the channel acted as strong support, holding back further pressure.
Looking at the broader context:
→ The B→C recovery reached approximately the 0.618 Fibonacci retracement level after the A→B impulse;
→ The D→E rebound from the channel’s median was modest, signalling weak demand.
Given the strength of the channel’s lower boundary and the oversold condition (as shown by the RSI), bulls have some grounds to expect a potential rebound. In that case, NZD/USD could face resistance from the QL line, which divides the descending channel into two quarters.
Reaching the resistance zone formed by the channel median and the 0.589 level (previously acted as support during the inverse head and shoulders pattern - highlighted with arrows) could be difficult in the near term under current conditions.
This article represents the opinion of the Companies operating under the FXOpen brand only. It is not to be construed as an offer, solicitation, or recommendation with respect to products and services provided by the Companies operating under the FXOpen brand, nor is it to be considered financial advice.

NZDUSD short due to as exptected interrest rate decion by RBNZDThe current benchmark interest rate in New Zealand, known as the Official Cash Rate (OCR), is 3.0%, as set by the Reserve Bank of New Zealand (RBNZ). This follows a 25-basis-point cut from 3.25% on August 20, 2025, marking the lowest rate since August 2022.
Due to this result, we expect NZD to weaken against the USD.

Market Analysis: NZD/USD SlipsMarket Analysis: NZD/USD Slips
NZD/USD is struggling and might decline below the 0.5980 level.
Important Takeaways for NZD/USD Analysis Today
- NZD/USD is consolidating above the 0.5980 support.
- There is a connecting bearish trend line forming with resistance at 0.6010 on the hourly chart of NZD/USD at FXOpen.
NZD/USD Technical Analysis
On the hourly chart of NZD/USD at FXOpen, the pair also followed AUD/USD. The New Zealand Dollar struggled above 0.6100 and started a fresh decline against the US Dollar.
There was a move below the 0.6050 and 0.6020 support levels. A low was formed at 0.5978 and the pair is now consolidating losses below the 50-hour simple moving average. The NZD/USD chart suggests that the RSI is back below 50 signalling a bearish bias.
On the upside, the pair is facing resistance near the 23.6% Fib retracement level of the downward move from the 0.6120 swing high to the 0.5978 low. There is also a connecting bearish trend line forming with resistance at 0.6010.
The next major resistance is near the 0.6065 level or the 61.8% Fib retracement level. A clear move above the 0.6065 level might even push the pair toward the 0.6120 level. Any more gains might clear the path for a move toward the 0.6150 resistance zone in the coming days.
On the downside, there is a support forming near the 0.5980 zone. If there is a downside break below 0.5980, the pair might slide toward 0.5940. Any more losses could lead NZD/USD in a bearish zone to 0.5910.
This article represents the opinion of the Companies operating under the FXOpen brand only. It is not to be construed as an offer, solicitation, or recommendation with respect to products and services provided by the Companies operating under the FXOpen brand, nor is it to be considered financial advice.

NZDUSD Trade Idea. Key Levels for a Potential NZD/USD Short📉 NZD/USD is trending strongly bearish, and I’ve just posted a new breakdown on TradingView 🎥. The current price action looks overextended, and the pair remains under heavy selling pressure 🔻.
I’m watching for a potential retracement into the Fibonacci 50%–61.8% zone 🔄 — the equilibrium area where I’ll be eyeing a possible short entry 🎯.
The video covers entry ideas, stop-loss placement, and target levels 🎯📍.
⚠️ This is not financial advice — for educational purposes only.

NZD/USD Shows Bullish Hints, Can Gains Be Sustained?Market Analysis: NZD/USD Shows Bullish Hints, Can Gains Be Sustained?
NZD/USD is also rising and might aim for more gains above 0.6040.
Important Takeaways for NZD/USD Analysis Today
- NZD/USD is consolidating gains above the 0.6000 zone.
- There was a break above a major bearish trend line with resistance at 0.5970 on the hourly chart of NZD/USD at FXOpen.
NZD/USD Technical Analysis
On the hourly chart of NZD/USD at FXOpen, the pair started a steady increase from the 0.5880 zone. The New Zealand Dollar broke the 0.5920 resistance to start the recent increase against the US Dollar.
There was a break above a major bearish trend line with resistance at 0.5970. The pair settled above 0.5960 and the 50-hour simple moving average. It tested the 0.6040 zone and is currently consolidating gains.
The pair tested the 23.6% Fib retracement level of the upward move from the 0.5882 swing low to the 0.6040 high. However, the bulls are active above the 0.6000 level.
The NZD/USD chart suggests that the RSI is stable near 60. On the upside, the pair might struggle near 0.6040. The next major resistance is near the 0.6090 level.
A clear move above the 0.6090 level might even push the pair toward 0.6120. Any more gains might clear the path for a move toward the 0.6200 resistance zone in the coming days.
On the downside, immediate support is near the 0.5980 level. The first key support is near 0.5960. It is close to the 50% Fib retracement level.
The next major support is near 0.5920. If there is a downside break below the 0.5920 support, the pair might slide toward 0.5880. Any more losses could lead NZD/USD in a bearish zone to 0.5850.
This article represents the opinion of the Companies operating under the FXOpen brand only. It is not to be construed as an offer, solicitation, or recommendation with respect to products and services provided by the Companies operating under the FXOpen brand, nor is it to be considered financial advice.
