Devon Energy: A High-Dividend Setup Worth WatchingA shale specialist with big dividends, when the price is right.
Devon Energy is a U.S.-based oil and gas company focused on domestic shale production, particularly in the Delaware Basin, one of the most cost-efficient regions. It’s known for paying a “variable dividend”, meaning payouts rise when profits rise, and shrink when oil prices fall.
With its smaller size, Devon is more volatile than oil giants, but also more agile when prices are strong.
✅ Key Strengths:
- High dividends when oil prices are elevated.
- Efficient, low-cost production in the Delaware Basin.
- Strong upside when Brent crude rises.
⚠️ Potential Risks:
- Dividends decrease sharply if oil prices fall.
- More price swings due to smaller market cap and higher sensitivity.
📈 Technical View
As someone who appreciates structure in technical analysis, I have to say: this chart is a gem. Clean movements, clear tops and visually logical price behaviors.
Let me break it down:
From its all-time high in 2008, DVN went through a long downtrend — making a series of lower highs (LH) and lower lows (LL). For over a decade, buyers couldn’t gain control, even for short-term higher highs.
But that changed in 2020.
That rally brought a long-awaited structural shift: a higher high (HH), meaning buyers finally pushed the price above a previous high. The trend reversed, and the sentiment flipped.
Now what?
The stock has done a textbook pullback, a normal retracement after a strong move.
It currently sits at a critical technical confluence zone:
- The 61.8% Fibonacci retracement (often referred to as the “golden ratio”)
- A well-defined horizontal support level
- Structurally healthy trend
- Clear prior breakout
👉 Technically, this is a sound setup: structure + support + healthy trend. If buyers defend here, upside potential is strong.
Regards,
Vaido
This post is for educational purposes only and reflects my personal opinion, not investment advice.
Oilprice

Gold, silver, and crude oil strategy analysisTo conclude, gold maintains a relatively volatile bullish trend. Today, we expect it to continue its upward trend towards the 3360 target. If it fails to break through this level, it will pull back. A break above 3360 will confirm its continued strength.
On Monday, gold initially fell, then rose, and then fell again, forming an extreme sweep. There's no need to discuss the direction at this point. I'm certain it's a bullish trend. With the Federal Reserve confirming a September rate cut and geopolitical uncertainty still uncertain, gold is unlikely to see a significant bearish move. The current trend remains bullish, but the dollar's strength is putting pressure on gold, which is now experiencing a low-level correction. Therefore, the current upward trend has failed to sustain. Therefore, given the direction, as long as the key resistance level cannot be broken above, the trade should be considered a range-bound trend. A break above this resistance level will confirm the continuation of the bullish trend.
From a technical perspective, the daily chart shows signs of bottoming, but the pattern is still uncertain. Looking at the past two trading days, the 4-hour Bollinger Bands are currently tightening, indicating a clear volatile trend. However, under pressure from the middle Bollinger Band, the market is relatively weak and volatile. Therefore, today's rebound will first focus on the gains and losses at 3345, and then see whether 3360 will be broken. Gold showed a similar pattern after opening on Monday and Tuesday: a sharp drop at the opening, followed by a strong rebound. Therefore, if gold tests around 3326 today, it is almost certain that gold will fluctuate higher. Focus on 3360 above. If it breaks through 3360, it could continue to rise. If it fails to break through 3360, it will be considered a volatile market, with further declines to be expected.
International silver prices briefly rose to 38.2 on Monday before fluctuating and falling, closing around 38. The market has not changed much. After repeatedly testing the 37.5 support level and failing to break, silver is definitely in a bullish trend. 37.5 is a strong and weak support point, so the overall bullish trend is also fluctuating at a high level. This week, we'll maintain this strategy. We'll first examine the high point of the high-level fluctuation, with the 38.5 and 39 highs on the upside in focus. Therefore, we'll maintain support at 37.5 this week and anticipate a slow rise. If the momentum isn't strong, we'll target the 38.5 high. If the trend shows strength, we'll continue to target the 39 high.
US crude oil rebounded at the 62 support level on Monday, meeting expectations. However, the rebound wasn't strong enough, peaking around 63.7 and closing around 63.2, forming a low-level fluctuation pattern. Therefore, we'll continue to monitor the 62 support level on Tuesday. If it breaks, crude oil could continue to fall, and continued weakness could lead to a further decline, potentially towards 58. If the 62 support level holds, crude oil will continue to fluctuate at a low level, with a test of 64.5 on the upside. Of course, once it stabilizes at 64.5, crude oil could potentially bottom out, with the 66 and 70 highs on the upside in focus.

Crude oil fell as expected, take your profitsThe short positions we previously opened near 62.5 for US crude oil have now fallen smoothly and made substantial profits. Please pay attention to the support strength at the 60 position. Conservative investors can close their positions and pocket the profits.

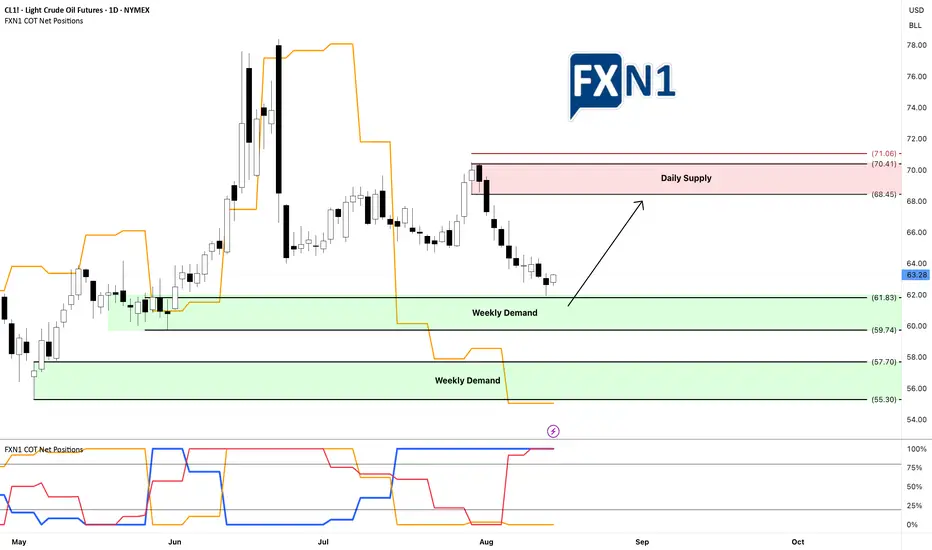
Oil Market Insights: Demand Zones and Future FundamentalsYesterday, CL1! oil tested and rebounded from my weekly demand zone without triggering my entry, resulting in a missed opportunity for several points. This suggests to me that there is buying interest at this level, regardless of the fact that non-commercial traders are short. I am now looking for a retest of this area—if I'm fortunate—to enter a long position. I am also awaiting the new COT data tomorrow to assess any potential shifts in fundamentals. Additionally, I am considering the presence of a stronger demand zone below, which appears even more promising. We'll see how it unfolds.
✅ Please share your thoughts about CL1! in the comments section below and HIT LIKE if you appreciate my analysis. Don't forget to FOLLOW ME; you will help us a lot with this small contribution.
USOIL H2 BEARISH CHANNEL BREAKOUT Usoil H2 Bearsih Channel Breakout
Price From Break The Channel : 63.0
We Are Looking For A Bullish Moment At Entry 63.0 / 60.0
Targeting Area Buy Side Liquidity Area 70.0
Manage Your Trade Properly And Follow Us For More Trades

WTI: Oil Markets on Edge Despite Trump Considering Major TariffsOil prices could drop if Trump backs down on tariffs on countries buying Russian oil, but short-term bullish catalysts, like geopolitical tensions and bullish speculative bets, may still push prices up before longer-term headwinds take hold.
----------------------------------------------------------------------------------------------------------------------
Trump’s threats of steep tariffs on countries buying Russian oil have sent oil prices surging, as traders fear a global supply crunch if Russian barrels are cut off.
But here’s the twist: Trump has a history of backing down or delaying tariffs after using them as leverage. When he does, oil prices usually fall, as the immediate risk of supply disruption fades.
If he caves in again by the deadline, which is 10 to 12 days from 4 August, or extends it, oil prices could drop. The bigger picture also appears bearish: OPEC+ is ramping up supply, global demand is slowing and expected to drop in H2, and inventories are rising (first glimpse by EIA, Wed).
But with the deadline falling around 14–16 August, 2025, short-term bullish catalysts could spark a rally up to the 38.2%-61.8 % Fibonacci retracement levels, positioning WTI better for declines (conditional on Trump!).
This content is not directed to residents of the EU or UK. Any opinions, news, research, analyses, prices or other information contained on this website is provided as general market commentary and does not constitute investment advice. ThinkMarkets will not accept liability for any loss or damage including, without limitation, to any loss of profit which may arise directly or indirectly from use of or reliance on such information.

Crude oil: Sell around 66.50, targeting 63.00-60.00Crude Oil Market Analysis:
We've stated this dozens of times before: the overall trend of crude oil is bearish. As long as crude oil doesn't break above 70.00, we can maintain our bearish outlook. Today, we maintain our bearish outlook and continue to sell on any rebounds. Crude oil fundamentals don't support buying. The previous easing of tensions in the Middle East has also been suppressing crude oil prices for a long time, and the ever-changing tariff war is also suppressing crude oil. However, crude oil hasn't broken through 63.00 yet. Today, we're focused on selling if it breaks through. If it doesn't, we'll wait for a small rebound to sell. Focus on selling at 66.50.
Fundamental Analysis:
The tariff war has been the most influential fundamental factor affecting gold recently, and in the long term, it supports gold. This surge in gold prices is driven by Trump's renewed turmoil. Furthermore, the Federal Reserve's future monetary policy remains a key focus.
Trading Strategy:
Crude oil: Sell around 66.50, targeting 63.00-60.00.

WTI Crude Oil – Range Support in FocusWe're waiting for price to reach the bottom of the range, and with a solid buy signal, we’ll consider going long.
However, since this level has been tested multiple times, it’s highly vulnerable to stop fishing — so caution is key.
As always, we’re ready for all scenarios:
If price breaks below, we’ll wait for a pullback to enter short.
But right now, we’re watching the range support for potential longs

BUY USOILI'm sharing with you our 2nd trade for the day which is agail on USOIL, you can see that the price came to grab the 1H LQ, then we got us a reversal we just took.
Follow for more!

Crude oil: Sell around 70.20, target 65.00-64.00Crude Oil Market Analysis:
Yesterday's crude oil market was very strong, with buying driving the market higher. The daily chart ultimately closed with a clear bullish candlestick. Buying on the daily chart is testing the resistance level between 70.00 and 70.60. After two consecutive days of bullish closes, and with clear bullish candlesticks, I predict another surge today. Let's look at the daily chart. The daily chart shows a significant rebound after a significant drop. Today, focus on selling opportunities between 70.00 and 70.60. A break of this level will change the overall selling trend. The strategy remains to sell high and be bearish.
Fundamental Analysis:
Today, focus on the ADP employment data and the EIA crude oil inventory data. The key news will be the interest rate results during the US trading session, along with speeches.
Trading Recommendations:
Crude oil: Sell around 70.20, target 65.00-64.00

Crude oil-----sell near 67.50, target 65.00-64.00Crude oil market analysis:
The idea of crude oil today is still bearish. Xiaoyang predicts that it will rebound first and then continue to fall. Consider selling near 67.50 if it rebounds. Crude oil is basically weak if it does not stand above 70.00. Crude oil is a repair market after a big drop. In theory, it will continue to fall after the repair. In addition, pay attention to crude oil inventory data later.
Operation suggestions:
Crude oil-----sell near 67.50, target 65.00-64.00

Crude oil-----sell near 67.00, target 65.00-63.00Crude oil market direction:
The recent daily crude oil line has been hovering, and it feels like it is falling or not falling. The daily crude oil line is still bearish. Let's continue to sell it on the rebound. For crude oil today, we focus on the suppression of 67.00. Consider selling it at this rebound position. The daily crude oil line needs to break the 64.00 position to see real selling force, otherwise it is a repair shock with a very small amplitude.
Fundamental analysis:
The latest news is that the United States and the European Union have reached a 15% tariff agreement, which overall supports the US dollar and suppresses gold. In addition, this week, pay attention to ADP employment data, non-agricultural employment data, and the Federal Reserve's interest rate decision and speech.
Operation suggestions:
Crude oil-----sell near 67.00, target 65.00-63.00

Crude oil market analysis: Crude oil has not moved much, but it Crude oil market analysis:
Crude oil has not moved much, but it is a good short-term operation opportunity. Sell small when it rebounds, sell big when it rebounds. Crude oil will basically not trap you. It is difficult to end the selling in the short term. It will basically decline in the future. You can sell when it rebounds near 67.00 today. If it breaks 64.00, it will directly dive. The daily line of crude oil has formed a shock pattern. You can sell at the break position of 64.00.
Operation suggestions:
Crude oil---sell near 67.00, target 65.00-63.00

Crude oil-----sell near 66.00, target 65.00-63.00Crude oil market analysis:
The recent daily crude oil line has been fluctuating slightly. It is still bearish to sell at a high price. Crude oil is unlikely to rebound or rise sharply without fundamental support. The hourly crude oil suppression position is 66.40 and 67.50. Today we are close to 66.00 to consider selling opportunities. The daily moving average of crude oil is starting to go down. If 64.00 is broken, it will start to fall sharply.
Operational suggestions
Crude oil-----sell near 66.00, target 65.00-63.00

Crude oil------sell near 68.80, target 66.00-62.00Crude oil market analysis:
Recent crude oil is actually very easy to operate. Sell when it rebounds to a high position. Don't worry about the position. In addition, the daily K-line has also begun to decline, and it is difficult to form a large rebound. The new daily moving average begins to sort. If there is no fundamental support in the future, crude oil has a lot of room to fall, and it will fall below 58 in the future. Sell it when it rebounds to around 68.80 today.
Fundamental analysis:
Today is a holiday in Tokyo, Japan. In addition, there is no major data this week. We focus on the fundamentals. Trump's tariffs are still a focus.
Operational suggestions:
Crude oil------sell near 68.80, target 66.00-62.00

Crude oil-----Sell near 66.80, target 65.00-62.00Crude oil market analysis:
The recent crude oil daily line began to decline, but a small V appeared last night, which was also caused by the situation in the Middle East. Israel bombed Syria and crude oil began to rebound. Overall, crude oil is still bearish. We consider continuing to sell it when it rebounds. It has not broken near 64.00, and it is difficult to form a large unilateral. The suppression position is near 66.80. Consider selling it near it.
Fundamental analysis:
Trump’s dissatisfaction with Powell has not been a day or two. Conflict is inevitable, and the impact on gold is also short-term. Yesterday’s pull-up and dive is a case in point.
Operational suggestions
Crude oil-----Sell near 66.80, target 65.00-62.00

Crude oil------sell near 70.00, target 66.70-63.00Crude oil market analysis:
Recently, crude oil has been rising, and buying is slowly climbing, but the amplitude is not particularly large. The daily line has not formed a large buying pattern. It is currently a technical repair market after falling too much. Today's idea is to sell on the rebound. Pay attention to the suppression near 70.00. If this position is broken, it may change the short-term trend and buying may rise.
Fundamental analysis:
Last week, Trump increased tariffs on Canada and is about to increase tariffs on Brazil. There is no sign of stopping the tariff war. It is long-term bullish for gold. The situation in the Middle East has not completely stopped, and it is also long-term suppression of the US dollar to support gold.
Operation suggestions:
Crude oil------sell near 70.00, target 66.70-63.00

Is WW3 Coming? Crude Waves Flash Warning which I DO NOT LIKE ITI’m getting a knot in my stomach looking at this chart, it feels like a warning about what’s coming.
Chart Context
• WTI jumped from the pandemic low of 6.62 up to 131.02 on March 6, 2022.
• It then retraced to 59.86 (38 % Fib) by June 4, 2025.
• That pullback seems complete, and now price is pressing against a descending wedge.
Wave Map
• Wave 3 could extend toward 207
• A full five-wave run points up near 330
• The pattern is squeezed in a tightening channel that looks ready to break any day
Why It Feels Risky
Breaking above 200 normally requires a major supply shock—think trouble at the Strait of Hormuz, surprise OPEC cuts, or a hit to U.S. shale. The Iran–Israel cease-fire is shaky, drones are still buzzing storage sites, and even a brief chokepoint shutdown would send tanker traffic into chaos. To me, the chart is flashing that tail risk.
Trading Plan
• I’ll watch the wedge’s upper trendline around 83 for my first signal
• A weekly close above 93 would clear the path to 117, then 145
• If price closes below 51 on the week, this thesis is off
Your Thoughts?
Does this wave count make sense, or am I reading too much into it? Drop your views—especially if you’ve got the geopolitical angle covered. I hope this wave doesn’t play out, but pretending it’s not there feels reckless.
(Not financial advice)

CRUDE set to fire 82 $ 90 $ 104 $ ????Crude Daily Elliot waves count suggest big UP setup in progress right now
55 $ key level to watch for buyer Extension point
Due to amid middle-east war situation may trigger Up move impulse wave towards 82 $ to 104 $ range
EW count are keeping changing during different price action in different time frame & multiple forecast .
this educational based chart as per EW theory method

CRUDE OIL poised to go UP AGAIN? Usually my posts on crude oil are short. but here’s a longer one for a change.
Back in December, I predicted that crude oil would hit the highlighted zone around $57. That’s exactly what happened, hit the target and bounced.
Over the past two weeks, we’ve seen wild swings in crude oil prices as tensions between Iran and Israel escalated. But now, following the ceasefire announcement brokered by President Trump, and considering Iran’s response over the past couple of days, crude oil has dropped below its pre-conflict price levels.
While I truly hope for a peaceful world where no innocent lives are harmed, my personal view is that this ceasefire feels fragile and may not last long.
So, what’s next for crude oil? Up or down?
If the ceasefire holds and we don’t see further conflict in the Middle East, I think crude oil could hover in the $65–$75 range. There’s even a slim chance we dip as low as $45.
However, based on my technical analysis model, and my doubts about the durability of the ceasefire, I expect oil prices to rise in the next 6 to 9 months. My targets? $78 and $85.
Of course, I might be wrong this time. :)
Cheers!

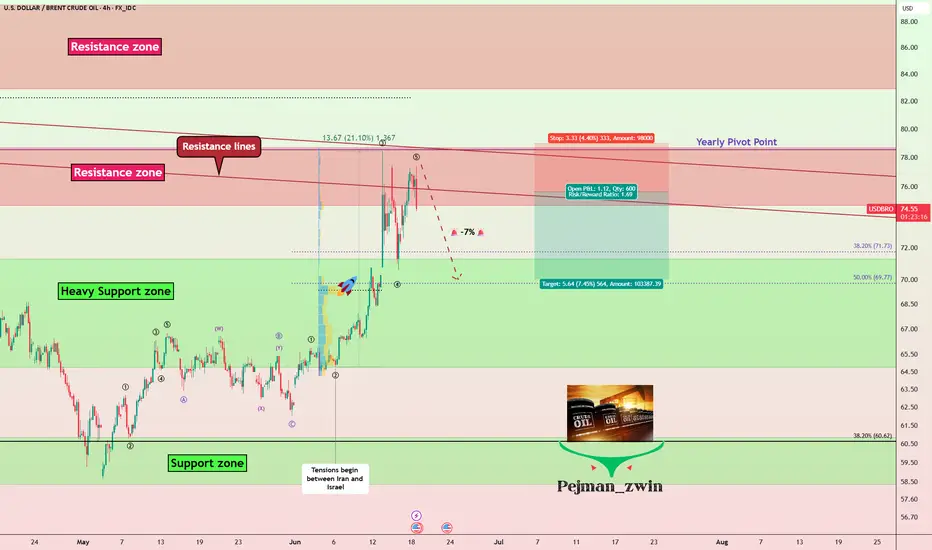
Geopolitics vs. Technical: Will Oil Correct -7%?Oil ( FX_IDC:USDBRO ) rose more than +20% after the start of tensions between Iran and Israel on Friday . I hope this tension ends as soon as possible because tensions have no winners.
The behavior and price movements of oil will certainly depend on the increase or decrease of tensions in the Middle East , but for the coming hours we can have a technical view .
Oil is currently moving in the Resistance zone($78.70-$74.70) and near the Resistance lines and the Yearly Pivot Point .
In terms of Elliott Wave theory , it seems that Oil has completed the second five-impulse waves . So that wave 5 is Truncated .
I expect Oil to decline in the coming hours, this decline could be -7% .
Note: If the USA is added to the Middle East tensions, Oil prices could rise again, so pay more attention to capital management.
Note: Stop Loss: $79.00
Please respect each other's ideas and express them politely if you agree or disagree.
U.S. Dollar/ BRENT CRUDE OIL (USDBRO), 4-hour time frame.
Be sure to follow the updated ideas.
Do not forget to put a Stop loss for your positions (For every position you want to open).
Please follow your strategy and updates; this is just my Idea, and I will gladly see your ideas in this post.
Please do not forget the ✅' like '✅ button 🙏😊 & Share it with your friends; thanks, and Trade safe.
WTI Oil: further downside?Front page news this morning focussed on the ceasefire between Israel and Iran, first announced by US President Donald Trump on his Truth Social platform. However, reports recently emerged of Iran firing missiles, seemingly violating the ceasefire, but no confirmation has been received yet. The point is that things remain somewhat uncertain as of writing.
The technical front, nevertheless, is interesting on WTI Oil (West Texas Intermediate), and ultimately points to a moderate pullback before heading lower.
Monthly descending triangle in play
The flow on the monthly chart reveals that price action completed a descending triangle in April this year, formed between US$95.00 and US$64.41. Following the breach of the lower boundary and refreshing year-to-date (YTD) lows of US$55.15, a determined pullback materialised and resulted in the unit testing the upper barrier of the pattern. As you can see, the test has held for now, with June poised to end the month considerably off its best levels.
Given that price has aggressively rejected the upper boundary of the triangle formation, and if we see WTI push to fresh YTD lows, this would unearth a possible bearish scenario in the direction of support from US$42.57.
Daily Fibonacci resistance
Across the page on the daily chart, you will note that recent flow touched gloves with support at US$64.55, a level complemented by a 1.272% Fibonacci projection ratio at US$64.76, a trendline support (extended from the low of US$55.40), and a neighbouring 61.8% Fibonacci retracement level at US$63.70. Given that the 1.272% Fibonacci projection ratio also represents an ‘alternate’ AB=CD support pattern, traders that are long from US$64.55 may aim for the 38.2% and 61.8% Fibonacci retracement ratios of US$69.53 and US$72.59. Consequently, both of these lines serve as potential resistance levels to watch.
H1 confluence
With monthly price suggesting further selling, and daily resistance on the table, the H1 chart shines the spotlight on two levels of resistance at US$68.35 and US$70.14. However, I am more drawn to the latter level as a potential resistance. This is because it converges closely with the 38.2% Fibonacci retracement ratio on the daily timeframe mentioned above at US$69.53, as well as a nearby 1.618% Fibonacci projection ratio on the H1 chart at US$69.13.
As a result, my focus will be on H1 resistance between US$70.14 and US$69.13.
Written by FP Markets Chief Market Analyst Aaron Hill

OIL: THE CHART THAT COULD TIP THE WORLDWTI Crude just bounced hard off the $65 channel support, tagging resistance at $76 — and what happens next isn’t just about price. It’s about power.
Zoom into this chart:
We're sitting at a directional pivot with two possible outcomes:
1️⃣ If this was a truncated 5th wave, the structure is complete. Any further war escalation could be the catalyst for oil to break resistance — dragging down risk assets, including CRYPTOCAP:BTC and equities.
2️⃣ If wave 5 isn’t done, we’ll likely see one more sharp leg down before oil launches. Either way, this is a high-stakes Elliott Wave setup with global macro consequences.
Chart with FIB Levels:
You'll see the wave I’ve marked (3) is messy, and on lower timeframes, that may hint at a truncated move worth watching.
Why this matters:
Over 20% of global oil flows through the Strait of Hormuz, a critical chokepoint controlled by Iran. If conflict escalates, that line gets squeezed… and oil price explodes.
Price to watch:
$76 resistance.
If oil breaks, the markets will react fast.
If it fails, we might get one more correction and maybe some relief from the sideways pain we’ve seen across risk assets.
Remember the COVID Crash?
Oil literally went below zero in April 2020. That wasn't just a chart anomaly, it was a global demand collapse. Traders were paying to get rid of oil because there was nowhere to store it. That moment marked a generational low, and what followed was a powerful multi-year 5 wave up.
Now look where we are:
That same COVID low helped form the base of the current Elliott Wave structure. The fact we’re back testing levels that once sparked global panic is no coincidence.
If you’ve been here before, you’ll see the signs. The charts always leave traces. And if this is the end of wave 5, it could be the start of a whole new macro move.
TLDR:
Stop trading headlines.
Trade the structure.
This chart is telling us everything.
