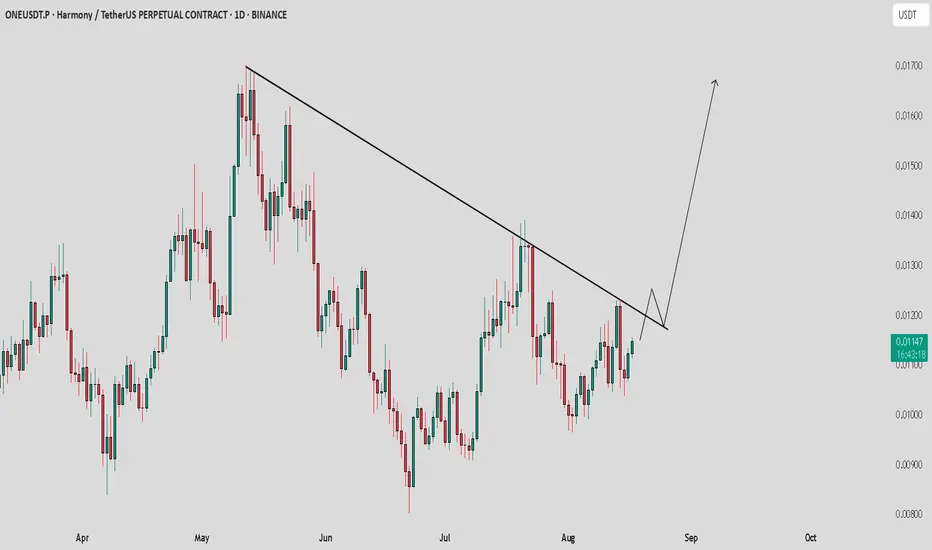
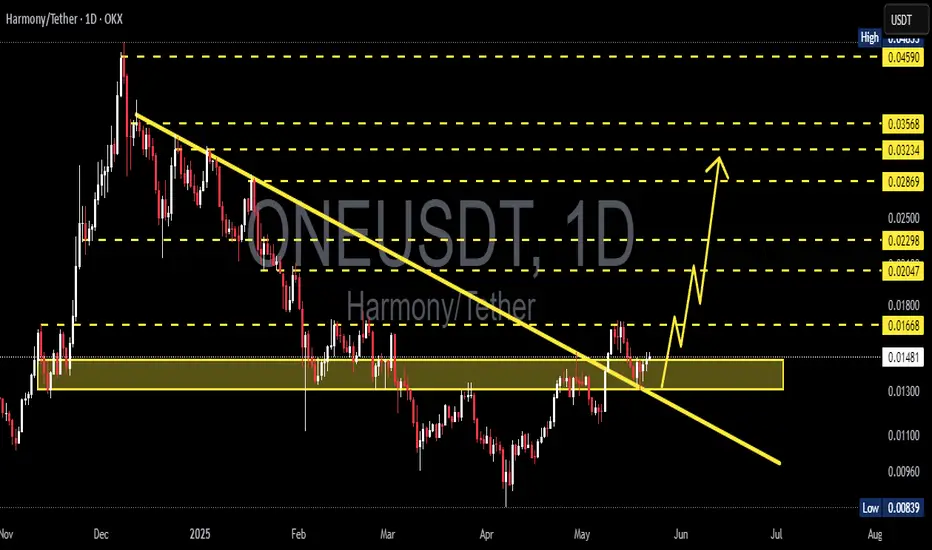
ONE /USDT: Approaching Trendline resistance , Expecting breakoutONE/USDT is approaching trendline resistance with strong bullish momentum. A breakout here could lead to a solid move towards $0.015. Keep an eye on this key level for a potential rally! I believe this setup holds a lot of upside potential, and patience could pay off with this breakout.
Oneusdtlong
ONE/USDT — Breakout or Breakdown Ahead?📊 Complete Analysis of ONE/USDT (1D)
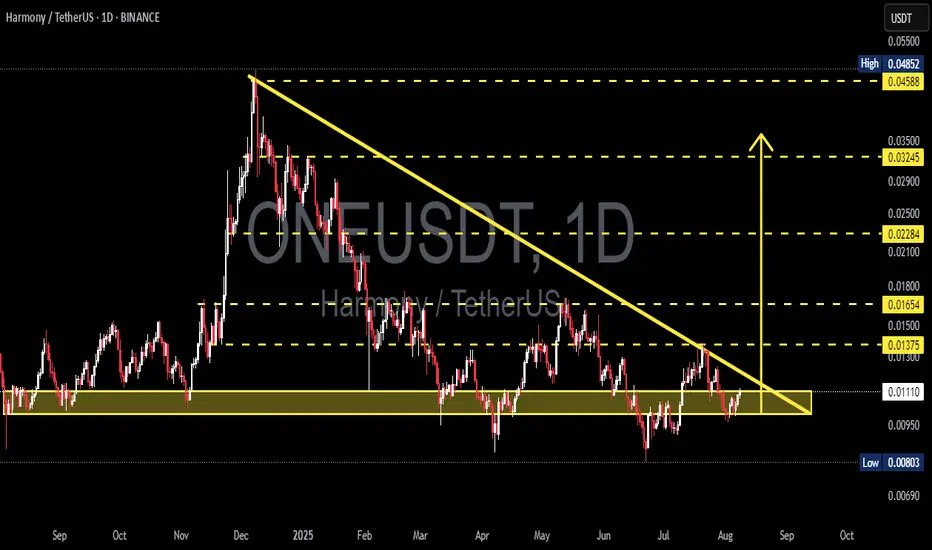
ONE is currently trading around $0.0111, sitting right at a critical junction between the major support zone ($0.0095–$0.0115) and a descending trendline that has been pressing price down since the December–January peak.
This setup forms a descending triangle pattern — typically a bearish continuation pattern, but under certain conditions it can flip into a strong bullish reversal if price breaks upward with volume.
---
🔍 Technical Details & Pattern
Primary Trend: Bearish since the late 2024 peak, with consistent lower highs.
Key Support Zone: $0.0095–$0.0115 (historical demand zone, tested multiple times since September 2024).
Dynamic Resistance: Descending trendline connecting lower highs.
Important Horizontal Levels:
$0.01375 → Nearest breakout confirmation resistance.
$0.01654, $0.02284, $0.03245, $0.04588 → Potential mid-term upside targets.
$0.00803 → Nearest low and first breakdown target.
Volume Factor: Breakout or breakdown must be confirmed by high trading volume.
---
🟢 Bullish Scenario (Breakout Upward)
If price breaks and closes daily above the descending trendline and clears $0.0138, the likelihood of a reversal increases.
Potential upside targets:
1. $0.0165 → Psychological resistance & minor supply zone.
2. $0.0228 → Major resistance and previous distribution area.
3. $0.0324–$0.0458 → If momentum extends further.
Strategy:
Enter after breakout + successful retest as new support.
Stop loss below $0.0095 to avoid fakeouts.
Watch for volume: without strong volume, risk of a bull trap is high.
---
🔴 Bearish Scenario (Breakdown Lower)
If price breaks and closes daily below $0.0095, the descending triangle pattern confirms as a bearish continuation.
Potential downside targets:
1. $0.00803 → Significant low and possible bounce area.
2. $0.0069 → Historical lowest level since 2023.
3. Below $0.0065 → Potential new lows if selling pressure escalates.
Strategy:
Enter after breakdown + failed retest above $0.0095.
Stop loss above $0.012–$0.013 to avoid short squeezes.
Adjust position size — volatility can spike sharply post-breakout.
---
📌 Key Points to Monitor
Convergence of Buyers & Sellers: The closer price moves toward the triangle’s apex, the higher the chance of a breakout in either direction.
Lengthy Consolidation: Post-breakout moves are often stronger after extended consolidation.
Risk Management: Avoid going all-in before confirmation; consider scaling entries.
Market Sentiment: Watch BTC & ETH — a bearish macro crypto environment increases the risk of a downside move.
---
📍 Conclusion
ONE/USDT is currently at a make-or-break zone.
📌 Bullish breakout → Potential rally toward $0.0165+
📌 Bearish breakdown → Likely drop toward $0.0080 or lower.
Traders should wait for daily close confirmation + strong volume to reduce false breakout risk.
The $0.0095–$0.0115 zone is the last major defense line for buyers in the medium term.
#ONEUSDT #HarmonyONE #CryptoAnalysis #TechnicalAnalysis #PriceAction #DescendingTriangle #Breakout #Breakdown #Altcoins #CryptoTrading
#ONE/USDT Reversal Building#ONE
The price is moving within a descending channel on the 1-hour frame, adhering well to it, and is poised to break it strongly upwards and retest it.
We have support from the lower boundary of the descending channel, at 0.01252.
We have a downtrend on the RSI indicator that is about to break and retest, supporting the upward move.
There is a key support area (in green) at 0.01200, which represents a strong basis for the upward move.
Don't forget one simple thing: ease and capital.
When you reach the first target, save some money and then change your stop-loss order to an entry order.
For inquiries, please leave a comment.
We have a trend of stability above the Moving Average 100.
Entry price: 0.01257
First target: 0.01312
Second target: 0.01368
Third target: 0.01444
Don't forget one simple thing: ease and capital.
When you reach the first target, save some money and then change your stop-loss order to an entry order.
For inquiries, please leave a comment.
Thank you.

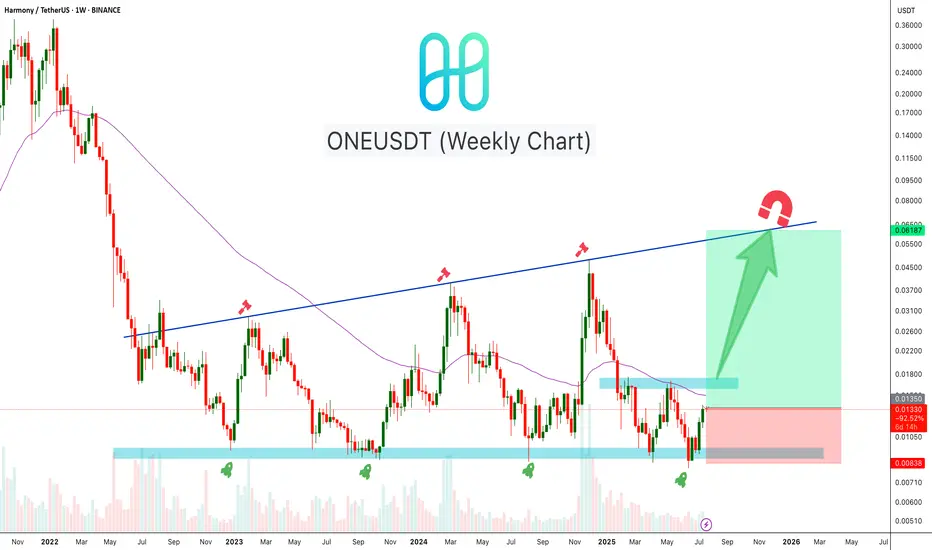
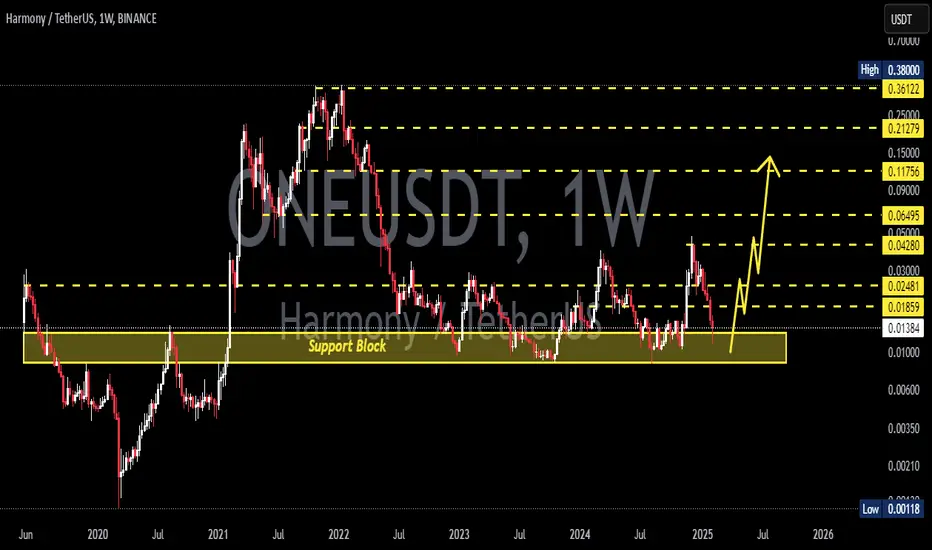
ONEUSDT Reversal BuildingONEUSDT is forming a strong base near the weekly demand zone around $0.009–$0.010, which has held multiple times over the past two years. The chart shows a clear accumulation pattern with higher lows forming. Price is now approaching the mid-range resistance near $0.017. If momentum continues, ONE may revisit the long-term trendline resistance near $0.065–$0.070.
Cheers
Hexa
ONEUSDT at Make-or-Break Zone Major Reversal or Breakdown Ahead?📌 Overview:
ONEUSDT is currently sitting at a major historical support zone around $0.0080–$0.0093 (highlighted in yellow).
📉 This level has been tested multiple times since 2022, and continues to hold – signaling strong accumulation and potential for a major reversal.
🧠 Key Pattern in Focus:
✅ Triple Bottom Pattern
The Triple Bottom is a classic bullish reversal pattern, reflecting the strength of buyers after multiple failed attempts to break the support.
🔁 It’s typically followed by a surge in momentum if a breakout confirms the reversal.
🚀 Bullish Scenario (Reversal in Play):
🔸 Condition: Price holds above $0.0080 and begins forming higher lows.
🔸 Confirmation: A breakout and retest above the $0.01258 resistance level.
🎯 Upside Targets: 1️⃣ $0.01258 → Minor Resistance
2️⃣ $0.01644 → Previous structure high
3️⃣ $0.02285 → Major supply zone
4️⃣ $0.03530 → Psychological and technical target
🔍 With strong bullish momentum and volume support, a mid-term move toward $0.04900+ is possible.
🛑 Bearish Scenario (Breakdown Risk):
🔻 Condition: Price breaks down below $0.0080 with strong volume.
🔻 Risk: No clear support below this level → price could enter uncharted territory or set new All-Time Lows.
📉 Indicates complete seller dominance and failed demand structure.
🔍 Conclusion:
ONEUSDT is at a critical inflection point – a strong rebound opportunity or a breakdown toward new lows.
📌 Price action over the coming days will be key in determining the mid-term trend.
📈 Aggressive traders may look for early entries, while conservative traders should wait for breakout confirmation.
📢 Extra Notes:
🔔 Confirmation is key for this setup.
💡 Combine with indicators like RSI, MACD, or Volume Profile for added confluence.
⚠️ Risk management is essential — stop loss below $0.0080 recommended for long entries.
#ONEUSDT #HarmonyONE #CryptoBreakout #TripleBottomPattern #BullishSetup #AltcoinAnalysis #CryptoReversal #SupportZone #BreakoutZone #TechnicalAnalysis

ONEUSDT 5D AnalysisONE ~ 5D Analysis
#ONE Buy back gradually from here if you still have confidence in this coin with a short term target of at least 20%+ from this support.

#ONE/USDT#ONE
The price is moving within a descending channel on the 1-hour frame and is expected to break and continue upward.
We have a trend to stabilize above the 100 moving average once again.
We have a downtrend on the RSI indicator that supports the upward move with a breakout.
We have a support area at the lower limit of the channel at 0.01147, acting as strong support from which the price can rebound.
Entry price: 0.01183
First target: 0.01210
Second target: 0.01236
Third target: 0.01268

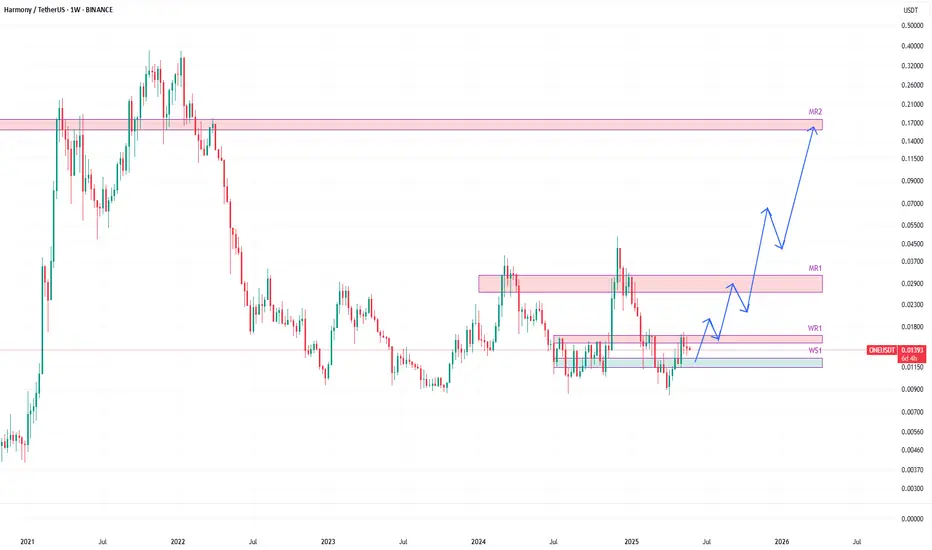
ONEUSDT likely to head towards 0.16 zoneONEUSDT is another one trading between weekly resistance WR1 and weekly support WS1.
The price has been retracing back to WS1 after hitting WR1. It is likely to hit WS1 before having a bounce.
WS1 is likely to provide a good bounce and the fuel for its upward journey in coming weeks and months.
The future of this one looks quite promising.
The price is likely to break WR1 on the next bounce from WS1 and likely to continue its journey towards monthly resistance MR1.
With some pullbacks here and there on various resistance milestones, the price is likely to aim for monthly resistance MR2.
ONEUSDT 1D AnalysisONE ~ 1D Analysis
#ONE Buy gradually from here with a short-term target of at least 10%++ from here.
#ONE/USDT#ONE
The price is moving within a descending channel on the 1-hour frame, adhering well to it, and is on its way to breaking it strongly upwards and retesting it.
We are seeing a bounce from the lower boundary of the descending channel, this support at 0.01298.
We have a downtrend on the RSI indicator that is about to break and retest, supporting the upward trend.
We are looking for stability above the 100 moving average.
Entry price: 0.01380
First target: 0.01474
Second target: 0.01582
Third target: 0.01695

ONEUSDT | Major Resistance Ahead at the Deep Red BoxI’ve shaded the red box extra dark because it really is a formidable barrier. Historically, price has stalled and reversed here, so if ONEUSDT manages to break through this zone, it could fuel a strong move higher. Until then, caution is essential.
Key Points to Watch
Red Box = Heavy Resistance
Sellers have been lining up in this area. Any rally into this zone could be met with aggressive selling pressure.
Confirmation Needed
I’ll wait for clear signs of a breakout on lower time frames—ideally a clean close above the red box followed by a successful retest. CDV shifts and rising volume must support that move before I even consider going long.
Flexible Bias
I will not insist on my short idea. If price breaks up through the red box without giving a proper downward break first, I’ll drop the bearish view. If instead that breakout holds with volume and retests as support, I’ll flip bias and look for longs.
This is one of those rare levels where preparation and patience pay off. Let the market prove its strength or weakness here, then act with confidence. Remember that well‑managed risk and strict confirmation criteria are your best allies in navigating tough resistance zones.
📌I keep my charts clean and simple because I believe clarity leads to better decisions.
📌My approach is built on years of experience and a solid track record. I don’t claim to know it all but I’m confident in my ability to spot high-probability setups.
📌If you would like to learn how to use the heatmap, cumulative volume delta and volume footprint techniques that I use below to determine very accurate demand regions, you can send me a private message. I help anyone who wants it completely free of charge.
🔑I have a long list of my proven technique below:
🎯 ZENUSDT.P: Patience & Profitability | %230 Reaction from the Sniper Entry
🐶 DOGEUSDT.P: Next Move
🎨 RENDERUSDT.P: Opportunity of the Month
💎 ETHUSDT.P: Where to Retrace
🟢 BNBUSDT.P: Potential Surge
📊 BTC Dominance: Reaction Zone
🌊 WAVESUSDT.P: Demand Zone Potential
🟣 UNIUSDT.P: Long-Term Trade
🔵 XRPUSDT.P: Entry Zones
🔗 LINKUSDT.P: Follow The River
📈 BTCUSDT.P: Two Key Demand Zones
🟩 POLUSDT: Bullish Momentum
🌟 PENDLEUSDT.P: Where Opportunity Meets Precision
🔥 BTCUSDT.P: Liquidation of Highly Leveraged Longs
🌊 SOLUSDT.P: SOL's Dip - Your Opportunity
🐸 1000PEPEUSDT.P: Prime Bounce Zone Unlocked
🚀 ETHUSDT.P: Set to Explode - Don't Miss This Game Changer
🤖 IQUSDT: Smart Plan
⚡️ PONDUSDT: A Trade Not Taken Is Better Than a Losing One
💼 STMXUSDT: 2 Buying Areas
🐢 TURBOUSDT: Buy Zones and Buyer Presence
🌍 ICPUSDT.P: Massive Upside Potential | Check the Trade Update For Seeing Results
🟠 IDEXUSDT: Spot Buy Area | %26 Profit if You Trade with MSB
📌 USUALUSDT: Buyers Are Active + %70 Profit in Total
🌟 FORTHUSDT: Sniper Entry +%26 Reaction
🐳 QKCUSDT: Sniper Entry +%57 Reaction
📊 BTC.D: Retest of Key Area Highly Likely
📊 XNOUSDT %80 Reaction with a Simple Blue Box!
📊 BELUSDT Amazing %120 Reaction!
📊 Simple Red Box, Extraordinary Results
I stopped adding to the list because it's kinda tiring to add 5-10 charts in every move but you can check my profile and see that it goes on..

#ONE/USDT#ONE
The price is moving within a descending channel on the 1-hour frame and is expected to continue lower.
We have a trend to stabilize below the 100 moving average once again.
We have a downtrend on the RSI indicator, supporting the upward move with a breakout.
We have a resistance area at the upper limit of the channel at 0.01142.
Entry price: 0.01120
First target: 0.01091
Second target: 0.01057
Third target: 0.01006

ONEUSDT 1WONE ~ 1W Analysis
#ONE Buy back from here if you still have a Conviction on this coin with a short -term target of at least 20%+.

#ONE/USDT#ONE
The price is moving in a descending channel on the 1-hour frame and is adhering to it well and is heading to break it strongly upwards and retest it
We have a bounce from the lower limit of the descending channel, this support is at a price of 0.01300
We have a downtrend on the RSI indicator that is about to break and retest, which supports the rise
We have a trend to stabilize above the moving average 100
Entry price 0.01490
First target 0.01565
Second target 0.01641
Third target 0.01730

ONEUSDT 1WONE ~ 1W Analysis
#ONE This support block continues to be maintained so far. Buy from here with a minimum target of 20%+
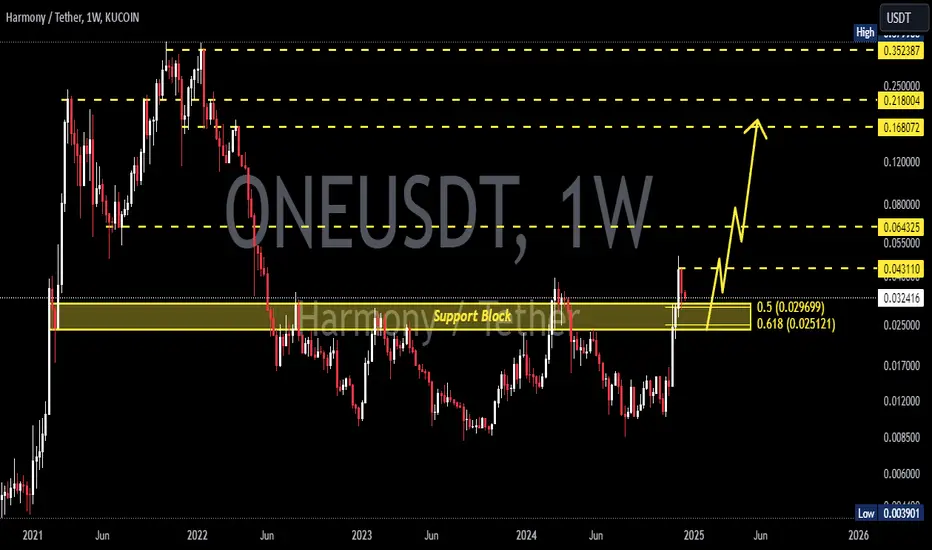
ONE 900% potential BINANCE:ONEUSDT
Possible Targets and explanation idea
➡️Would like to see drop to 0.5 of M FVG
➡️After retest of FVG we can see uptrend to First M Bullish FVG around 900%
➡️On Monthly timeframe ADZ indicator in biggest accumulation stage ever
Hope you enjoyed the content I created, You can support with your likes and comments this idea so more people can watch!
✅Disclaimer: Please be aware of the risks involved in trading. This idea was made for educational purposes only not for financial Investment Purposes.
---
• Look at my ideas about interesting altcoins in the related section down below ↓
• For more ideas please hit "Like" and "Follow"!

#ONE/USDT Ready to go higher#ONE
The price is moving in a descending channel on the 1-hour frame and sticking to it well
We have a bounce from the lower limit of the descending channel, this support is at 0.02100
We have a downtrend on the RSI indicator that is about to break, which supports the rise
We have a trend to stabilize above the moving average 100
Entry price 0.02130
First target 0.02200
Second target 0.02250
Third target 0.02350

10x on Harmony!Harmony is keep making higher high's in 1W timeframe, so that means in longer run chart is still bullish and we have to look for entries. What BINANCE:ONEUSDT doing is hanging above minor support which is a good sign, but what I would like to see is breaking this support and close a candle below it. That is the perfect position to enter Long-position.
ONEUSDT: Eyeing Weekly VWAP for Optimal Entry! ONEUSDT: Eyeing Weekly VWAP for Optimal Entry! 🌟📊
Key Points:
Price Check: ONEUSDT’s current price aligns well for a potential buy setup.
Weekly VWAP Opportunity: Aiming to catch an entry below the weekly VWAP for added confirmation and risk management. I would take half the risk I normally take.
Why This Setup?
Strategically buying below the weekly VWAP combines market sentiment and technical advantage. With indicators like CDV, liquidity heatmaps, volume profiles, and volume footprints, these demand zones offer high-value entry points.
Pro Tip: Confirm with low time frame market structure breaks and volume footprint support to maximize confidence in your trade.
If you find this analysis helpful, please boost, comment, and follow. Let’s make trading smarter, together!
Let me tell you, folks, this is amazing. Nobody does analysis like I do. Believe me. If this helps you, don't forget to boost and comment! It’s a big deal, motivates me to share even more winning insights with you. Tremendous insights.
I keep my charts the best, clean, simple, and clear. You know it, I know it, clarity leads to better decisions. No question about it. My approach? Built on years of tremendous experience. Incredible track record. I don’t claim to know it all, but I spot high-probability setups like nobody else. Trust me.
Want to learn how to use the heatmap, cumulative volume delta, and volume footprint techniques I use to determine demand regions with stunning accuracy? Send me a private message—totally free, folks. That’s right. I help anyone who wants it, absolutely no charge. Unbelievable value.
Here’s the list, long list, great list, of some of my previous incredible analyses. Each one, a winner:
🎯 ZENUSDT.P: Patience & Profitability | %230 Reaction from the Sniper Entry
🐶 DOGEUSDT.P: Next Move
🎨 RENDERUSDT.P: Opportunity of the Month
💎 ETHUSDT.P: Where to Retrace
🟢 BNBUSDT.P: Potential Surge
📊 BTC Dominance: Reaction Zone
🌊 WAVESUSDT.P: Demand Zone Potential
🟣 UNIUSDT.P: Long-Term Trade
🔵 XRPUSDT.P: Entry Zones
🔗 LINKUSDT.P: Follow The River
📈 BTCUSDT.P: Two Key Demand Zones
🟩 POLUSDT: Bullish Momentum
🌟 PENDLEUSDT.P: Where Opportunity Meets Precision
🔥 BTCUSDT.P: Liquidation of Highly Leveraged Longs
🌊 SOLUSDT.P: SOL's Dip - Your Opportunity
🐸 1000PEPEUSDT.P: Prime Bounce Zone Unlocked
🚀 ETHUSDT.P: Set to Explode - Don't Miss This Game Changer
🤖 IQUSDT: Smart Plan
⚡️ PONDUSDT: A Trade Not Taken Is Better Than a Losing One
💼 STMXUSDT: 2 Buying Areas
🐢 TURBOUSDT: Buy Zones and Buyer Presence
🌍 ICPUSDT.P: Massive Upside Potential | Check the Trade Update For Seeing Results
🟠 IDEXUSDT: Spot Buy Area | %26 Profit if You Trade with MSB
📌 USUALUSDT: Buyers Are Active + %70 Profit in Total
🌟 FORTHUSDT: Sniper Entry +%26 Reaction
🐳 QKCUSDT: Sniper Entry +%57 Reaction
📊 BTC.D: Retest of Key Area Highly Likely
And that’s just the start. The list goes on and on, folks. It’s a tremendous list, the best. I stopped adding because, frankly, it’s tiring. So many wins. People are amazed. You can check my profile and see for yourself, winning moves, all the time. Believe me, nobody does it better.

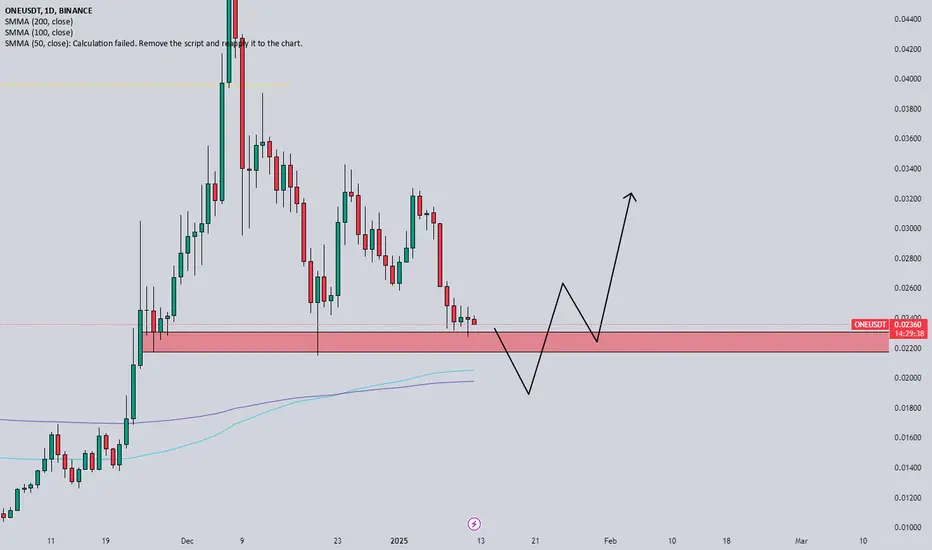
ONEUSDT Analysis: Strategic Demand ZonesONEUSDT presents high-potential demand zones , highlighted by the blue boxes . I’ve intentionally placed these zones lower , considering the market's potential to reach these levels around the Christmas period . This approach provides an opportunity for well-positioned entries if market conditions align.
Key Points:
Strategic Positioning: Blue boxes set intentionally lower for better entries in expected market dips.
Market Timing: Potential price action around Christmas aligns with these zones.
Confirmation Indicators: I will use CDV, liquidity heatmaps, volume profiles, volume footprints, and upward market structure breaks on lower time frames for validation.
Learn With Me: If you want to master how to use CDV, liquidity heatmaps, volume profiles, and volume footprints to identify precise demand zones, just DM me. I’d be happy to guide you!
Reminder: Be aware of the market's current state and approach it with caution. Successful trading relies on meaningful levels and robust confirmations.
If you think this analysis helps you, please don't forget to boost and comment on this. These motivate me to share more insights with you! Wishing everyone success in their trades.
If you think this analysis helps you, please don't forget to boost and comment on this. These motivate me to share more insights with you!
I keep my charts clean and simple because I believe clarity leads to better decisions.
My approach is built on years of experience and a solid track record. I don’t claim to know it all, but I’m confident in my ability to spot high-probability setups.
If you would like to learn how to use the heatmap, cumulative volume delta and volume footprint techniques that I use below to determine very accurate demand regions, you can send me a private message. I help anyone who wants it completely free of charge.
My Previous Analysis
🐶 DOGEUSDT.P: Next Move
🎨 RENDERUSDT.P: Opportunity of the Month
💎 ETHUSDT.P: Where to Retrace
🟢 BNBUSDT.P: Potential Surge
📊 BTC Dominance: Reaction Zone
🌊 WAVESUSDT.P: Demand Zone Potential
🟣 UNIUSDT.P: Long-Term Trade
🔵 XRPUSDT.P: Entry Zones
🔗 LINKUSDT.P: Follow The River
📈 BTCUSDT.P: Two Key Demand Zones
🟩 POLUSDT: Bullish Momentum
🌟 PENDLEUSDT.P: Where Opportunity Meets Precision
🔥 BTCUSDT.P: Liquidation of Highly Leveraged Longs
🌊 SOLUSDT.P: SOL's Dip - Your Opportunity
🐸 1000PEPEUSDT.P: Prime Bounce Zone Unlocked
🚀 ETHUSDT.P: Set to Explode - Don't Miss This Game Changer
🤖 IQUSDT: Smart Plan
⚡️ PONDUSDT: A Trade Not Taken Is Better Than a Losing One
💼 STMXUSDT: 2 Buying Areas
🐢 TURBOUSDT: Buy Zones and Buyer Presence
🌍 ICPUSDT.P: Massive Upside Potential | Check the Trade Update For Seeing Results
🟠 IDEXUSDT: Spot Buy Area | %26 Profit if You Trade with MSB
📌 USUALUSDT: Buyers Are Active + %70 Profit in Total
🌟 FORTHUSDT: Sniper Entry +%26 Reaction
🐳 QKCUSDT: Sniper Entry +%57 Reaction
I stopped adding to the list because it's kinda tiring to add 5-10 charts in every move but you can check my profile and see that it goes on..

#ONE/USDT#ONE
The price is moving in a descending channel on the 4-hour frame and is expected to continue upwards
We have a trend to stabilize above the moving average 100 again
We have a descending trend on the RSI indicator that supports the rise by breaking it upwards
We have a support area at the lower limit of the channel at a price of 0.02226
Entry price 0.02512
First target 0.02973
Second target 0.03367
Third target 0.3865

ONEUSDT 1WONE Update ~ 1W
#ONE If you still have Conviction on this coin,. This support block is a very good place to start buying gradually, with a target of at least 20%++
ONEUSDT Delivers a Whopping 1,500% Gain and Still Running!ONEUSDT on the 1-Day timeframe has delivered an explosive long trade setup, exceeding all profit targets. The trade has achieved an extraordinary 1,500% profit so far and continues to show strength for further upside momentum.
Key Levels:
TP1: 0.01510 ✅
TP2: 0.01804 ✅
TP3: 0.02099 ✅
TP4: 0.02280 ✅
Technical Analysis:
The trade was perfectly caught using the Risological Swing Trading Indicator , which provided a clear entry at 0.01328 and an SL at 0.01181 for disciplined risk management.
Price action shows a strong uptrend, with consistent support from the Risological Trend Line, pushing ONEUSDT beyond all set targets. Profit-taking at higher levels remains ideal while monitoring for further gains.
