Bitcoin - Downtrend will continue to 109,000! Alt-season OctoberBitcoin and altcoins have been crashing in the past 2 weeks! Is there any hope for a bull market, or has the bullish cycle ended? In this analysis I will tell you my personal opinion, and if you haven't seen my previous very successful analysis on Bitcoin, you can do it right now! Because it's highly informative, and it can open your closed eyes.
In short, Bitcoin just recently hit the long-term trendline from 2017 - 2021 - 2025, and yes, the market reacted to this trendline and dropped as expected. Because this is a major trendline, we have to expect a strong reaction. I still think the market needs to go lower in the short term because there is an unfilled FVG at 109k, so closing this gap would be appreciated. This GAP is also a strong support because it's in a confluence with this blue parallel channel, and the upward-sloping trendline definitely acts as a support. In the short term we should see a bounce from this trendline.
You probably saw that Ethereum massively pumped, and some specific altcoins as well. We saw a short-term alt season, there is no doubt about it, but will this altcoin season continue or not? Currently I do not see a bottom on altcoins, so BTC.D should go up in the short-term and mid-term, but in October/November/December I think that would be a very good time to buy some altcoins for the upcoming alt season!
Write a comment with your altcoin + hit the like button, and I will make an analysis for you in response. Trading is not hard if you have a good coach! This is not a trade setup, as there is no stop-loss or profit target. I share my trades privately. Thank you, and I wish you successful trades!
Community ideas

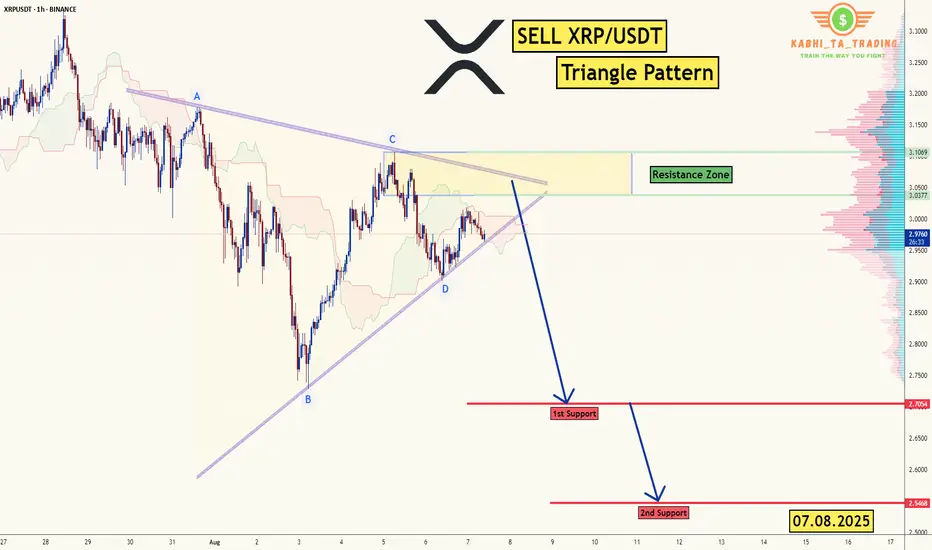
XRP/USDT -H1 - Triangle Breakout (07.08.2025)The XRP/USDT Pair on the H1 timeframe presents a Potential Selling Opportunity due to a recent Formation of a Triangle Breakout Pattern. This suggests a shift in momentum towards the downside in the coming Days.
Possible Short Trade:
Entry: Consider Entering A Short Position around Trendline Of The Pattern.
Target Levels:
1st Support – 2.7054
2nd Support – 2.5468
🎁 Please hit the like button and
🎁 Leave a comment to support for My Post !
Your likes and comments are incredibly motivating and will encourage me to share more analysis with you.
Best Regards, KABHI_TA_TRADING
Thank you.
EURUSD I Daily CLS I Model 2 I Targets Full CLS rangeYo Market Warriors ⚔️
Fresh outlook drop — if you’ve been riding with me, you already know:
🎯My system is 100% mechanical. No emotions. No trend lines. No subjective guessing. Just precision, structure, and sniper entries.
🧠 What’s CLS?
It’s the real smart money. The invisible hand behind $7T/day — banks, algos, central players.
📍Model 1:
HTF bias based on the daily and weekly candles closes,
Wait for CLS candle to be created and manipulated. Switch to correct LTF and spot CIOD. Enter and target 50% of the CLS candle.
For high probability include Dealing Ranges, Weekly Profiles and CLS Timing.
Analysis done on the Tradenation Charts
Disclosure: I am part of Trade Nation's Influencer program and receive a monthly fee for using their TradingView charts in my analysis.
Trading is like a sport. If you consistently practice you can learn it.
“Adapt what is useful. Reject whats useless and add whats is specifically yours.”
David Perk aka Dave FX Hunter
💬 Don't hesitate to ask any questions or share your opinions

GOLD → A stalemate situation - a bullish wedgeFX:XAUUSD is unable to break through the resistance level of 3400. However, an ambiguous “bullish wedge” pattern is forming on the chart...
The price of gold retreated from a two-week high on profit-taking. The correction intensified after the US imposed tariffs on imports of gold bars (1 kg), which could disrupt supplies from Switzerland and London.
Key supporting factors: Escalation of trade conflicts, concerns about the US economy and pressure on the Fed, questions about the Fed's independence after Trump's appointments
Risks: Short-term volatility ahead of US CPI data next week. However, fundamental drivers remain bullish.
Support levels: 3390, 3350
Resistance levels: 3405, 3435
The problem with the bullish wedge pattern is that it forms an ambiguous figure. We have an upward movement, but the pattern could easily reverse the local upward trend due to the fairly difficult resistance zone of 3390-3410.
If gold manages to consolidate above 3405, this will increase the chances of growth to 3435-3500.
BUT! There is a fairly high chance that the 3390 support level could be broken. In this case, the market could fall to 3350 before rising...
Best regards, R. Linda!

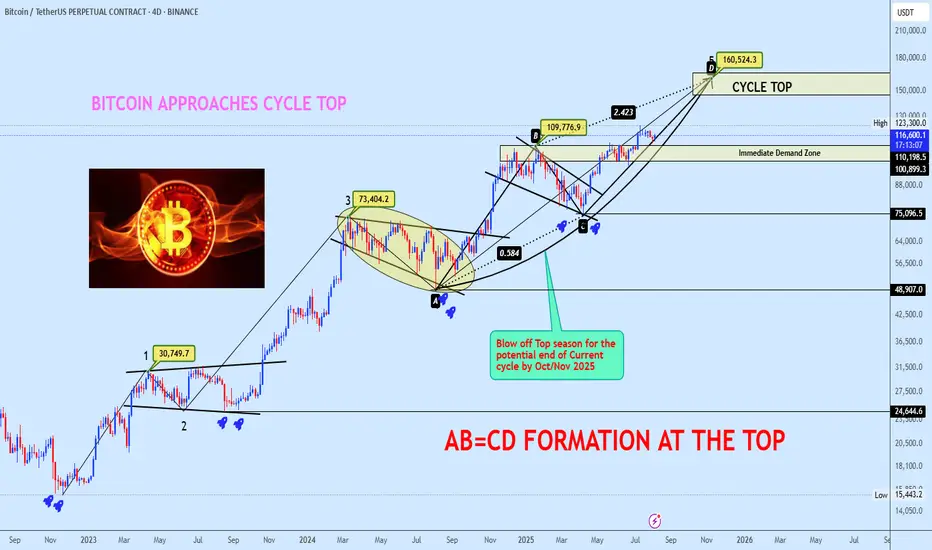
Bitcoin Approaches Cycle Top with AB=CD Completion in SightBTCUSDT continues its bullish macro structure, now advancing towards the projected cycle top zone at $160,524, completing a textbook AB=CD harmonic formation. The BC leg retraced precisely 0.584 of AB, aligning with a 2.423 CD extension, confirming a strong harmonic symmetry.
Price is currently trading around $116,569 after breaking through key resistance levels, with the Immediate Demand Zone resting at $110,198. This zone will act as the first major defense level if a short-term correction occurs.
Market structure suggests a potential blow-off top formation into October/November 2025, marking the probable end of the current cycle. Do check out our Bitcoin lifecycle thread for clarity on the reason for picking cycle top.
POTENTIAL BITCOIN LIFECYCLE
Deciphering Bitcoin's Cyclical Trends & Phases
Momentum remains firmly bullish, with the upward curve indicating buyers remain in control until exhaustion patterns emerge near the cycle projection zone.
Plan: Hold long positions into strength, scale out as BTC approaches the $160K cycle top zone, and prepare for a potential macro reversal as the cycle matures. Monitor lower timeframes for divergence signals as we approach the final leg.
If this structure aligns with your outlook, feel free to share your thoughts in the comments.
You’re also welcome to drop your preferred altcoins for a quick technical review.
GBPUSD: Back to Bullish Trend?!GBPUSD pair is showing signs of recovery after a prolonged bearish trend.
A confirmed bullish breakout from a significant daily resistance level indicates strong buying pressure.
I anticipate that the market will continue to rise and approach the 1.3515 level shortly.

EURUSDHello Traders! 👋
What are your thoughts on EURUSD?
EUR/USD is trading below a key resistance area and has recently completed a pullback to the broken trendline.
As long as the pair remains under this resistance, we expect some short-term consolidation, followed by a renewed bearish move toward lower levels.
The bearish outlook remains valid while price stays below the resistance zone.
A clean break above this level would invalidate the bearish scenario.
Will EUR/USD resume its decline, or break through resistance? Share your view below! 👇
Don’t forget to like and share your thoughts in the comments! ❤️

XAU/USD (Gold) Triangle Breakout (07.08.2025)The XAU/USD pair on the M30 timeframe presents a Potential Buying Opportunity due to a recent Formation of a Triangle Breakout Pattern. This suggests a shift in momentum towards the upside and a higher likelihood of further advances in the coming hours.
Possible Long Trade:
Entry: Consider Entering A Long Position around Trendline Of The Pattern.
Target Levels:
1st Resistance – 3407
2nd Resistance – 3420
🎁 Please hit the like button and
🎁 Leave a comment to support for My Post !
Your likes and comments are incredibly motivating and will encourage me to share more analysis with you.
Best Regards, KABHI_TA_TRADING
Thank you.
Disclosure: I am part of Trade Nation's Influencer program and receive a monthly fee for using their TradingView charts in my analysis.

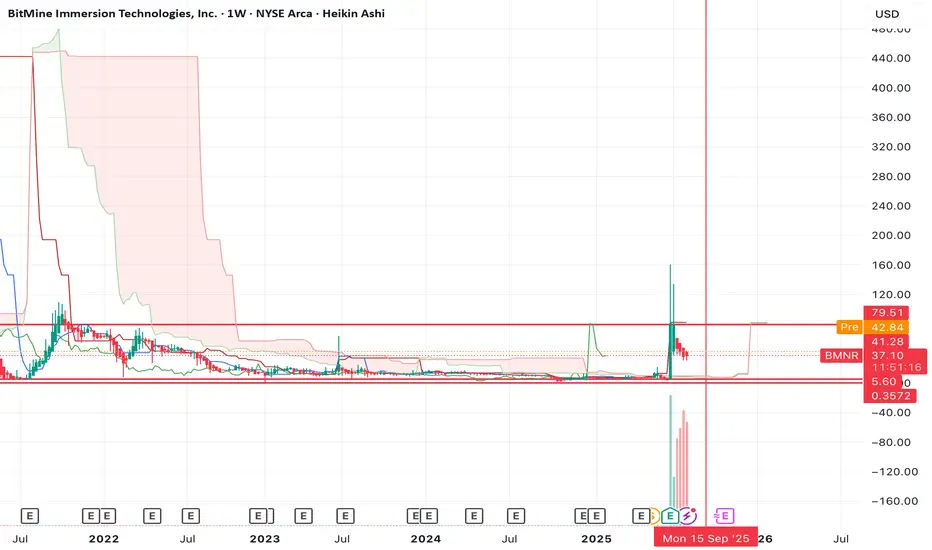
ETH is not having its "2017" moment, neither is BMNRDespite Tom Lee calling for ETH to $18k (which I happen to agree on btw), I think his timing is completely off. He's thinking that ETH is bullish here and that we're going to go to new highs this year.
I think the opposite. I think the top is already in for the year and that we're going to head to new lows first before we make our way to new highs.
BMNR doesn't look good either. The chart is bearish on the 3W and 1M timeframe with a bearish divergence on the RSI.
I think it's more likely that BMNR retests the lows before it sees any large pump.
Let's see how the chart plays out over the coming weeks/months.
Lingrid | GOLD Short-Term Correction From Psychological LevelOANDA:XAUUSD is currently retesting the broken triangle structure from below, having rebounded from the ascending support zone. The price is approaching a confluence near 3,400–3410, where prior breakdown and resistance meet. If this level holds as resistance, the setup favors a bearish continuation toward 3,340 and possibly deeper. The broader structure shows lower highs and increasing rejection pressure below the resistance zone.
📉 Key Levels
Sell trigger: 3,400 rejection
Sell zone: 3,398.660–3,410
Target: 3,340
Invalidation: Break and hold above 3,410
💡 Risks
Momentum from recent rebound could challenge resistance
A higher low formation could tilt sentiment bullish
External factors (Fed, inflation data) may inject volatility beyond the range
If this idea resonates with you or you have your own opinion, traders, hit the comments. I’m excited to read your thoughts!

DOGEUSDT to the moon(1$ is not Far)Wow such a good chart we have here the channel breakout and also retest of breakout is completed and i am thinking about easy path non stop pump here to the moon for CRYPTOCAP:DOGE holders now.
price test 0.61 Fibonacci support level and the market here was healthy and all leverage players are mostly kicked now and we are ready to go to at least 0.32$ for next month and then more pump and rise to final targets.
DISCLAIMER: ((trade based on your own decision))
<<press like👍 if you enjoy💚

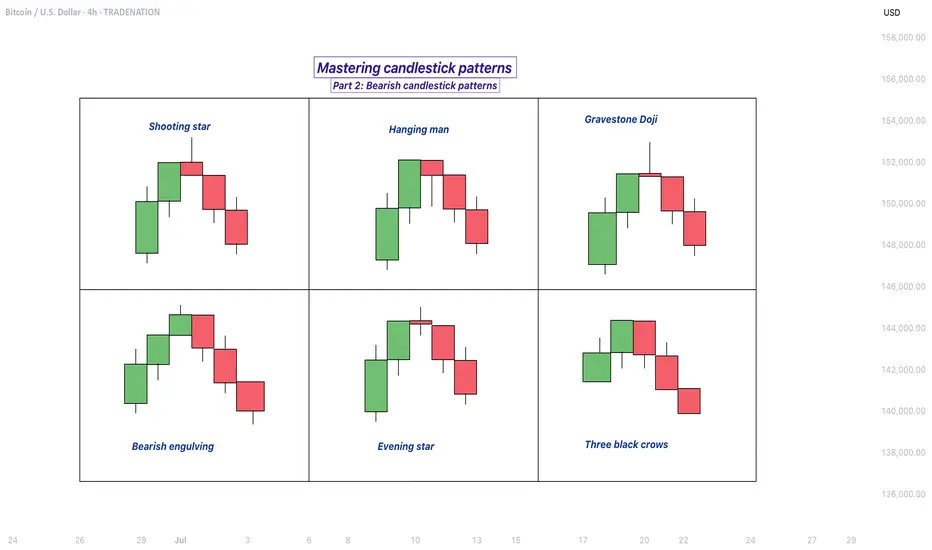
Mastering bearish candlestick patterns - How to use it!Bearish candlestick patterns are a cornerstone of technical analysis, relied upon by traders across financial markets to assess the likelihood of price reversals or continued downward trends. At their core, these patterns are visual representations of shifts in market sentiment, formed by the open, high, low, and close prices over one or several trading sessions. When recognized accurately and interpreted in context, bearish candlestick setups can alert market participants to the fading strength of buyers and the increasing presence of sellers, which often precedes downward price movements. Expanding on this, a comprehensive understanding of each pattern’s nuances, psychological underpinnings, and optimal trading applications can significantly enhance a trader’s analytical toolkit.
What will be discussed?
- What is a shooting star?
- What is a hanging man?
- What is a gravestone dojo?
- What is an evening star?
- What are the three black crows?
- How to trade the bearish candlestick patterns?
Shooting star
The shooting star pattern stands as a prominent candlestick configuration foreshadowing potential bearish reversals after an uptrend. This single-candle pattern is distinguished by a small real body situated near the lower end of the price range, a long upper shadow that is at least twice the length of the body, and little to no lower shadow. The psychological narrative implied by the shooting star is compelling: buyers initially control the session, pushing prices sharply higher, but by the close, sellers have overwhelmed this optimism, pulling the price back down to near or below the opening point. This abrupt shift in control suggests that the bullish momentum is waning, priming the market for a price correction or reversal.
Hanging man
The hanging man, while visually similar to the hammer pattern of bullish reversals, is distinctly bearish because of its position at the top of an established uptrend. This single-candle pattern features a small body at the upper part of the trading range and a markedly long lower shadow, again with minimal or absent upper shadow. During the session, substantial selling pressure drives prices down, accounting for the extended lower shadow, yet buyers temporarily regain some control, recovering much of the loss by the close. Despite this late-session recovery, the appearance of the hanging man warns traders that sellers are growing more aggressive – especially if the next candle confirms the weakness with a lower close.
Gravestone doji
A classic and somewhat ominous formation, the gravestone doji is a specialized form of doji candlestick that carries even greater weight when it appears after a rising market. Here, the open, close, and low are all clustered near the session’s low, forming a long upper shadow with no lower shadow. This structure vividly illustrates a dramatic shift in sentiment: buyers propel prices higher during the session, only to be met by intense selling which pushes prices back to the opening level by the close. This failed rally, marked by the upper wick, reflects the exhaustion of buying interest and the potential onset of bearish dominance.
Bearish engulfing
Turning to multi-candle setups, the bearish engulfing pattern is a powerful, two-bar reversal pattern. The initial candle is bullish and typically a continuation of the prevailing uptrend, but the second candle is bearish and must open above and close below the body of the first candle, “engulfing” it completely. The transition from a relatively small upward move to a much larger downward move highlights a rapid escalation in sell-side enthusiasm. Importantly, the larger the second candle and the greater the volume accompanying it, the more reliable the signal.
Evening star
The evening star expands the analysis further into a three-candlestick formation, representing a storyline of shifting market dynamics. The pattern commences with a long bullish candle, followed by an indecisive small candle (the star) that gaps above the previous close, and concludes with a large bearish candle that closes deep into the first candle’s body. The evening star is especially meaningful because it narrates a transition from bullish exhaustion to bearish control over three sessions, making it a robust signal of a pending trend reversal. The reliability of the evening star increases if the bearish candle is accompanied by high volume, confirming a surge in selling pressure.
Three black crows
Among the most striking bearish signals is the three black crows pattern. It comprises three consecutive large bearish candles, each opening within the body of the previous candle and closing successively lower. This pattern demonstrates relentless selling over several sessions, erasing prior gains and indicating that bearish sentiment is in full swing. Collectively, the three black crows can shift market psychology significantly when they appear after a lengthy uptrend, especially if accompanied by increased trading volume.
How to trade the bearish candlestick patterns?
Effectively using bearish candlestick patterns in a trading strategy requires more than mere recognition of shapes. The context in which these patterns emerge matters greatly; traders should analyze preceding price action, the scope of the trend, and any converging signals from other technical tools such as momentum oscillators or volume indicators. Confirmation is a best practice, waiting for a subsequent session that continues in the bearish direction can filter out false signals and decrease the chances of whipsaw trades.
In practice, traders may use these patterns to identify short-selling opportunities, define entry and exit points, or adjust stop-loss levels to protect profits as a trend appears to reverse. Risk management is crucial, as no pattern is infallible. Position sizing, stop-loss placement, and ongoing evaluation of the broader market environment all contribute to the prudent use of candlestick analysis. By integrating these patterns into a comprehensive market analysis framework, traders are better positioned to interpret crowd psychology, anticipate significant reversals, and navigate the complexities of price movement with a higher degree of confidence and skill.
-------------------------
Disclosure: I am part of Trade Nation's Influencer program and receive a monthly fee for using their TradingView charts in my analysis.
Thanks for your support. If you enjoyed this analysis, make sure to follow me so you don't miss the next one. And if you found it helpful, feel free to drop a like 👍 and leave a comment 💬, I’d love to hear your thoughts!
When Profit Comes, Leave Before It Vanishes Again. how??!!Have you ever stayed in a winning trade just to get more?
That voice whispering “keep it longer, this might be the big one”?
It’s the same voice that’s emptied thousands of portfolios...
Hello✌️
Spend 2 minutes ⏰ reading this educational material.
🎯 Analytical Insight on Solana:
BINANCE:SOLUSDT has seen healthy volume recently and is testing key daily support along with an important trendline. Holding these zones could fuel a 15%+ rally toward the $199 mark 📊🚀
Now, let's dive into the educational section,
🧠 The Psychology of Greed: Profit’s Evil Twin 😈
When you enter a trade and it starts moving in your favor, your subconscious kicks in. Suddenly, your brain whispers: “Just a little more... hold it!”
That’s when the greed game begins.
No matter how well you planned before the trade, once you're in profit, your brain creates a fantasy. A future where profits double, triple... a dream world. And this dream is exactly what makes traders give back everything including their original capital.
Our minds are wired to crave the rush of winning again. It’s like a hit of dopamine. So you hold the position even when the chart is flashing reversal signs. That’s the setup for disaster...
📉 Take-Profit Levels: Why Getting Out Is the Real Win 📌
Here’s the cold truth
If you don’t exit when you planned to, that profit was never really yours
A take-profit isn’t just a number. It’s a psychological boundary that separates a disciplined trader from an emotional one. Many beginners think setting a TP means giving up potential gains but in reality, it means respecting your plan and your capital.
You’ll always have another chance to trade. Always
But if greed wipes out your funds, there’s nothing left for the next opportunity
Each trade is just a chapter, not your whole story.
🧪 The Social Media Trap: When Your Brain Stops Thinking 📱
Online hype is poison. From “X coin just did 100x” to “I made $50K in a weekend” your brain gets hijacked.
You start chasing fantasies, not trades
That illusion of overnight success makes you ignore your own strategy. You stop following your plan and start trying to copy people who probably aren’t even real.
This is how social media slowly pushes traders into ruin
You feel left behind and that fear pushes you into greedy irrational decisions.
🔧 TradingView Tools That Help You Beat Greed 🛠
Luckily, TradingView offers several tools that can help keep your greed in check and your head clear
Alerts
Set an alert at your take-profit zone so you don’t keep staring at the chart. Let the system notify you when it’s time.
Long/Short Position Tool
Use this to visually define your entry, TP, and SL. Seeing it on the chart makes it easier to stick to your plan.
Bar Replay
This is gold for practice. Rewind price action and practice exits. See how often greed would’ve destroyed your trades.
Notes
Add reminders to your charts. Write things like “Exit at 2500 don’t overstay.” When future-you sees that message, it helps stay on track.
These tools don’t just improve your trades. They show discipline. And that’s exactly the kind of analysis editors look for when picking Editor’s Choice posts.
🚪 Final Words: In and Out, That’s the Game 🎯
Taking profit is a skill but exiting on time is an art
If you learn to respect your plan and silence greed, you’ll protect your capital and your sanity
There’s always a next trade if you survive this one
✨ Need a little love!
We pour love into every post your support keeps us inspired! 💛 Don’t be shy, we’d love to hear from you on comments. Big thanks , Mad Whale 🐋
📜Please make sure to do your own research before investing, and review the disclaimer provided at the end of each post.

ADAUSDT - buy it before it's too late!If you’re looking for safe trading with solid guaranteed profits, then your main focus should be on major coins — and when we talk major coins, ADA should definitely be on your radar.
ADA just completed a Falling Wedge breakout on the 3-day timeframe, followed by a successful retest.
It also broke and retested the 0.618 Fibonacci level — what more confirmation do you need to buy?
Your next target from here?
At least +100% gain.
Best regards:
Ceciliones🎯

08.08.25 Morning ForecastPairs on Watch -
FX:GBPJPY
FX:EURNZD
FX:GBPAUD
A short overview of the instruments I am looking at for today, multi-timeframe analysis down to what I will be looking at for an entry. Enjoy!

Ready to BUY Gold to target 3445✏️ OANDA:XAUUSD confirms a continued uptrend as it breaks out of the triangle. The price is heading towards 3430 today and even higher at 3445. Today is Friday, the weekly candle close, and according to the range of the candle, it is possible to reach those highs. The BUY strategy can be activated at the moment and hold the position until the US session with the continuous US session buying pressure in recent days.
📉 Key Levels
Support: 3385-3365-3333
Resistance: 3419-3431-3445
Buy trigger: Confirmation of the h4 candle buying pressure above 3385
Buy trigger: Rejection of the support zone at 3365
Target 3445
Leave your comments on the idea. I am happy to read your views.

Lingrid | EURJPY Trendline Breakout. Long From SupportThe price perfectly fulfilled my previous idea . FX:EURJPY is consolidating inside a tight range between 171.411 support and the downward trendline after rebounding from a higher low. Price is testing the upper boundary of this range, and a breakout could signal continuation toward the 172.800 resistance zone. Holding above 171.411 keeps the bullish bias intact, while rejection from the trendline could bring another retest of support. Momentum favors buyers if the breakout comes with strong volume.
📉 Key Levels
Buy trigger: Break and hold above 171.775
Buy zone: 171.411–171.775
Target: 172.800
Invalidation: Drop below 171.411
💡 Risks
Failure to break the downward trendline could spark a deeper pullback
Rejection at 172.800 could trigger range-bound movement
Weak euro sentiment from macroeconomic data may weigh on upside potential
If this idea resonates with you or you have your own opinion, traders, hit the comments. I’m excited to read your thoughts!

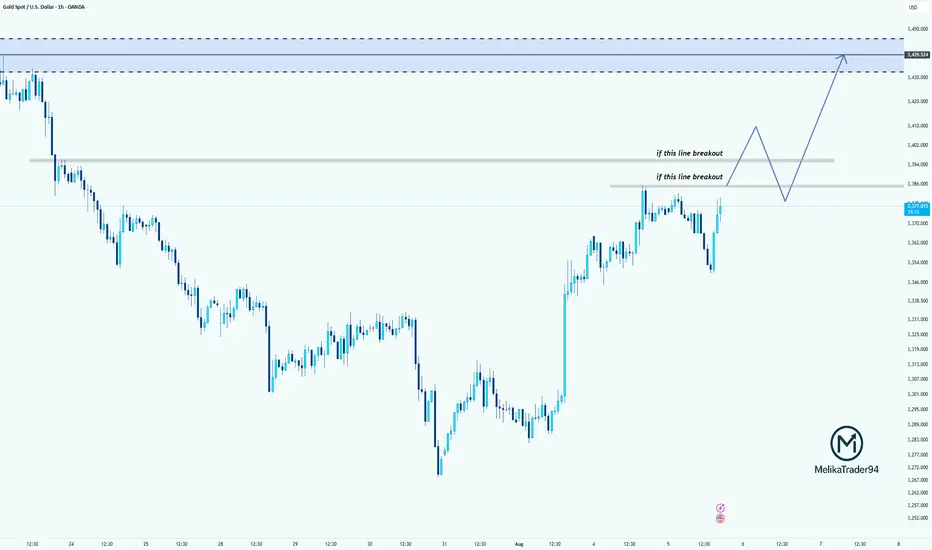
Breakout Levels in Focus for XAUUSDWhy did I say to cancel the last position? because gold is in the critical area!
Price is testing a key resistance area around 3374.
If it breaks above the first resistance level, we may see a bullish continuation toward the second breakout line.
If both levels are broken and retested successfully, the path toward the supply zone at 3430–3440 opens up.
Patience and confirmation are key here!
GBPCAD: Could we see price continue to the downside?Price on GBPCAD looks quite interesting at the moment, this latest moves continues the narrative of a downtrend.
As it is following a downtrend, each touch has served as a catalyst for a directional move. The most recent interaction is particularly interesting, because it's hovering here for some time now, and this could be a clue that we can use.
What may follow is subtle but telling: compression at trendline, low-volume candles suggesting exhaustion, all aligning for more potential release downward.
My target would be toward 1.8100 where we have a clear support zone. Momentum has respected structure and if this move plays out, I don't think it will be a breakout, but a continuation of a narrative that’s already been happening. This is what makes the setup so compelling. It’s not new, it’s the a "story being told".
Though a scenario for more upside is possible and can happen just as much. Still, I would take the side for more downside taken into account all above.

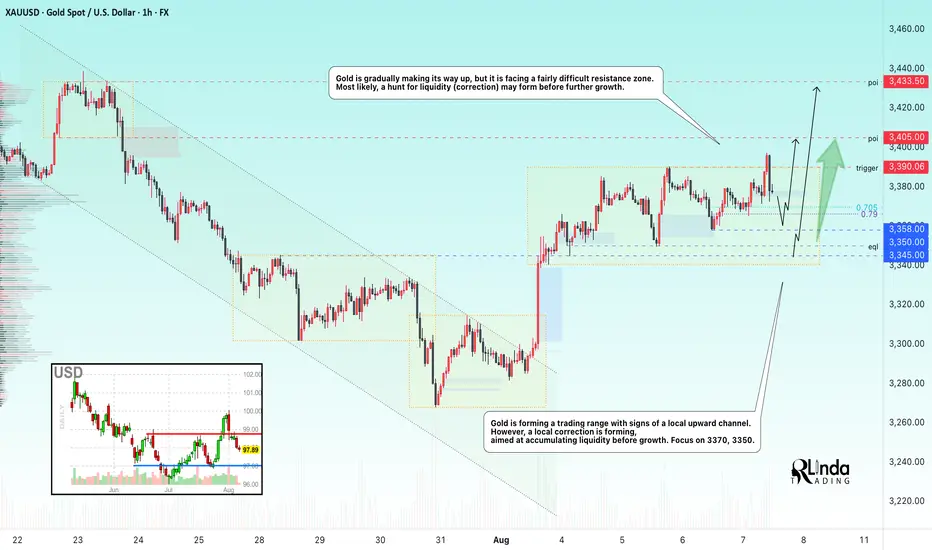
GOLD → Correction before a breakout and rallyFX:XAUUSD is gradually making its way upward, but it faces a fairly difficult resistance zone. Most likely, a long squeeze may form before further growth.
Gold is rising amid uncertainty: Expectations of key US labor market data (unemployment claims, labor costs), the possibility of a Fed rate cut in September after weak employment and services data, new trade threats (possible 15% tariffs on Japanese imports and restrictions on Russian oil supplies to China)
Key risks:
Trump's decision on Fed appointments (replacement of Kugler and Powell) and further escalation of trade conflicts could increase volatility. For now, dovish expectations and demand for safe-haven assets are supporting gold.
Technically, the focus is on the local range of 3390-3335 (3350). A false break of support could trigger growth...
Resistance levels: 3390, 3405, 3433
Support levels: 3365, 3358, 3350
The fall of the dollar is supporting the already bullish gold... However, before continuing its growth, the price is forming a correction, and a false breakout of support and liquidity capture could have a positive effect on the market for further upward movement...
Best regards, R. Linda!
Gold Futures Hit $3,534 – Spot Lags by $100. What Could Mean?I don’t usually track Gold Futures every single day, but today a fellow trader drew my attention to something — and it’s impossible to ignore.
Gold Futures just printed an all-time high at $3,534, while spot gold (XAUUSD) topped at $3,409 — a $120 spread at the peak, now narrowed to about $100 at the time of writing.
A spread like this is highly unusual and, more importantly, unsustainable. By the time the August 27th contract expires, futures and spot must converge to the same price.
That means one of two things is about to happen — and either way, the move would be explosive.
1. Bullish Scenario – Futures Are Right
If the futures market is telling the truth, spot gold will have to accelerate higher to close the $100 gap.
If XAUUSD stabilize above $3,400, the odds of a push toward its own ATH become significant — and the move could be fast and aggressive.
________________________________________
2. Bearish Scenario – Futures Are Overreaching
If futures are overshooting, they will have to correct — hard.
From a technical standpoint, if spot will drop below $3,370, the door to a continuation is open toward at least $3,330 support.
A 400-pip drop in spot could translate into at least a 1,000-pip drop in futures, bringing the spread back toward its more typical 20–30 range.
________________________________________
Why This Matters?
Regardless of direction, $100+ spreads do not last. In the next three weeks, one side will be proven wrong, and the prices will snap back together.
Looking back at this year’s price action, spot and futures have always mirrored each other with an average spread of 20-30usd, depending on conditions and expectation, and for example:
• The spot ATH at $3,500 matches $3,509 in futures.
• The May low was identical in both markets.
This current divergence is the outlier — and it’s screaming that a major move is coming.
________________________________________
Bottom line: If futures are right, spot gold is about to rip higher. If spot is right, futures are about to collapse.

GOLD NEXT MOVE (expecting a bearish move)(08-08-2025)Go through the analysis carefully and do trade accordingly.
Anup 'BIAS for the day (08-08-2025)
Current price- 3390
"if Price stays below 3400, then next target is 3380, 3355 and 3340 and above that 3420 and 3455 ".
-POSSIBILITY-1
Wait (as geopolitical situation are worsening )
-POSSIBILITY-2
Wait (as geopolitical situation are worsening)
Best of luck
Never risk more than 1% of principal to follow any position.
Support us by liking and sharing the post.

EURUSD Short-Term Bullish Momentum - Buy ? Hello everyone, what do you think about EURUSD?
Yesterday, we discussed the sideways movement of this pair, and now, it seems that EUR/USD is showing a short-term bullish trend. The price is currently moving around 1.165, as marked on the chart.
In the short term, the market appears ready for further upward movement. With support at multiple levels (Support 1 and Support 2), and the possibility of forming a Support 3 to reach the target of 1.177, the overall outlook remains optimistic.
Keep an eye on how the market reacts at these important levels! Don’t forget to like if you agree with my view!
Good luck!
