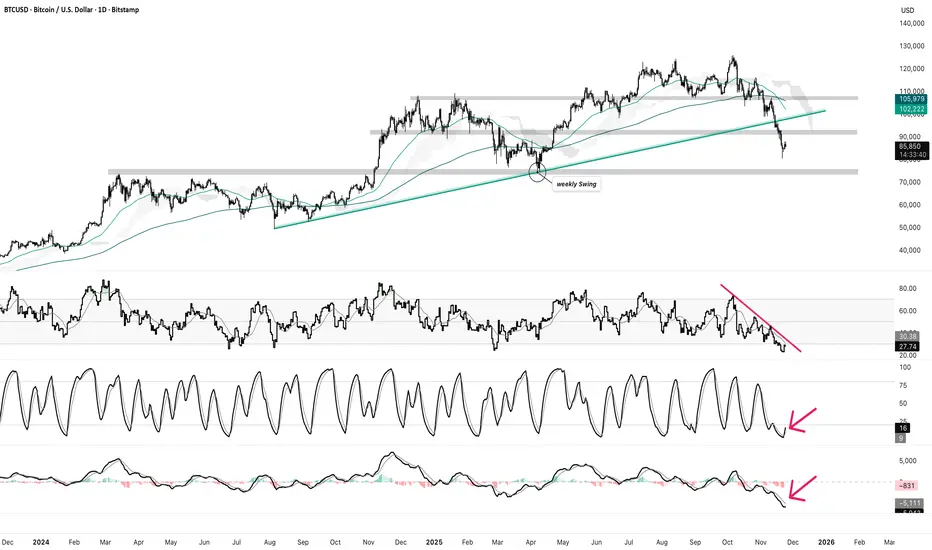
A Relief Rally Is Coming for BitcoinTo keep things simple, based on the oversold situation of DSS Bressert, RSI and MACD on the daily timeframe, it is obvious that a relief rally is certain at this point. The plummet of the "fear and greed" index is also of note. A bullish break of RSI should give the trigger to enter long with a stop below the "weekly swing" and risk being managed as always.
#NFA and always #DYOR
Oscillators
Hang Seng Tech eyes breakout as Alibaba takes the stage
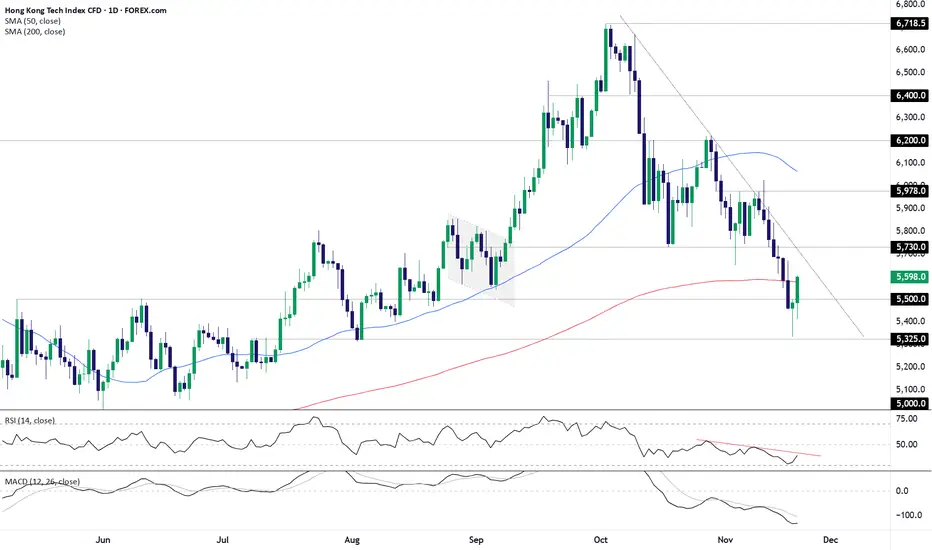
Is the rout in Hang Seng Tech coming to an end? That’s the question traders should be pondering today following the rapid rebound of recent days, seeing the index recover from multi-month lows to trade above the important 200-day simple moving average. It will be important on Tuesday, providing a level to build setups around depending on how the price action evolves during the session.
Before looking at potential ideas, the message from RSI (14) and MACD remains entirely bearish, with the former trending lower beneath the neutral 50 level while the latter sits at depressed levels having already staged a bearish crossover of the signal line earlier this month. With the 50-day moving average curling lower and the price in a clear downtrend, the broader message favours short setups over long.
Given that backdrop, an inability for the index to sustain its push above the 200DMA would generate a potential short setup, allowing for positions to be established beneath it with a stop above for protection. 5500 acted as both support and resistance earlier this year, making it screen as a possible initial target. If it were to be broken, 5325—where the index slide stalled on Friday—would be the next after that.
While bearish setups are favoured, it doesn’t completely dismiss the case for countertrend longs should the index continue to trade above the important 200DMA. If the breakout sticks, longs could be set above it with a stop beneath for protection, targeting the October downtrend and/or 5730 resistance. If those levels were to be broken cleanly, it would hint at the start of a new trend, opening the way to higher levels such as 5978, the 50DMA or 6200.
Alibaba will release its earnings before the U.S. open on Tuesday, with the conference call scheduled for 7:30 a.m. Eastern Time (8:30 p.m. Hong Kong Time).
Still Good Long R:R's (Gold)Setup
Bullish trend / Correction
Gold still above 50 day moving average
Daily RSI stable around 50 level
Has made a 50% correction of rally since breakout at 3400
Commentary
It seems likely gold needs to first complete an ABCD correction before moving higher - meaning one more lower low. However, support at 3920 could hold, offering good R:R opportunities - even if 4200 holds as resistance.
Strategy
Look for bullish reversals below 4000, above 3920 support
Wait for bigger pullback to the 61.8% Fib / demand zone under 3800

GBP/AUD Downside in FocusAnother failed breakout above 2.0300 resistance has produced a shooting star reversal pattern on the charts, signaling potential near-term downside for GBP/AUD. With risk appetite improving as the new week begins, the high-beta Aussie may benefit more than the lower-beta pound, reinforcing confidence in the bearish price signal.
If price remains capped beneath 2.0300, shorts could be considered below the level with a stop above for protection, initially targeting the November 13 uptrend near 2.0180. A break of that level would put 2.0150—where buying emerged last week—on the radar, along with support at the psychologically important 2.0000 mark.
For now, momentum indicators offer a neutral directional bias. RSI (14) is trending higher and sits just above the neutral 50 level. MACD remains in negative territory but has crossed the signal line from below, suggesting diminishing downside pressure. Taken together, the message favors price signals over holding a fixed bias.
Good luck!
DS

Brookfield Renewable (BEPC) — Swing Trade💰 BEPC.TO — Swing Trade Breakdown
Brookfield Renewable (BEPC) just printed a clean RSI2 pullback right into the rising 50-SMA after a strong November run. This is one of the better mean-reversion structures on the TSX right now, especially in a rate-cooling environment where renewables finally have a tailwind again.
🏢 Company Snapshot
BEPC operates one of the largest global renewable energy platforms (hydro, solar, wind). The stock has been basing for months, finally broke out, and is now retesting support with an oversold short-term setup — the exact pattern my system is built for.
📊 Fundamentals (Quick Read)
Not a perfect earnings story but cash flow is strong enough to support the business model:
P/E: N/A due to depreciation-heavy structure
P/B: ~1.7× — reasonable for utilities
Debt/Equity: ~1.1 — high but normal for long-duration assets
ROE: Negative — expected with leveraged renewables
Dividend: ~4.3% — strong income component
FCF: Improving YoY
Cash: ~$700M+ liquidity
Summary: Steady cash flow business with high leverage but a stable long-term profile. Rate cuts would help significantly.
📈 Trends & Catalysts
Revenue: Mid-single-digit growth
EPS: Improving but still choppy
Cash Flow: Consistently rising
Balance Sheet: Leverage high but manageable
Catalysts: Falling yields, ongoing asset recycling, ESG flows
Risks: Rate shocks, refinancing cycles, project delays
🪙 Sector Snapshot
Utilities / Renewables are finally stabilizing after a long drawdown. Lower yields = stronger bids in defensive, cash-flow-heavy sectors. BEPC is showing early leadership this month.
📐 Technical Breakdown
Price is sitting directly on the rising 50-SMA with RSI(2) in extreme oversold territory — a classic Connors-style trigger. Long-term trend intact with price well above the 200-SMA.
Key Levels
Price: $57.46
50-SMA: ~$56.70
200-SMA: ~$49.50
RSI(2): ~3–4 (oversold)
Support: $56.00–56.70
Resistance: $59.50–61.00
Volume: Accumulation spikes on green days
The chart shows a controlled pullback with no breakdown — just a retest of prior demand.
🎯 Trade Plan
Entry Zone: $57.00–57.60 (already hit)
Stop: $56.00 (below SMA + wick lows)
Target: $59.50–60.00
R/R: ~2:1 to 2.5:1
Alternate Setup: Add on a reclaim of $59 with volume for a continuation breakout
🧠 My Take
This is exactly the type of pullback I want — oversold RSI2, clean 50-SMA touch, rising trend, and the sector gaining momentum. As long as $56 holds, I like the bounce back into the $59–60 zone. Great structure for a short-duration swing.

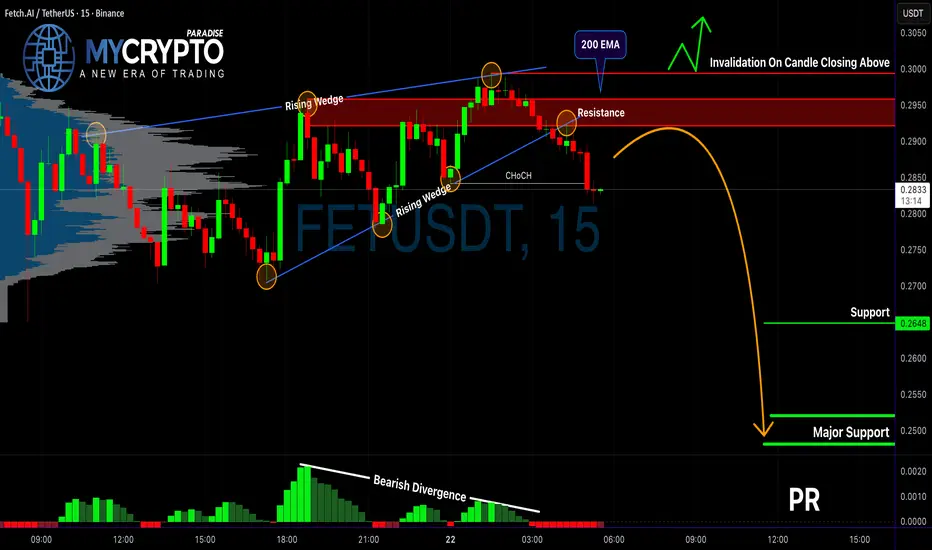
FET Breakdown: Is a Major Dump Just Getting Started?Yello, Paradisers! Have you seen what just happened on FET/USDT? The chart is flashing multiple warning signs, and if you’re not paying close attention, you could get caught on the wrong side of the next big move. Let’s break it down.
💎FETUSDT has officially broken out of a rising wedge pattern—a well-known bearish structure. This breakdown didn’t happen in isolation. It was accompanied by a clear bearish divergence, showing that while the price pushed higher, the underlying momentum was already fading. That’s a red flag for anyone still thinking bullish.
💎More importantly, price action has shown a bearish Change of Character (CHoCH), confirming a potential shift in the trend direction. On top of that, the recent rejection came precisely from the 200 EMA and a known resistance zone, both of which have historically acted as key turning points. When these factors align, they significantly increase the probability of a deeper move to the downside.
💎If the price pulls back from here, the smarter move is to wait for a bearish candlestick pattern to form right at the resistance zone. That would give a cleaner entry with stronger confirmation and a higher reward-to-risk ratio. While aggressive traders may be tempted to enter from current levels—where a 1:1 RR still exists—this is not a sustainable strategy over the long run. Discipline and patience are key if you want to stay consistently profitable.
💎However, if the price breaks out above our invalidation level and closes with conviction, the bearish setup becomes invalid. In that case, it’s best to step aside and wait for more favorable price action to form. There’s no need to rush; missing a trade is always better than forcing one with poor structure.
🎖Strive for consistency, not quick profits. Treat the market as a businessman, not as a gambler.
MyCryptoParadise
iFeel the success🌴
BTCUSDT Market Analysis UpdateHi everyone, I hope you are doing well and I have put my opinion in Bitcoin price on the chart for you. and hope this helps you! Simple, concise, useful
BTC is still trading within a clear bullish market structure, supported by strong HL formations and trendline confluence. At the moment, my main focus is on the Fair Value Gap (FVG) below current price. I expect BTC to revisit this imbalance before continuing the move upward.
The liquidity pool around 82,490 is also important. Personally, I don’t expect price to sweep that level immediately. However, if it does get taken, in my view it would likely serve as the final liquidity grab before resuming the broader uptrend. This makes 82,490 a key level to watch — either it remains untouched while we push higher, or if price sweeps it, the move could act as fuel for the next bullish leg.
From a higher timeframe perspective, the market remains bullish. The structure is intact, RSI is holding mid-range without major bearish divergence, and trendline support has not been broken. Volume also supports this idea — it’s decreasing and showing divergence, but this doesn’t signal a reversal, only a healthy consolidation while holding the bullish trend.
In summary:
Main target: fill the nearby FVG before continuation.
Key liquidity zone: 82,490 (less likely to be taken now, but if it happens, I consider it the last liquidity grab).
Bias: still bullish, expecting higher levels once short-term imbalances are resolved.
Weekly:
As long as BTC holds its HLs and respect the FVG zone, I continue to look for upside continuation — potentially well beyond current levels.
That’s my current view on BTC. Let me know your opinion below 👇
Best regards

FireHoseReel | USDT.D 4H Analysis🔥 Welcome FireHoseReel !
Let’s jump into the Tether Dominance Analysis , one of the most Popular Crypto Index .
👀 USDT Dominance – 4H Timeframe
USDT dominance has reached a major resistance level after a very strong upward rally. At this point, I personally have a bearish bias, expecting a rejection and the completion of a multi-timeframe secondary trend. This view is also supported by my mentor, Arshia Azizpour.
📉 RSI Analysis
Since volume isn’t very reliable on dominance charts, we use the RSI oscillator instead.
RSI has just rejected from the 81 zone, which is a strong static resistance inside the overbought area.
This rejection suggests potential cooldown, pullback, or loss of momentum.
📌 Key Levels to Watch
USDT dominance currently has three major levels:
🔺 6.623% – major top resistance
🔸 6.427% – multi-timeframe trend-shift zone
🔸 6.148% – secondary multi-timeframe trend-shift zone
A clean break and candle close below these levels can give us a bearish bias on dominance, which naturally creates a bullish bias for crypto assets.
⚠️ Important Note
USDT dominance still has strong trend momentum.
If it breaks above the current top, it could trigger another wave of downward pressure on Bitcoin and altcoins.
Historically, these dominance spikes hit BTC and ETH the hardest, while altcoins don’t always fall as aggressively.
🛞 Risk Management & Disclaimer
Please remember to always use proper risk management and position sizing. Nothing in this analysis is financial advice. The market can change quickly, so always trade based on your own strategy, research, and risk tolerance. You are fully responsible for your own trades.

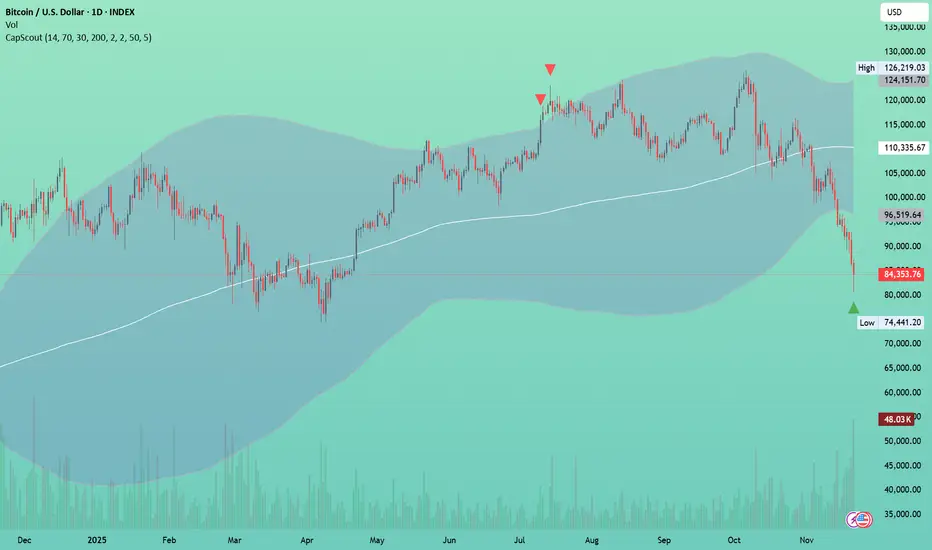
Bitcoin Capitulation Scout Triggered – Potential Local BottomToday, Bitcoin triggered my Capitulation Scout signal with a massive volume spike — one of the strongest we’ve seen in recent days/weeks.
This type of extreme volume on down days has historically marked exhaustion selling and often coincides with at least a short-term/local low.
For context:
Ethereum triggered the exact same Capitulation Scout signal back in April 2025, and what followed was an impressive multi-week recovery rally.
Important disclaimer:
We are now in a different cycle phase compared to April (further along in the 4 year cycle), so the macro setup isn’t identical. Still, these capitulation spikes have a solid track record of producing strong bounces, even if they sometimes only deliver temporary relief rallies.
Watching closely for follow-through in the coming hours/days. A decisive break and hold above recent swing highs would greatly improve the odds of a larger rebound.
Why I Think Gold will Sell...Technical Analysis Hey Rich Friends,
Happy Sunday. I know Gold was on a crazy bull run, we all know what comes up, must come down. It may not happen today, but it will happen soon so I will be using pending orders (sell stops) on this trade. This is only my technical analysis, so please check the news and cross-reference any indicators you have on your chart.
I follow the same process every time and I buy or sell based on which side has the most confirmations. Very systematic and unemotional. Here is what I am looking at:
- The candles have been rejected the 4H high since Friday.
- The red candles are getting bigger and the blue candles are getting small, signaling a bearish reversal.
- There has been a break of structure and retest of the new support on 4H.
- The stochastic is facing down, the orange line is on top and both lines have crossed below 80.
- There are all strong bearish confirmations for me which is why I decided to set sell stops in increments on 500 pips.
Additional Information:
- You can wait for stronger sell signals on the Daily or 1H time frame.
- Wait for current 4H candle to close to confirm selling trend.
- Use previous highs as stop losses and previous lows as sell stops and TPs.
Great luck if you decide to take this trade. Let me know your thoughts on this ideas in the comments.
Peace and Profits,
Cha

Why I Think EURUSD Will Sell This Week...Technical AnalysisHey Rich Friends,
Long time, no see. I wanted to share why I think EURUSD will sell this week, based on my technical analysis. Please check the news and cross reference any indicators on your own chart.
1. The market has crossed and closed below the previous support level at 1.15920. This is also known as a break and retest to the downside.
2. The sellers have been picking up steam over the last couple of hours confirming the selling trend for me.
3. The stochastic is facing down, the slow line (orange) is above the fast line (blue), and both lines have crossed below 50 and 20. There are all bearish/sell confirmation for me.
Additional notes:
- I will use a previous high as my stop loss and previous lows as my TPs.
- I will be setting multiple pending order sell stops and TPs down to 1.15200 and even lower. If they trigger, they trigger, if they don't, I lose nothing.
Good luck if you decide to take this trade. Do what makes sense for you.
Peace and Profits,
Cha

TSE:CAS Cascades Inc — Swing Trade==============================================
TSE:CAS — Swing Trade Plan Analysis
==============================================
**1. Overview**
* **Price:** 12.27
* **Trend Filter:** Above 200 SMA (Strong long-term bullish trend.)
* **Best Setup Type:** This data presents a **Mean Reversion / Pullback Buy in a Strong Uptrend** setup. The stock is in a confirmed bullish trend across multiple timeframes (Price > EMA20 > EMA50 > SMA200), yet has pulled back to its 2-day low, showing extreme oversold conditions on the short-term RSI(2). This suggests a high probability of a bounce continuing the broader uptrend.
**2. Trend Analysis**
* **EMA/SMA Relationship:** Price (12.27) is trading above all key moving averages (EMA20: 11.87, EMA50: 10.99, SMA200: 9.77). Furthermore, the shorter-term EMAs are above the longer-term MAs, indicating a healthy and robust uptrend across short, intermediate, and long timeframes.
* **Distance from EMA20:** At 3.35% above EMA20, the price is slightly extended but indicates strong bullish momentum. The current pullback to the 2-day low might be seen as a retest or a short-term consolidation before moving higher.
**3. Mean Reversion**
* **RSI(2):** An RSI(2) of 7.74 is *extremely* oversold. This is a strong indicator for a short-term mean reversion bounce, especially when coupled with an underlying uptrend.
* **Down-streak:** 0. This implies the current day is either the first down day or the stock is at a low without consecutive down days, supporting the idea of a potential bounce from a fresh low.
* **Price vs 2-Day Low:** 0.00%. The current price is exactly at the 2-day low (12.27). This further reinforces the oversold condition and identifies the current price as a potential support level for a bounce.
**4. Key Levels**
* **Support:**
* Immediate: 12.27 (Current price, 2-Day Low)
* Previous 14-Day High (now likely support due to breakout): 11.90
* Stronger: 14-Day Low at 11.59.
* Dynamic: EMA20 at 11.87, EMA50 at 10.99.
* **Resistance:**
* Immediate: 2-Day High at 12.60.
* **Volatility:**
* ATR(14): 0.70 (Useful for stop loss and target projections)
* ADR(20): 0.32 (Indicates typical daily movement range)
**5. Volume**
* **Volume Today (170.09K)** is currently below the 20-day average (272.74K). This can be a constructive sign on a pullback, suggesting a lack of strong selling conviction.
* **Volume Trend: Volume Rising.** This suggests a general increase in trading activity in recent periods, supporting the overall bullish momentum despite today's current volume being below average.
**6. Market Risk**
* **VIX: 27.66.** This is an elevated VIX level, indicating higher market volatility and increased risk. This suggests a need for caution and reduced position sizing.
**7. Trade Plan**
* **Entry:** 12.27 (As provided and aligns with the 2-day low and oversold conditions for a bounce).
* **Stop:** Using structure, placing a stop just below the 14-Day Low of 11.59. A stop at **11.55** (approximately 1.03x ATR below entry) clears this key structural support.
* **Target 1:** The nearest resistance level, which is the 2-Day High.
* Target 1: **12.60**
* **Target 2:** An extension target, projecting beyond immediate resistance. Considering the strong underlying trend, a move equal to 1x ATR above Target 1.
* Target 2: 12.60 (2-Day High) + 0.70 (ATR) = **13.30**
* **Position Size:** Adjust position size downwards due to the elevated VIX (27.66). Consider reducing by 25-50% from your normal risk allocation.
**8. Invalidation Conditions**
The setup is invalidated if:
* Price closes below the stop loss level of **11.55**.
* Price breaks and holds below the 14-Day Low (11.59), indicating a deeper pullback or trend reversal.
* Significant deterioration in broader market conditions (e.g., VIX spikes further, major indices show extreme weakness).
* Price fails to show any bullish momentum or bounce action within the next trading period.
**9. Risk-to-Reward (R:R)**
* **Entry:** 12.27
* **Stop:** 11.55
* **Risk per share:** 12.27 - 11.55 = **0.72**
* **To Target 1 (12.60):**
* Reward per share: 12.60 - 12.27 = 0.33
* **R:R (to T1): 0.33 / 0.72 = 0.46:1** (This is a low R:R for a full trade; Target 1 serves as an initial hurdle or partial profit-taking level).
* **To Target 2 (13.30):**
* Reward per share: 13.30 - 12.27 = 1.03
* **R:R (to T2): 1.03 / 0.72 = 1.43:1** (This provides a more acceptable risk-to-reward ratio for a swing trade, assuming the target extension is reached)."

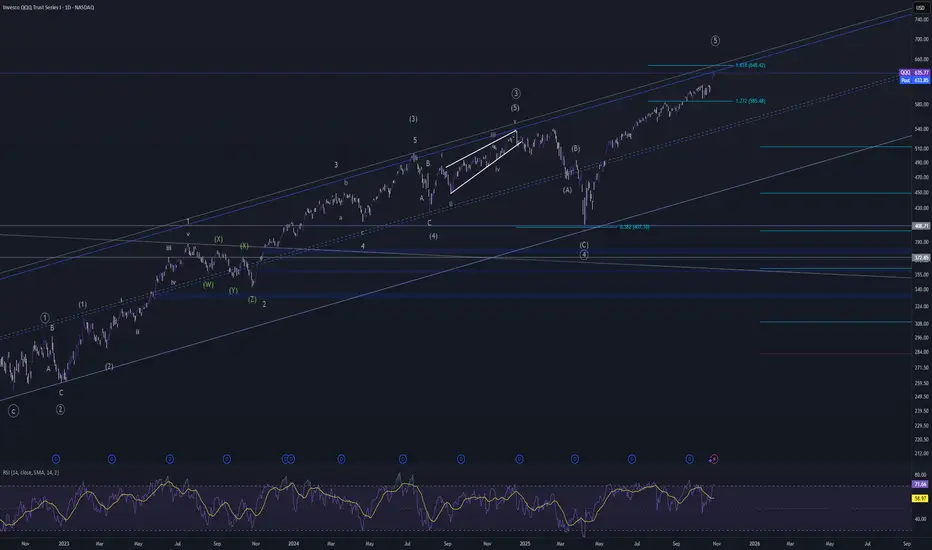
QQQ finally topping out?Getting near the top of the channel since 2022. The 161.8% extension of the drop down to April is right above today's high as well. Market is overbought with bearish divergence on the daily, weekly, and monthly. Maybe 1 more high???
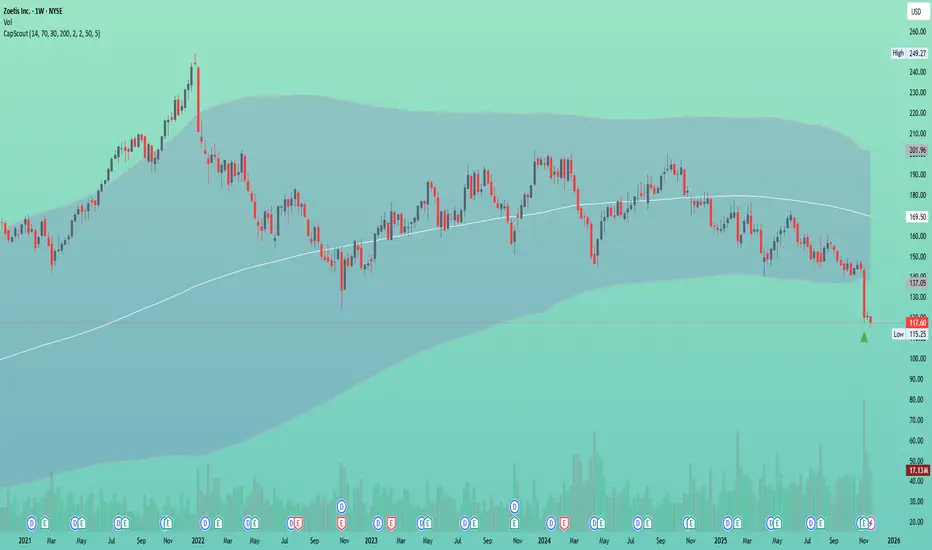
Zoetis $ZTS – Weekly Capitulation Scout SignalZoetis has triggered a fresh Capitulation Scout signal on the weekly timeframe (Fig. 1), pointing to a potential early bottoming phase
Downside momentum is showing signs of exhaustion, which often precedes medium- to long-term reversals in this setup
The next weeks may offer attractive opportunities to begin building long-term positions
Previous signals of this type worked well: LVMH EURONEXT:MC (Fig. 2) and Samsung $005930 (Fig. 3) both marked strong accumulation zones before multi-month recoveries:
I’ll be monitoring for confirmation and potential scale-in levels
Not financial advice. For educational purposes only
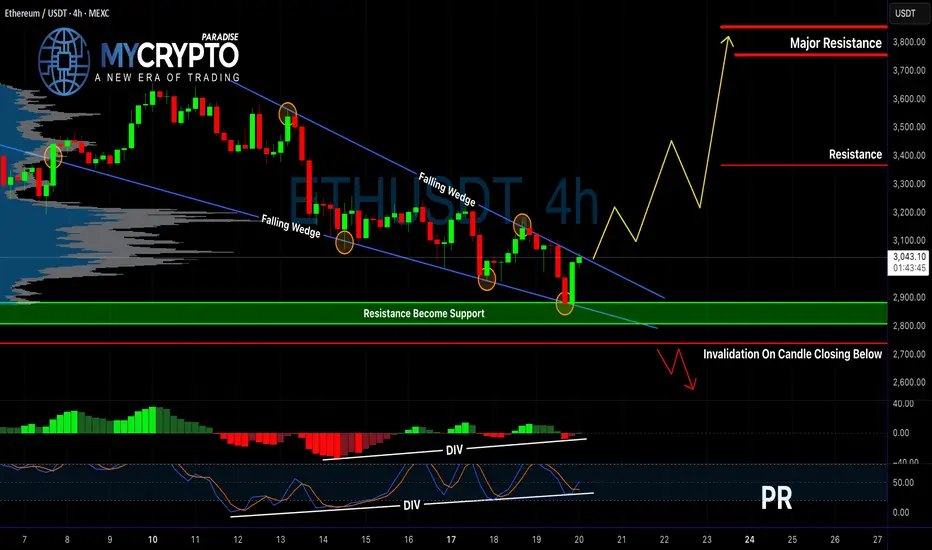
ETH About to Explode or Collapse?Yello Paradisers! Are you prepared for what’s coming next on ETHUSD? Because right now, Ethereum is sitting on the edge of a critical structure that could lead to a major breakout—or trap unsuspecting traders in another fake move. The setup is developing quickly, and what happens next will determine the short-term direction in a big way.
💎ETHUSD is currently forming a textbook falling wedge pattern, a structure often seen at the end of corrective phases and typically followed by strong bullish breakouts. What adds more weight to this scenario is the clear bullish divergence forming on both the MACD histogram and the Stochastic RSI. These indicators suggest that bearish momentum is weakening and bulls may be getting ready to take control.
💎For traders who prefer confirmation, the ideal move is to wait for a decisive breakout above the wedge. That would significantly increase the probability of a sustained bullish move and reduce the risk of being caught in a fakeout. However, for more aggressive traders, there may already be a reason to act. A bullish engulfing candle has formed directly at a key support level—an early signal that buyers are starting to step in with strength.
💎That said, we cannot ignore the invalidation scenario. If the price breaks down and closes candle below the defined invalidation level, the entire bullish outlook will be off the table. In that case, it will be crucial to stay patient and wait for a clearer price action setup to form before considering new positions.
Strive for consistency, not quick profits. Treat the market as a businessman, not as a gambler.
MyCryptoParadise
iFeel the success🌴
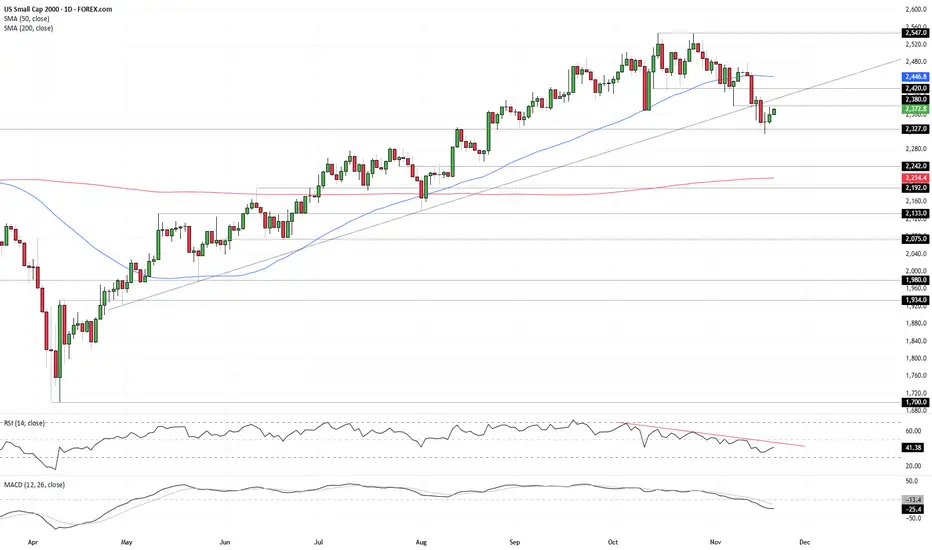
Momentum Weak Despite Nvidia BoostShould small-cap U.S. equities be rallying because AI giant Nvidia just delivered another blowout earnings update? Sure, risk sentiment has improved, and continued AI investment comes with some immediate broader economic benefits, but the move still comes across as a little suspect, especially with the prospect of near-term Fed rate cuts dwindling by the day. While the price signals for our small-cap contract are pointing to upside risks, momentum indicators are not confirming, suggesting selling into strength may be the way to play it, especially if we see a reversal pattern.
Looking at the daily chart, we see a clear morning star bullish reversal pattern printed this week, with follow-through buying after the Nvidia results. However, as was the case in the prior session, the price has been unable to take out 2380 so far, marking the low struck on November 7. It’s only a minor level, but it has seen price action on either side of it this month, making it relevant when assessing setups.
Despite the bullish price signal, RSI (14) and MACD remain firmly bearish. RSI continues to trend lower beneath 50, indicating downside pressure remains even if it’s weakened a touch in recent days. MACD also sits in negative territory, having already crossed the signal line from above in late October. It too is showing signs of turning, but for now the combined message remains one where selling into strength may be the better way to play it.
Should the price be unable to breach and hold above 2380, shorts could be considered beneath the level with a stop above for protection, targeting 2327 support initially. Should that and Tuesday’s low give way, 2275 or 2242 screen as other downside targets.
Of course, if the price can push above and hold 2380, longs could also be considered, allowing for a stop to be placed beneath to protect against reversal. Such a move may see momentum indicators tilt neutral rather than bearish. If that were to occur, the merits of long trades would be improved. 2400, where the price was capped prior to the latest leg lower, looks as an appropriate initial target, with the 50DMA the next after that.
Good luck!
DS
COPPER / GOLD & ISM PMI = Critical For AltseasonBeen seeing a lot of commentary on COPPER / GOLD.
This is a strong indication of industrial growth in the economy, as the demand for copper rises with build-outs.
The ISM PMI has a very strong correlation with C/G, also showing strength in the economy, as consumers buy more which gives businesses the ability to expand operations.
In a nutshell, these charts portray “Retail” ie “Main Street”.
There’s a very real possibility that we do not get our typical Alt Season at all this cycle if C/G & ISM PMI do not have a violent move up in the next few months. (more on this later)
The last time we saw such a divergence between these two was in January 2016 where it took C/G ~230 days to turn-up.
This would put Alt-Season Q4 ’26 - Q1 ’27, which makes sense theoretically based on Trump’s suspected stimulus plans which would come right before mid-terms.
This would give us our typical year-long bear market which has snuck up on us all because we lacked the retail euphoria phase due to very weak retail participation.
HOPIUM:
In 2016 When the ISM climbed above 50, COPPER soon found a bottom and Alts ripped.
Notice the bullish divergence on the RSI during that time, same as we are seeing now.
It looking like C/G may have found a bottom on this multi-decade parallel channel.
*Our livelihood depends on the ISM showing immense strength in the coming months so that C/G can follow.

Bullish Divergences on Lower TimeframesBullish divergences currently presenting on the 30min and below timeframes on the Accum/Distr and Money Flow Index indicators. Pop to $1.50 + could be imminent. If so, I will prepare for a subsequent retest of the floor at $1.13.

Pre-Nvidia Q3 2025 EARNINGS - Two Scenarios to WatchNVDA is sitting right on the Anchored VP POC with an oversold Stoch RSI and price trading under the EMA-20 Bollinger band (1 std). That’s the same setup that has triggered reversion bounces multiple times this year.
Scenario 1 — Bounce and Band Chop (Green Path)
If NVDA holds the POC, the most natural move is a bounce back into the EMA-20 band's high.
From there, expect price to whip around inside the band because that’s been its early 2025 behaviour: revert → chop → retest.
The upper band sits just under $200, a psychological and structural resistance.
This is the high-probability scenario if earnings are neutral or strong.
Scenario 2 — Break Below POC and Turn It into Resistance (Red Path)
If earnings disappoint and NVDA gaps below the POC tomorrow, that same level becomes a potential resistance on any intraday bounce.
But — and this is the part many people miss —
Scenario 1 is still valid unless we get a clear rejection from the underside of POC.
Meaning:
A break below POC is not automatically a trend shift
A failed reclaim with a clean rejection is the real confirmation
Only then do we look toward the next structural level at the Jan Top zone around 155–160.
NVDA is at a decision point. Earnings drop after today’s close — the real move will be at tomorrow’s open. Whether we bounce into the band or reject off the POC will tell you everything about the next leg.

Newmont’s Uptrend May Be IntactNewmont has steadily rallied in 2025, and some traders may think its uptrend remains intact into yearend.
The first pattern on today’s chart is the rebound from last month’s pullback. The gold miner is trying to hold a 50 percent retracement of the move, which may confirm its direction is still pointing higher.
Second, NEM is back above its rising 50-day simple moving average. That may suggest its intermediate-term trend is still bullish.
Third, the 8-day exponential moving average (EMA) is above the 21-day EMA. MACD is also rising. Those patterns may be consistent with a bullish short-term trend.
TradeStation has, for decades, advanced the trading industry, providing access to stocks, options and futures. If you're born to trade, we could be for you. See our Overview for more.
Past performance, whether actual or indicated by historical tests of strategies, is no guarantee of future performance or success. There is a possibility that you may sustain a loss equal to or greater than your entire investment regardless of which asset class you trade (equities, options or futures); therefore, you should not invest or risk money that you cannot afford to lose. Online trading is not suitable for all investors. View the document titled Characteristics and Risks of Standardized Options at www.TradeStation.com . Before trading any asset class, customers must read the relevant risk disclosure statements on www.TradeStation.com . System access and trade placement and execution may be delayed or fail due to market volatility and volume, quote delays, system and software errors, Internet traffic, outages and other factors.
Securities and futures trading is offered to self-directed customers by TradeStation Securities, Inc., a broker-dealer registered with the Securities and Exchange Commission and a futures commission merchant licensed with the Commodity Futures Trading Commission). TradeStation Securities is a member of the Financial Industry Regulatory Authority, the National Futures Association, and a number of exchanges.
TradeStation Securities, Inc. and TradeStation Technologies, Inc. are each wholly owned subsidiaries of TradeStation Group, Inc., both operating, and providing products and services, under the TradeStation brand and trademark. When applying for, or purchasing, accounts, subscriptions, products and services, it is important that you know which company you will be dealing with. Visit www.TradeStation.com for further important information explaining what this means.

GRAB 1D - picking phones off the market floor again?GRAB pulled back exactly into the 4.90–5.10 buy-zone, where the wedge retest aligns with the MA200 - a major technical cluster that previously launched strong impulses. Oscillators show deep oversold conditions, candles print buyer tails, and the first resistance sits at 5.35, matching the 0.618 retracement. A breakout above 5.35 opens the path toward 8.65 (1.618), and a move above 6.80 could initiate a larger rally toward 11.92 based on the 2.618 extension.
Company: Grab Holdings is Southeast Asia’s largest super-app platform, combining ride-hailing, food delivery, fintech, payments, and micro-lending across Singapore, Malaysia, Indonesia, Thailand, and Vietnam.
Fundamentally , as of November 19, GRAB continues to strengthen: gross profit and GMV grow, operational efficiency improves, and both ride-hailing and delivery segments have reached sustainable profitability. Fintech is expanding at double-digit rates, margins improve as subsidies are reduced, and operating losses continue to shrink. Cash flow strengthens, the path to full profitability is visible, and the overall digital-services boom across Southeast Asia remains a long-term driver for growth. Competition cooled, monetization improved - exactly то environment the company needed.
Technically , the bullish scenario holds as long as price stays above 4.90–5.10. A breakout above 5.35 activates the 8.65 target, and the major upside - 11.92 - becomes realistic once price gets above 6.80. A drop below 4.80 complicates the picture, but current structure still looks like a controlled reset rather than a trend break.
Grab acting like usual: discounts first, acceleration later - Southeast Asia likes this script.

BTC/USD: Hammer Candle Meets NvidiaGranted, it could easily be seen as catching a falling knife or position squaring before a key risk event, but the hammer candle that printed on the BTC/USD daily chart has me interested, particularly as it came from a zone where it’s attracted buying in the past. It makes me wonder whether we’ve seen the lows for now, opening the door for countertrend long setups in the near term.
For one, BTC/USD has a decent track record for delivering reliable bullish and bearish reversal signals. The shooting star candle on 6 October kicked the bearish move off, with a bearish engulfing on 11 November coinciding with the resumption of the bear trend following a fleeting bounce. And that’s only the signals we’ve seen recently, with many others proving to be prescient earlier in the year.
Secondly, the dip and reversal from beneath $92,000 is noteworthy given price action seen around the level over the past year. There were constant dips and bounces from beneath it in late 2024 and early 2025, before it eventually flipped to offering resistance after a successful bearish break in February. Now testing the level again from above, you can’t dismiss the signal entirely.
While momentum indicators remain firmly bearish, favouring selling into strength, with RSI (14) now sitting in oversold territory, there’s grounds for countertrend long trades to be considered for those anticipating a short squeeze.
For now, I’m watching the price action around $92,000 as we move towards the key macro event for the week, Nvidia’s earnings report. With a correlation coefficient of 0.87 with Nasdaq 100 futures over the past fortnight, it suggests how traders respond to the earnings update will likely influence how BTC/USD trades.
Should the price hold $92,000, longs could be set above the level with a stop beneath for protection, targeting either former downtrend support located around $96,000 today or former support at $99,060.
On Nvidia’s earnings report, I don’t think anyone can say with certainty as to what will transpire, other than history suggests the chip giant will likely breeze past top-line revenue forecasts with bullish guidance from CEO Jensen Huang. But that’s essentially consensus, meaning the performance of riskier assets in the aftermath may reflect whether it’s good enough to justify the hype. Sure, the recent pullback has lowered the bar somewhat, but the bar remains incredibly high. If it can impress, bitcoin may well bounce.
Good luck!
DS

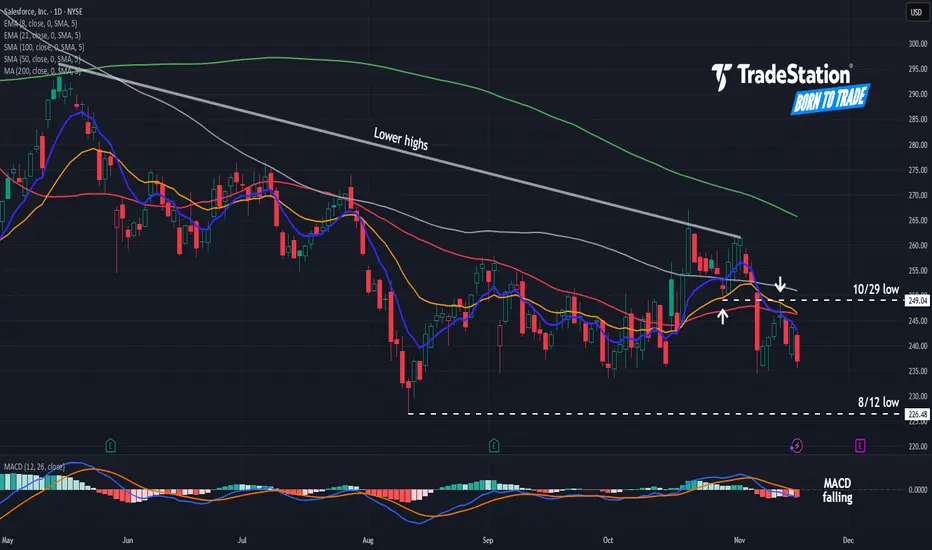
Salesforce May Be SlidingSalesforce has limped despite the broader market climbing. Now some traders may see risk of a bigger slide in the software company.
The first pattern on today’s chart is the series of lower highs since mid-May. That could suggest sellers outnumber buyers.
Second, the 50-day simple moving average (SMA) is below the 100-day SMA. Both are below the 200-day SMA. Such a configuration, with faster SMAs under slower ones, could reflect a long-term downtrend.
Third, the 8-day exponential moving average (EMA) recently crossed below the 21-day EMA. MACD is also falling. Those signals may be consistent with a short-term downtrend.
Fourth, CRM bottomed at $249.04 on October 29 and peaked near that level on November 12. Has old support become new resistance?
Finally, traders may see risk of a move toward the 52-week low below $230 if weakness continues.
TradeStation has, for decades, advanced the trading industry, providing access to stocks, options and futures. If you're born to trade, we could be for you. See our Overview for more.
Past performance, whether actual or indicated by historical tests of strategies, is no guarantee of future performance or success. There is a possibility that you may sustain a loss equal to or greater than your entire investment regardless of which asset class you trade (equities, options or futures); therefore, you should not invest or risk money that you cannot afford to lose. Online trading is not suitable for all investors. View the document titled Characteristics and Risks of Standardized Options at www.TradeStation.com . Before trading any asset class, customers must read the relevant risk disclosure statements on www.TradeStation.com . System access and trade placement and execution may be delayed or fail due to market volatility and volume, quote delays, system and software errors, Internet traffic, outages and other factors.
Securities and futures trading is offered to self-directed customers by TradeStation Securities, Inc., a broker-dealer registered with the Securities and Exchange Commission and a futures commission merchant licensed with the Commodity Futures Trading Commission). TradeStation Securities is a member of the Financial Industry Regulatory Authority, the National Futures Association, and a number of exchanges.
TradeStation Securities, Inc. and TradeStation Technologies, Inc. are each wholly owned subsidiaries of TradeStation Group, Inc., both operating, and providing products and services, under the TradeStation brand and trademark. When applying for, or purchasing, accounts, subscriptions, products and services, it is important that you know which company you will be dealing with. Visit www.TradeStation.com for further important information explaining what this means.