ETH 1H Analysis – Key Triggers Ahead | Day 9💀 Hey , how's it going ? Come over here — Satoshi got something for you !
⏰ We’re analyzing ETH on the 1-hour timeframe timeframe .
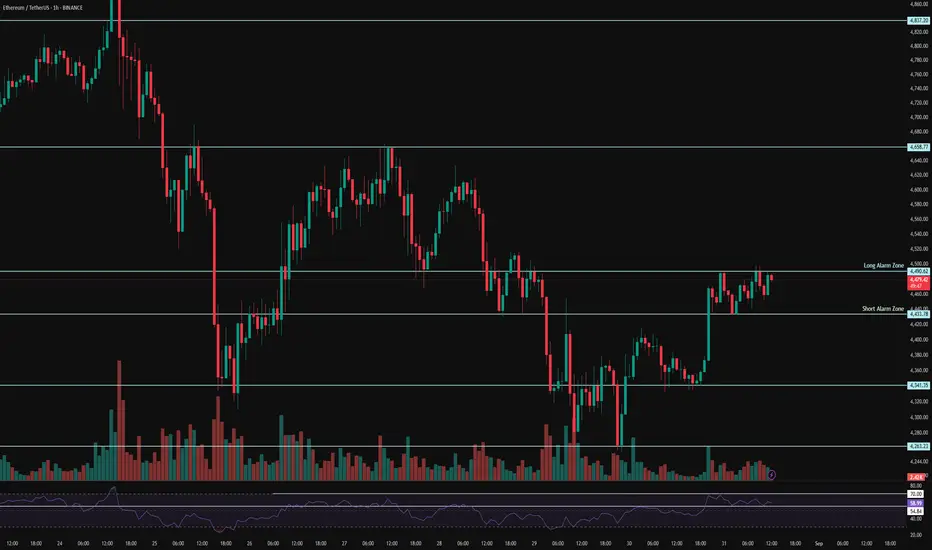
🔭 On the 1-hour timeframe of Ethereum, we can see that after being rejected from the \$4500 alert zone, Ethereum moved downward and formed short-term support at the \$4371 area. If this level is broken, Ethereum could experience a deeper correction in the multi-timeframe view.
⛏ The key RSI levels are at 58 and 39. Once the oscillator crosses these levels, Ethereum can start its move.
💰 The size and number of Ethereum’s red candles are significantly greater than the green ones, and if this support is lost, Ethereum could move further downward into selling pressure.
🪙 On the 1-hour ETHBTC timeframe, we can see that after activating the short alert zone and receiving confirmation for a sell trade, Ethereum is moving downward. It has support at the 0.03996 level, which coincides with the 30 RSI zone or the OverSell boundary.
🔔 The alert zones considered for Ethereum are the \$4371 area and the \$4500 area. Based on price action in these zones, we can find the best trade opportunities. With further decline of ETH against Bitcoin, reduced volatility, and price leaning toward selling, we may see a deeper correction.
❤️ Disclaimer : This analysis is purely based on my personal opinion and I only trade if the stated triggers are activated .
Oscillators

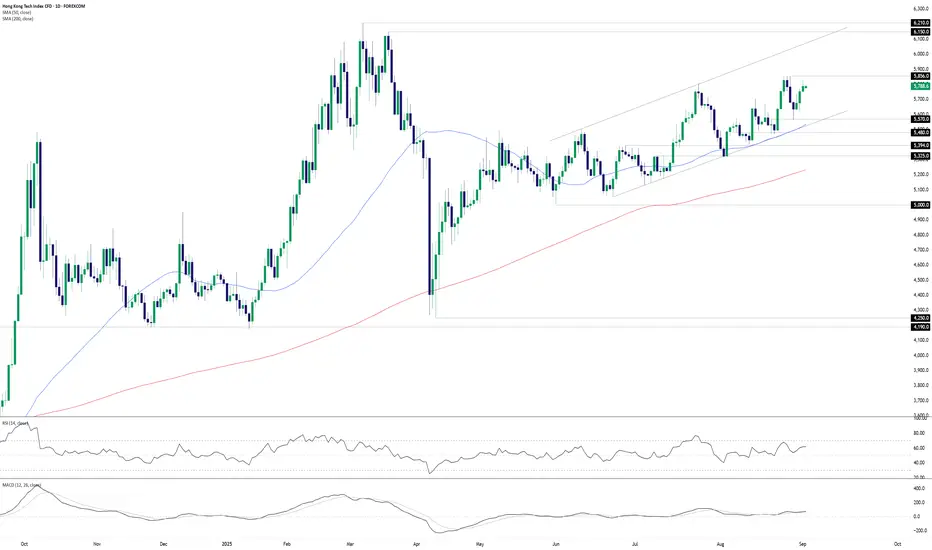
Hang Seng Tech: 5800 proves trickyHang Seng Tech continues to struggle above 5800, reversing lower after another failed probe above the level on Monday, mirroring price action seen earlier this year. While the broader trend is undeniably bullish, without a definitive break and close above 5856, near-term directional risks may be lower.
If we were to see another failed push above 5800 on Tuesday, shorts could be established beneath the level with a stop above 5856 for protection. 5700, 5570 and 50-day moving average screen as potential targets, depending on desired risk-reward from the trade.
As mentioned above, the broader trend for the contract is entirely bullish. The price is in an ascending channel with the 50 and 200-day moving averages pushing higher. RSI (14) and MACD are also generating bullish signals, favouring a similar directional bias.
As such, if the contract were to close above 5856, it would generate a bullish setup where longs could be established on the break with a stop beneath the level, targeting 6000, 6150 or 6210—the latter coinciding with 2025 year-to-date high.
Alternatively, if we were to see a pullback to channel support/50DMA and bounce, longs could be established with a stop beneath the support zone for protection against reversal. 5700, 5800 and 5856 screen as potential targets.
Good luck!
DS
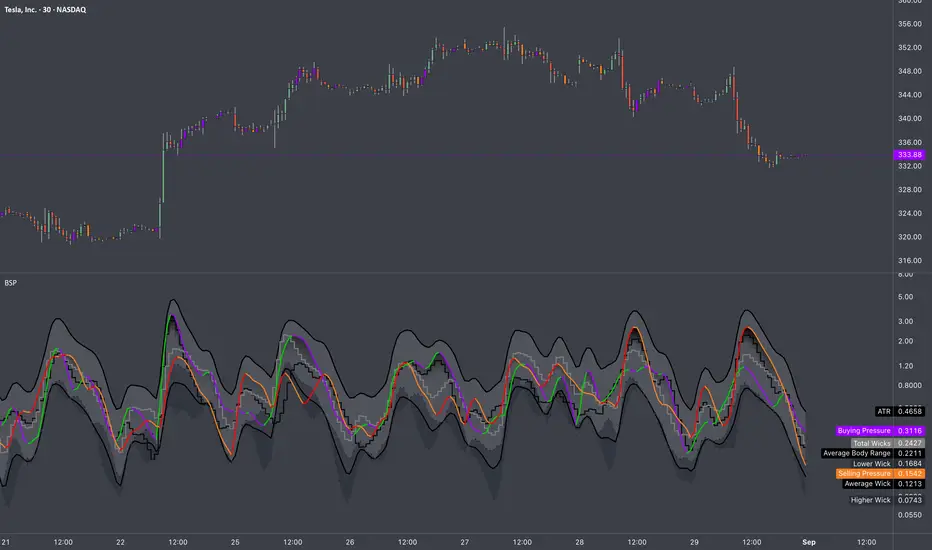
Candle Metrics: BSP Guide🏛️ RESEARCH NOTES
Buying & Selling Pressure measures the internal dynamics within a candlestick that shapes the trends. It dissects each OHLC range into distinct components made of Body Range, Higher & Lower Wicks, making it possible to quantify bullish & bearish parts of bar range. BSP doesn’t just point direction, it reveals magnitude - how much buyers or sellers injected into the move, and whether that push is accelerating or running out of steam.
Unlike Average %Δ , which uses separate conditional averaging by "count", BSP processes candles through periodic averaging that makes it more responsive for important transitions like: divergence from volatility benchmarks. incentive change (spotting early reversals after impulsive move), filtering false breakouts, confirming trend strength, etc.
⚖️ Candle Metrics
Buying Pressure (BP)
Represents the degree of upward displacement relative to prior reference points.
🟢 Rising BP: Signals growing demand absorption and accumulation, often preceding sustained advances.
🟣 Falling BP: Indicates waning participation from buyers; persistent declines while price rises suggest trend fatigue and elevated risk of retracement.
Selling Pressure (SP)
Captures downward displacement relative to highs and prior closes.
🔴 Rising SP: Reflects heightened distribution activity, consistent with institutional supply or hedging flows.
🟡 Falling SP: Suggests sellers are withdrawing liquidity; commonly observed near troughs as downside momentum exhausts.
Average True Range (ATR) Rising ATR = higher volatility, falling ATR = calm markets. High BP in low ATR = stealth accumulation.
Body Range (BR) Large bodies show conviction, small bodies = indecision. Strong BR + rising BP = solid bullish trend.
Higher Wick (HW) Long HW means rejection at highs (supply). Falling HW means buyers are holding gains.
Lower Wick (LW) Long LW means rejection at lows (demand). Falling LW signals less defense from buyers.
Total Wicks (TW) More wick length = intrabar battles. Expansion of TW with small bodies often precedes reversals.
Average Wick (AW)
Rising AW = more volatility both ways. Falling AW = cleaner, directional trend.
Darkened Tops
Tracks the strongest side (BP or SP) over the lookback period. Its primary function is to dynamically highlight moments of extreme pressure. When either the Buying or Selling Pressure value reaches the level, the tops would . This provides an immediate visual cue for:
Black Colored Plot: A signal that the current buying or selling pressure has hit a significant level relative to recent history, often pointing to climactic activity or a potential exhaustion point.
◇ Practical Interpretation
Trend Confirmation BP ↑, SP ↓, BR ↑, ATR steady → sustainable directional advance.
Exhaustion BP ↓, SP steady or rising, HW ↑ = buyers tiring at resistance, overextended into supply.
Accumulation BP ↑, LW ↑, TW ↑ but ATR low = stealth buying before breakout.
Distribution SP ↑, HW ↑, TW ↑ = sellers unloading into strength. supply emerging into strength, caution warranted.
3 Reasons Gold Is A Good Buy
--
Gold and silver are precious metals. One time I was listening to one of the best economic influencers on YouTube
And he said once you see a buy signal in Copper then it's an indicator to buy Good and silver
Well using candlesticks patterns I saw the buy signal in Copper and it's because of this I think gold and Silver are in buying territory.
So this is what has happened so far:
1)Gold has outperformed Bitcoin
2)Silver has outperformed Bitcoin
3)Ethereum has outperformed Bitcoin
So far things are not looking to well for Bitcoin.
Do you remember the Rocket Booster Strategy?
It has the following 3 Steps:
1)The price has to be above the 50 EMA
2)The price has to be above the 200 EMA
3)The price has to gap up
That last step includes a candlestick pattern.
Now in this case the Rocket Booster Strategy is being used for the monthly chart.
Meanwhile on weekly we checked for negative Momentum.
Then on the daily chart we checked for a candlestick pattern wether bullish or bearish.
In this case the candlestick pattern is bullish on Copper.
So does this mean gold is bullish?
Rocket Boost This Content To Learn More.
Disclaimer ⚠️ Trading is risky please learn about risk management and profit taking strategies and feel free to use a simulation trading account before you use real money.

From Strength to Weakness: ETH Validates a Key Bearish PatternIntroduction (Market Context)
Ether Futures (ETH) and Micro Ether Futures (MET) have been at the center of market attention since April 2025, when prices staged a remarkable rally of more than +250%. This surge was not just a technical phenomenon—it came in the wake of major macro events such as Liberation Day and the reemergence of U.S. tariff policies under Donald Trump’s administration. Those developments sparked speculative flows into digital assets, with Ether acting as one of the prime beneficiaries of capital rotation.
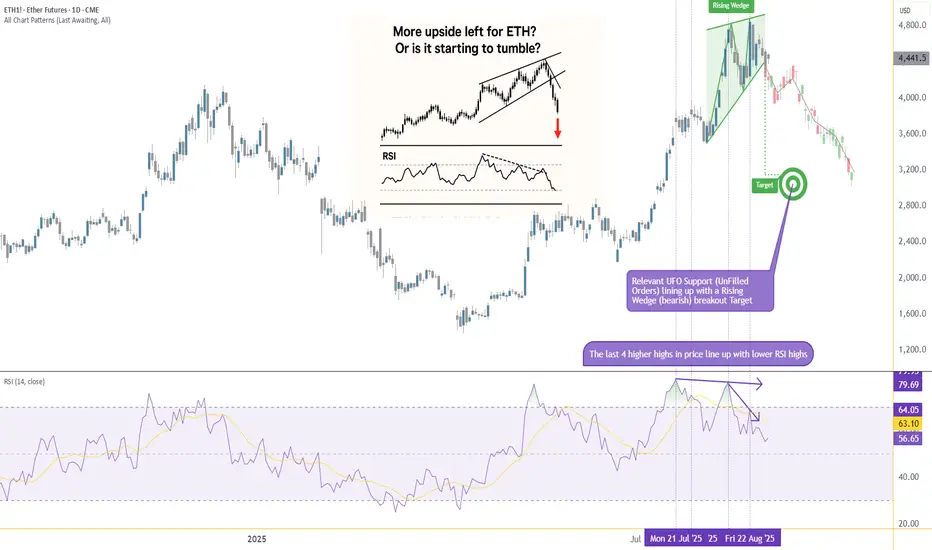
Yet markets rarely move in one direction forever. After such a sharp rise, technical exhaustion often follows, and signs of that exhaustion are beginning to surface on ETH’s daily chart. Traders who enjoyed the rally now face a critical juncture: whether to protect gains or to consider new opportunities in the opposite direction. The key lies in a pattern that has appeared many times in history, often marking important reversals—the Rising Wedge.
What is a Rising Wedge?
A Rising Wedge is one of the most recognizable bearish reversal formations in technical analysis. It typically develops after a strong uptrend, where price continues to push higher but does so with diminishing momentum. On the chart, the highs and lows still point upward, but the slope of the highs is shallower than the slope of the lows, creating a narrowing upward channel.
The psychology behind the wedge is critical: buyers are still in control, but they are running out of strength with every push higher. Sellers begin to absorb demand more aggressively, and eventually, price breaks through the lower boundary of the wedge. This breakdown often accelerates as trapped buyers unwind positions.
From a measurement perspective, technicians project the maximum width of the wedge at its start, and then apply that distance downward from the point of breakdown. This projection offers a technical target for where price may gravitate in the following weeks. In the case of Ether Futures, that target points toward the 3,200 area, a level of strong technical interest and a logical area for traders to watch closely.
RSI and Bearish Divergence
Alongside the wedge, momentum indicators add further weight to the bearish case. The Relative Strength Index (RSI) is a widely used oscillator that measures momentum on a scale of 0 to 100. Values above 70 are generally interpreted as “overbought,” while values below 30 suggest “oversold.”
The most powerful signals often emerge not when RSI is at an extreme, but when it diverges from price action. A bearish divergence occurs when price sets higher highs while RSI forms lower highs. This is an indication that upward momentum is weakening even as price appears to climb.
Ether Futures have displayed this phenomenon clearly over the past few weeks. The daily chart shows four successive higher highs in price, yet RSI failed to confirm these moves, instead tracing a series of lower peaks. Notably, RSI pierced the overbought zone above 70 twice during this period, but momentum faded quickly after each attempt. This divergence is a classic early warning sign that a bullish run is running out of steam.
Forward-Looking Trade Idea
With the Rising Wedge breakdown and RSI divergence in place, a structured trade plan emerges. Futures traders can express this view through either the standard Ether Futures contract (ETH) or its smaller counterpart, the Micro Ether Futures contract (MET).
Contract Specs & Margins
Ether Futures (ETH): Notional = 50 Ether, Tick size = 0.50, Tick value = $25.00, Initial margin ≈ $68,800 (subject to CME updates).
Micro Ether Futures (MET): Notional = 0.1 Ether, Tick size = 0.50, Tick value = $0.05, Initial margin ≈ $140 (subject to CME updates).
Trade Plan (Bearish Setup)
Direction: Short
Entry: 4,360
Target: 3,200
Stop Loss: 4,702 (coinciding with a minor resistance level)
Reward-to-Risk Ratio: ≈ 3.39 : 1
The projected wedge target around 3,200 is not only a measured move from the pattern but also sits close to a previously established UFO support zone. While anecdotal, this confluence reinforces the credibility of the level as a potential magnet for price.
Risk Management
Regardless of how compelling a technical setup may appear, the most decisive factor in trading remains risk management. Defining risk in advance ensures that losses are limited if the market behaves unexpectedly. In this case, placing the stop at 4,702 not only keeps risk under control but also aligns with a minor resistance level, making the trade plan technically coherent.
Position sizing also plays a crucial role. The availability of Micro Ether Futures (MET) allows traders to participate with significantly reduced capital requirements compared to the full-sized ETH contract. This flexibility makes it easier to fine-tune exposure and manage account risk more precisely.
Equally important is the discipline of adhering to precise entries and exits. Chasing a trade or ignoring pre-defined stop levels can erode the edge provided by technical analysis. Markets often deliver multiple opportunities, but without sound risk management, traders may not survive long enough to benefit from them. Ultimately, capital preservation is the foundation on which consistent performance is built.
Closing
Ether’s spectacular rally since April 2025 is a reminder of the asset’s ability to deliver explosive moves under the right conditions. Yet history shows that parabolic advances rarely continue uninterrupted. The combination of a Rising Wedge breakdown and a confirmed RSI divergence provides strong evidence that the current uptrend is losing momentum, and the market may be entering a corrective phase.
For traders, this is less about predicting the future and more about recognizing when probabilities align in favor of a defined setup. With clear entry, target, and stop levels, the ETH and MET contracts offer a structured opportunity for those willing to take a bearish stance while managing their risk appropriately.
When charting futures, the data provided could be delayed. Traders working with the ticker symbols discussed in this idea may prefer to use CME Group real-time data plan on TradingView: www.tradingview.com - This consideration is particularly important for shorter-term traders, whereas it may be less critical for those focused on longer-term trading strategies.
General Disclaimer:
The trade ideas presented herein are solely for illustrative purposes forming a part of a case study intended to demonstrate key principles in risk management within the context of the specific market scenarios discussed. These ideas are not to be interpreted as investment recommendations or financial advice. They do not endorse or promote any specific trading strategies, financial products, or services. The information provided is based on data believed to be reliable; however, its accuracy or completeness cannot be guaranteed. Trading in financial markets involves risks, including the potential loss of principal. Each individual should conduct their own research and consult with professional financial advisors before making any investment decisions. The author or publisher of this content bears no responsibility for any actions taken based on the information provided or for any resultant financial or other losses.
U.S. Long Bonds: Bearish engulfing sets the toneSitting in an established downtrend and having just printed a bearish engulfing candle to end August, downside risks for U.S. long bonds look to be skewing lower. Throw in momentum indicators which are generating a mildly bearish signal and support at 116’06 may soon come under threat.
UB futures have bounced from this level the last four times it’s been tested, including earlier Monday in thin, holiday-impacted trade. However, if the price were to break and close beneath 116’06, especially the low of 116’00 set on August 27, it may spark a deeper unwind towards 115’16, a level the price has done plenty of work either side of over recent months.
A sustained push beneath 116’06 would allow for shorts to be established on the break with a stop above the level for protection, targeting either 115’16 or the July 16 swing low of 113’20.
From a fundamental perspective, questions regarding Fed independence have combined with evidence of accelerating inflationary pressures to steepen the U.S. Treasury curve over the past fortnight, with shorter-dated yields declining while longer-dated yields, such as for 30-year bonds, push higher.
With markets pricing in around 100bp of rate cuts from the Fed until June next year, incoming economic data will have to justify the need for additional monetary policy support; otherwise, it risks placing further pressure on long bond futures.
Good luck!
DS

ETH 1H Analysis – Key Triggers Ahead | Day 8💀 Hey , how's it going ? Come over here — Satoshi got something for you !
⏰ We’re analyzing ETH on the 4-hour timeframe timeframe .
🔭 On the 1-hour timeframe of Ethereum, we can see that after a correction, Ethereum was supported at the $4263 area and moved upward. It had a resistance at the $4341 level which, after breaking and completing a pullback, pushed towards its next higher resistance. Currently, it is in a 1-hour or 15-minute multi-timeframe range, and with a breakout from this pattern, it can give us a trade opportunity.
⛏ Key RSI levels are at 70 and 55. If the fluctuation limit crosses these numbers, Ethereum can have significant volatility and start a new trend.
💰 The volume and number of green candles have increased, and their size also looks bigger. This can be a sign of Ethereum’s bias, showing that buyers are more willing to spend money compared to sellers. The volume and number of red candles have decreased, and they don’t create much selling pressure, although the market is currently in a holiday period.
🪙🪙 On the 1-hour ETHBTC timeframe, after breaking out of its box, Ethereum moved upward and also had a pullback to this box. Now there is resistance at the 0.04145 area, and with a breakout of this level, Ethereum can continue moving upward.
🔔 The alert zones considered for Ethereum are $4433, which is at the bottom of this range as the short alert zone, and $4490, which is at the top of this range as the long alert zone. With a breakout and confirmation above these levels, Ethereum can start its move in the new week. Note that this pattern has strong price action significance, and Ethereum’s monthly candle will also close tonight.
❤️ Disclaimer : This analysis is purely based on my personal opinion and I only trade if the stated triggers are activated .
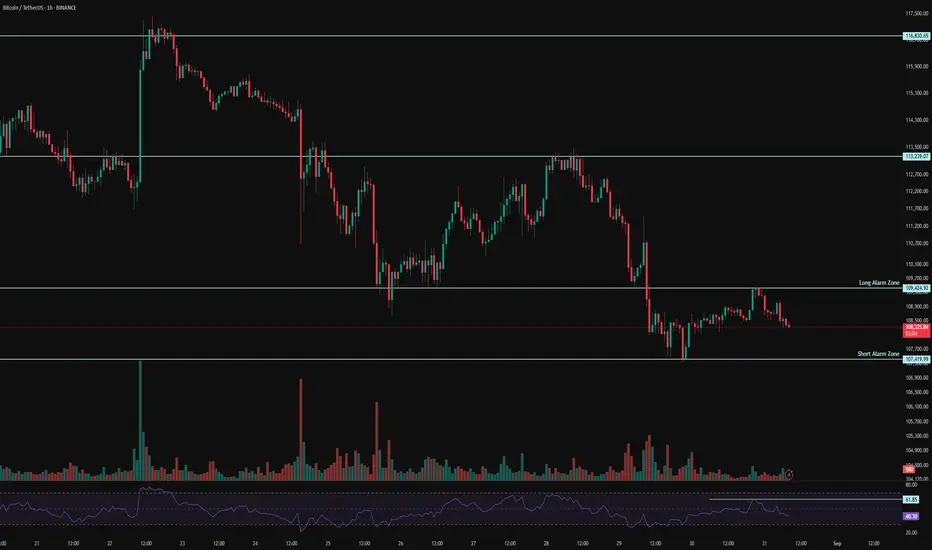
BTC 1H Analysis – Key Triggers Ahead | Day 28💀 Hey , how's it going ? Come over here — Satoshi got something for you !
⏰ We’re analyzing BTC on the 1-hour timeframe timeframe .
👀 With the breakout of this one-hour box, Bitcoin can give us either a long or short position. Keep in mind that the market is currently in the holidays and volume is decreasing. The start of the new week can be interesting for Bitcoin.
⚙️ A key RSI zone exists at 62, and with the swing limit breaking this number, Bitcoin can move upward again. The next key RSI zone is 30, which is the oversold boundary for Bitcoin.
🕯 Bitcoin’s volume has sharply decreased as we are in the holidays. The size and volume of red candles are increasing each time, but still micro buyers are present, leaving good reversal candles from supports. With increasing volume, Bitcoin can start a good trend in the new week.
📊 1H timeframe USDTDominance We observe that this dominance, upon hitting its ceiling at 4.56%, was rejected and moved down toward its support at 4.46%. Then it bounced from this area and hit the key resistance at 4.49%. With the breakout of this one-hour dominance box in either direction, good volume can flow into Bitcoin.
🔔 The alarm zone for Bitcoin is the ceiling and floor of this one-hour box, which has high price action value.
❤️ Disclaimer : This analysis is purely based on my personal opinion and I only trade if the stated triggers are activated .
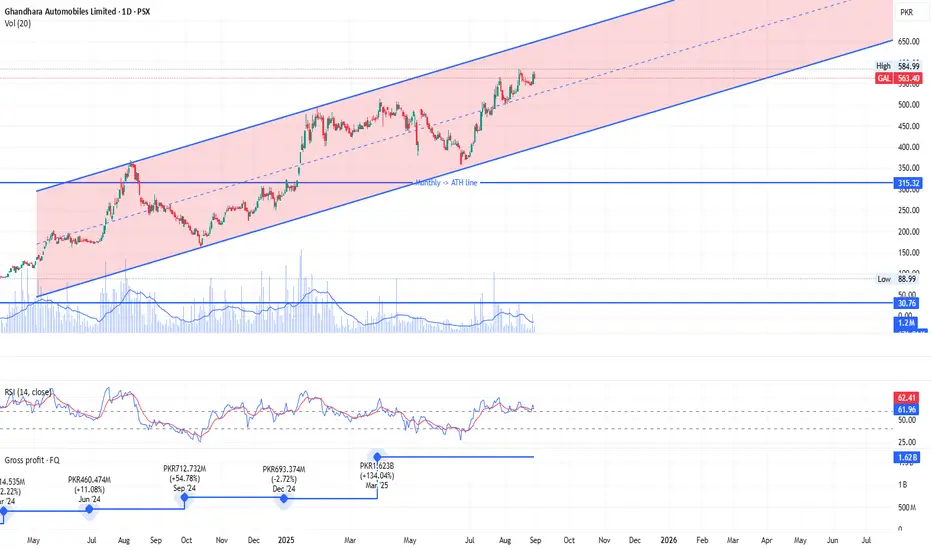
PSX: GAL - Daily TFGAL daily timeframe, moving in a channel
Great fundamentals turnaround - Sales of JAC T-9 Hunter.
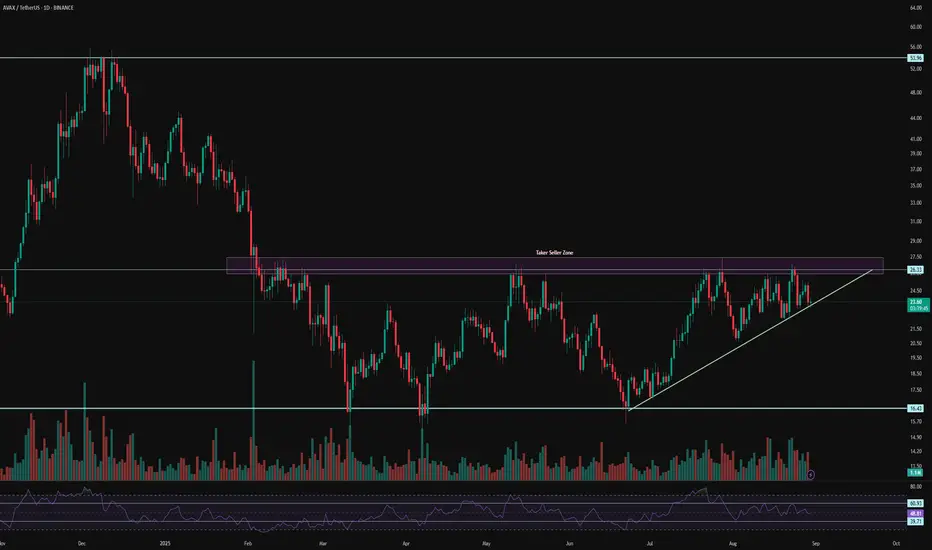
AVAX 1D Analysis – Key Triggers Ahead💀 Hey , how's it going ? Come over here — Satoshi got something for you !
⏰ We’re analyzing AVAX on the 1-Day timeframe timeframe.
👀 In the daily timeframe of AVAX, after the drop it experienced, AVAX entered a box with a long-term range. The ceiling and floor of this box are in the area of $16 and $26. The time range of this box or its length is almost 170 days. At the ceiling of this box, there are strong seller tickers that get their sell orders activated every time the price reaches this area. To break this zone and for a good rise of AVAX, we need a very strong and high-volume momentum that causes a price jump and fills the sell orders.
💰 In the daily timeframe of AVAXBTC we can see a relatively good compression formed in this area, and with the breakout of the Bitcoin ceiling, more Bitcoin will be converted into AVAX and it can be a good confirmation for a long position and some spot buying. The area considered for the alarm zone is 0.0002286.
⚙️ Two key areas for RSI have been considered. Passing the swing limits of 61 and 40 can bring good volatility to AVAX and help it break out of this RSI compression that is seen as a box.
🕯 The area considered as the seller ticker is a strong one, and every time the price reached this area, we faced selling pressure. The size of the green candles is also larger compared to the red candles, and each time the compression area became smaller and the price is ready for a breakout and reaction (not today but next week).
🔔 The area we considered as the alarm zone for AVAX is $26, and with the breakout of this area, AVAX can move towards higher price levels. Price behavior at $26 can give us complete awareness for trading.
❤️ Disclaimer : This analysis is purely based on my personal opinion and I only trade if the stated triggers are activated .
ETH 4H Analysis – Key Triggers Ahead | Day 7💀 Hey , how's it going ? Come over here — Satoshi got something for you !
⏰ We’re analyzing ETH on the 4-hour timeframe timeframe .
🔭 In the 4-hour timeframe of Ethereum, we can see that after registering its all-time high, Ethereum was rejected downwards and then took support from the $4,273 area and moved upwards. We need to see how valid this support can remain in the new week. There is also an important resistance at the $4,515 area, and breaking this level could end Ethereum’s corrective trend.
⛏ The key RSI areas are 35 and 58. If the fluctuation passes these levels, Ethereum could enter a new phase of volatility and eventually start its movement.
💰 The size and number of red candles have almost decreased, and with increasing volume and larger candle sizes, Ethereum can start a good trend. Keep in mind that today is a holiday, so not much volume enters the market. On the other hand, there are rumors on Twitter about the death of Donald Trump, which could also prevent an increase in volume.
🪙 In the 4-hour timeframe of the ETHBTC index , we can see that this index broke its box at the 0.03946 area and registered an all-time high for Ethereum against Tether pair. Then it was rejected from this area and showed two rebound reactions at the 0.03946 support, which is the broken box top. With a breakout of the highlighted areas in this index analysis, both Bitcoin and Ethereum could see more liquidity, and this directly affects the ETH/USDT pair.
🔔 The alarm zones that can be considered for Ethereum in this timeframe are the $4,273 and $4,514 areas. The price action in these areas can be of high value, and with increasing volume, they could give us either a short or long trade opportunity.
❤️ Disclaimer : This analysis is purely based on my personal opinion and I only trade if the stated triggers are activated .

PUMP | #4h #long — Watching for Breakout Confirmation Early signals for a reversal, but not rushing in.
Some clear bullish divergence on the 4h RSI — first positive sign after an extended downtrend. Price can pop from here, but my plan is to wait for a break and hold above the 4h Order Block + MSS zone (red box) before taking any long entry.
Confirmation is key — I only want to get involved if we reclaim this area with momentum.
Scenario:
If we get a strong breakout and close above the red OB + MSS zone, that’s the first entry trigger for a potential trend reversal.
Until then — standing aside, letting the setup prove itself.
Reasoning:
Bullish RSI divergence often marks the beginning of a reversal, but without a structural breakout, the move can easily fail.
Patience pays off in these high-risk, low-liquidity coins.

JUPUSDT Bulls Are In Trouble?Yello Paradisers, did you see how JUPUSDT broke down from its ascending channel right at the crucial 4H resistance zone? That move alone has already triggered warning signals, and now with a bearish CHoCH confirmed together with bearish divergence on both the MACD histogram and RSI, the probability of further downside has increased significantly.
💎 At this stage, aggressive traders could already be looking for short opportunities from the current price action, with a potential reward-to-risk ratio of more than 1:1.5. Conservative traders, however, should ideally wait for a clean retest of the broken resistance zone. A bearish candlestick pattern forming there would provide stronger confirmation before pulling the trigger.
💎 Since we are heading into month-end, a possible liquidity sweep cannot be ruled out. That is why scaling in with smaller position sizes makes more sense here to avoid unnecessary exposure.
💎 Still, discipline is key. If the price manages to break and close back above the invalidation level, this entire bearish setup would be invalidated. In that case, staying out would be the only smart move.
🎖Strive for consistency, not quick profits. Treat the market as a businessman, not as a gambler.
MyCryptoParadise
iFeel the success🌴

one of the applications of RSIRSI as an indicator can be used in several ways ,
RSI is almost mirror image of the price ,
if we convert a candle stick chart into a line chart ,
and we hide which is RSI plotting and which is price plotting ,
it is difficult to identify which one is which...
But there are times where RSI due to it formula creates
divergence and confluences with prices, and there are
many articles and tutorials to explain those aspects of RSI
Motive of this article :
To see RSI as tool for range bound trading , and shape our next trade ideas using this
possibility .
After working with RSI extensively , all what I can say is RSI can be treated
almost similar with all the treatments which we can have over the price chart ,
for example : we can apply head & shoulders / cup&handle etc ... concept(s) on rsi ditto same as we do on price chart. so decoding RSI isn't just limited to divergences ...
One of such use-cases which I have been using about RSI is in range-bound trading,
if we can have a price range or a parallel channel , you can observe that either price
goes side-ways or gets reversed as per the RSI in the respective timeframe ...
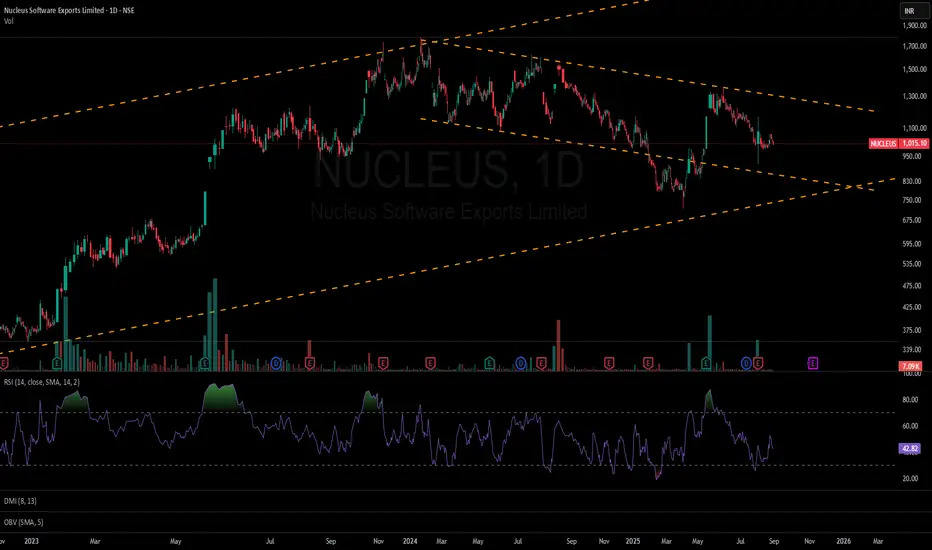
here we are taking two channels ( a channel within a channel )
1w candles , and 1D candles .. and you can see RSI going from 30 to 70 to 30 to 70 ,
all alongwith the boundaries of the price range in either 1w or 1d channels ...
Just two images and it is clearly visible what we are discussing here ,
1w candles : see the candles having a range of channel and rsi also behaving in same way between 70-30 levels :
1d candles : see the candles having a range of channel and rsi also behaving in same way between 70-30 levels :
So the whole logic over here is , if in case we can make out a range bound behaviour ,
or a price range in channels , then we can align our next trade idea in accordance
with the RSI behaviour i.e.
if it is around 70 levels in 1D timeframe , then we can try to observe if there is any chart pattern or price action which is showing a sell side trade ...
and if it is around 30 levels in 1D timeframe , then we can try to observe if there a buy side trade based on price action / or chart patterns . . .
same goes with 1W candles ....
( I am not focussing on 1M because it becomes very much slow process and we always have lots of scrips to trade with on D and W basis .. so omitting it for M candles ... but i am much much sure this can work with M candles as well ... )
Now one of the aspect is to check whether there is an alignment of RSI on both timeframes D & W , if both time frames are having rsi around 30 , and the prices are range bound in both timeframes ... we can have a much much high conviction on buy-side or the trade ....
And at last please note three things about RSI which i have observed and discovered
while talking with lots of fellow trades ....
1) RSI follows CLOSE prices , and not the wicks ( high and low ) so while detecting divergences consider the close price and now the high or low ..
2) RSI hitting 70 is not an assurance of prices reversing , it can either reverse or just go side-ways .... RSI at any level 70 or 30 is not an guarantee of " Price reversal "
3) RSI can remain above 70 for a much much time period than usual expectation, and RSI can remain below 30 for much much time ... there are index charts which shows this ...
Bonus point : read some where from a veteran of the market , prices can remain irrational for a longer period of time , just make sure you remain solvent till then ...
happy investing and joyful trading wishes to all
#BCHBTC #1W (Binance) Big falling wedge breakoutCRYPTOCAP:BCH just regained 50MA weekly support in sats, performing better than CRYPTOCAP:BTC
Seems likely to continue bullish towards 200MA resistance, probably after a pull-back.
⚡️⚡️ #BCH/BTC ⚡️⚡️
Exchanges: Binance
Signal Type: Regular (Long)
Amount: 7.0%
Current Price:
0.004885
Entry Targets:
1) 0.004657
Take-Profit Targets:
1) 0.006329
Stop Targets:
1) 0.003987
Published By: @Zblaba
CRYPTOCAP:BCH BINANCE:BCHBTC #BitcoinCash #PoW bitcoincash.org
Risk/Reward= 1:2.5
Expected Profit= +35.9%
Possible Loss= -14.4%
Estimated Gaintime= 4-7 months

#BTCEUR #1D (Binance) Bull-flag breakout and retestBitcoin looks very good for bullish continuation after regaining 50MA support on daily, against the Euro.
⚡️⚡️ #BTC/EUR ⚡️⚡️
Exchanges: Binance
Signal Type: Regular (Long)
Amount: 12.0%
Entry Targets:
1) 93017.86
Take-Profit Targets:
1) 108422.28
Stop Targets:
1) 85296.36
Published By: @Zblaba
CRYPTOCAP:BTC BINANCE:BTCEUR #Bitcoin #PoW bitcoin.org
Risk/Reward= 1:2.0
Expected Profit= +16.6%
Possible Loss= -8.3%
Estimated Gaintime= 1-2 months

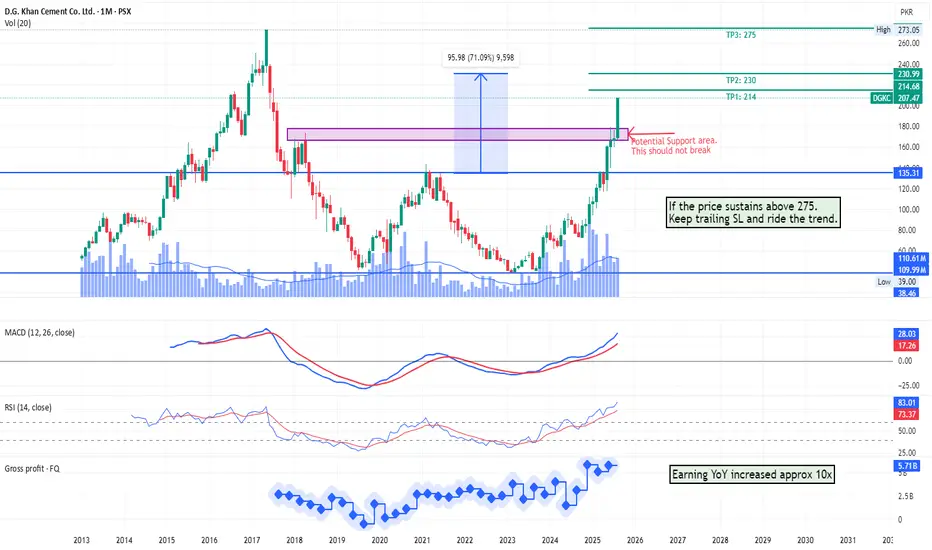
PSX: DGKC - Monthly TF Long positionPSX: DGKC - Monthly time frame analysis
Promising fundamentals with possible three projected prices
ETH 1H Analysis – Key Triggers Ahead | Day 6💀 Hey , how's it going ? Come over here — Satoshi got something for you !
⏰ We’re analyzing ETH on the 1-hour timeframe timeframe .
🔭 On the 1H timeframe for Ethereum, we can observe that ETH broke its midline to the downside and moved toward the bottom of the box. With the slightly higher-than-expected U.S. inflation news, Ethereum bounced again from the bottom of its box, and now we need to see whether it can consolidate above the midline or not.
⛏ The key RSI levels are at 50 and 30, and once the oscillation surpasses these thresholds, Ethereum can begin its main move.
💰 The volume and number of red candles increased after the midline break, accompanied by selling pressure. The volume and size of Ethereum’s reversal candles can show us the strength of the rebound and the strength of the box bottom, since the bottom has not been lost yet.
📊 On the 1H ETHBTC chart, we can observe that if the bottom of the 1H box at 0.03972 is lost, more Ethereum will be sold and converted into Bitcoin. This index reflects the relative value between ETH and BTC. Breaking this marked level could serve as a confirmation for a short trade on Ethereum.
💡 The Ethereum alert zones remain the same as before, with the difference that for an early trigger we can consider a break and consolidation above the midline, which is relatively risky.
❤️ Disclaimer : This analysis is purely based on my personal opinion and I only trade if the stated triggers are activated .

BTC 1H Analysis – Key Triggers Ahead | Day 26💀 Hey , how's it going ? Come over here — Satoshi got something for you !
⏰ We’re analyzing BTC on the 1-hour timeframe timeframe .
👀 On the 1H timeframe for Bitcoin, we can observe that BTC was rejected from the alert zone we had previously marked and moved downward. With this rejection, the selling volume and the size of red candles increased slightly. Currently, Bitcoin is sitting at its alert zone, and we need to see whether it will find support here or lose this support and go into a deeper correction.
⚙️ The key RSI levels are 30 and 70. Once the oscillation surpasses these levels, Bitcoin can start its main move and give us a position.
🕯 The size and volume of red candles have increased considerably, and selling pressure is being applied more easily each time. The green reversal candles are smaller compared to the red ones, and sellers’ tickers are consistently pushing the price downward with less resistance.
💵📊 On the 1H Tether Dominance chart ,we can see that Tether Dominance has reacted four times to this resistance zone, and right now we are at the top of Tether Dominance and the bottom of Bitcoin. If Tether Dominance gets rejected from this area, Bitcoin could find support and move upward. However, if this zone is broken with strong whale candles, heavy selling pressure could flow into Bitcoin. Keep in mind that this is a major resistance zone for Tether Dominance and will not be broken easily.
🪙📊 On the 1H Bitcoin Dominance chart ,we observe that at the same time Bitcoin prints green reversal candles and Tether Dominance shows red rejection candles, Bitcoin Dominance itself is forming a green structure. This means Bitcoin’s weight in the market is increasing. Now we need to see whether the market maker supports Bitcoin or not.
🔔 The Bitcoin alert zones are still the same as yesterday. If price reacts with a breakout confirmation, trading setups could form. Keep in mind that it’s the weekend, so avoid taking unusual or overly risky trades.
❤️ Disclaimer : This analysis is purely based on my personal opinion and I only trade if the stated triggers are activated .
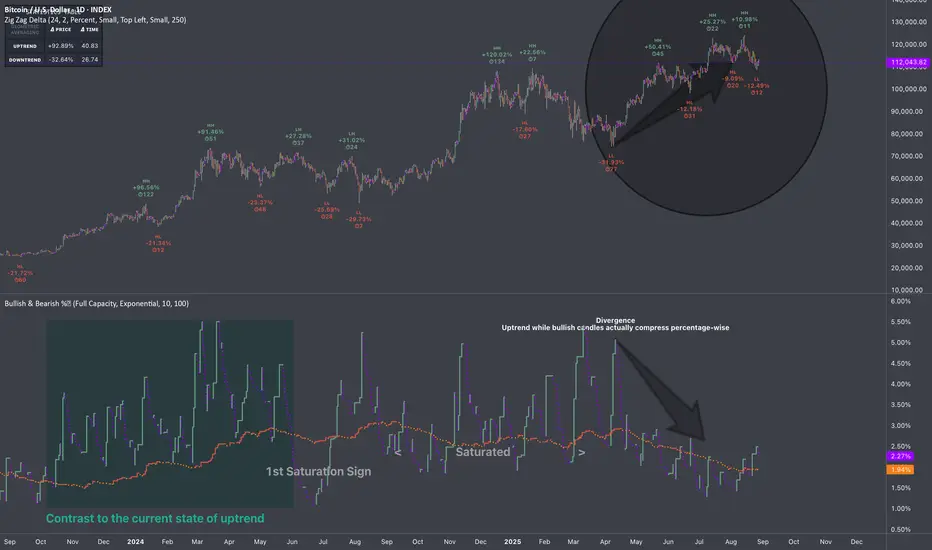
Asymmetric Conditional Averaging⚖️ Research Notes
Documenting other features of "Average Bullish & Bearish Percentage Change" indicator where Bar Metrics is set to Full Capacity.
Asymmetric Conditional Averaging
For a quick example, I'll leave bulls at default 10 and change number of past bearish candles to 100.
Since the indicator targets candles by classification which is divided by the previous price (to work out the change) before averaging, that makes the data scalable. (So no matter how high we increase the averaging number, it still will preserve the scaling laws of that historic range that comes with output)
When opposite market force is averaged at higher number of past candles, it becomes a threshold, giving a unique perspective when comparing phases of uptrend at bigger scales.
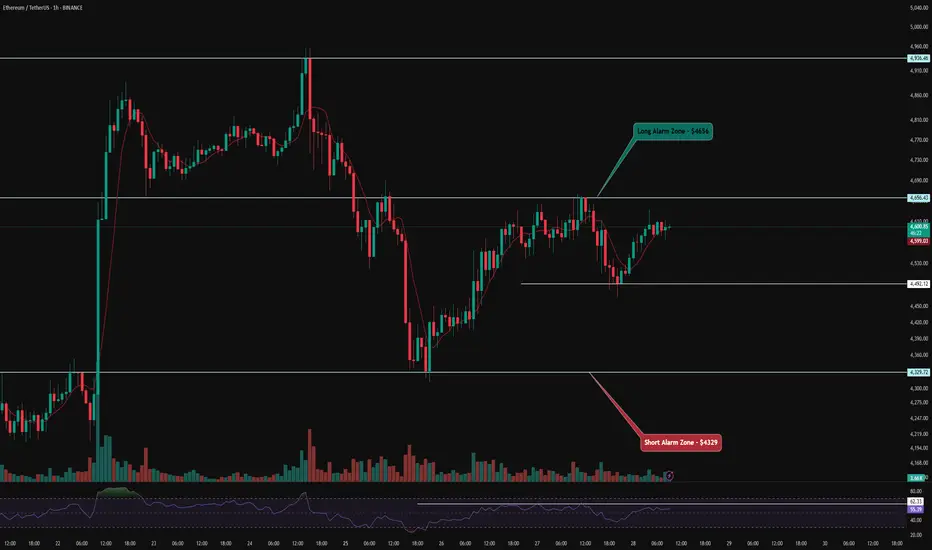
ETH 1H Analysis – Key Triggers Ahead | Day 5💀 Hey , how's it going ? Come over here — Satoshi got something for you !
⏰ We’re analyzing ETH on the 1-hour timeframe timeframe .
🔭 On the 1H timeframe for Ethereum, we can observe that ETH is moving inside a 1-hour range box, which has also formed with a V-pattern structure. A breakout and consolidation above or below this box can provide us with either a long or short trade setup.
⛏ The key RSI level is around 62, where Ethereum has been ranging for almost 2 days below this level with support around the 50 zone. Once the oscillation surpasses these levels, Ethereum can start its next move.
💰 The volume and number of green and red candles are almost equal. However, with larger green candles and rising volume, we can say that Ethereum is holding a good amount of accumulation volume.
📊 On the 1H timeframe of ETHBTC , we can observe that the alert zone for confirming a long position in Ethereum has slightly shifted lower, now sitting around 0.0415. Breaking this zone could allow Ethereum to move toward higher resistance levels and potentially even register a new all-time high.
💡 Looking at Ethereum’s alert zones, the level for a long position is around $4556, while the level for a short position is around $4329. With a breakout and consolidation above or below these areas, Ethereum gives us trade opportunities. Monitoring price behavior in these zones can be of great help in decision-making.
❤️ Disclaimer : This analysis is purely based on my personal opinion and I only trade if the stated triggers are activated .
DAX: 50DMA break puts downside levels in playThe Germany 40 contract is trading through the 50-day simple moving average, a level that’s been tested frequently over the past month but never closed below until Wednesday. Should the price be unable to reclaim the level, a short setup may be in order.
While some may be prepared to establish shorts beneath the 50DMA with a tight stop above for protection, the preference would be to see the price push meaningfully below 24000 given how many times it bounced from beneath the level when trading above the 50DMA over the past month.
Bids may be found at 23800 and again at 23620, the latter coinciding with the uptrend running from the June swing low. Ultimately, however, 23400 screens as a more appealing target given it’s where the price bounced strongly from earlier this month.
Of course, if the price were to reverse back above the 50DMA and close there, the setup could be flipped with longs established above and a stop beneath for protection. The downtrend from the record highs set on July 10 sits just beneath 24400 today, making that a potential target. 24530 is another, coinciding with where the price stalled on four separate occasions since July 23.
RSI (14) is trending lower and now sits beneath 50, providing a slightly bearish signal. However, it’s yet to be confirmed by MACD, which remains in positive territory despite crossing over from above earlier this week. The overall momentum signal is therefore neutral, placing more emphasis on price action to guide trading decisions.
Good luck!
DS

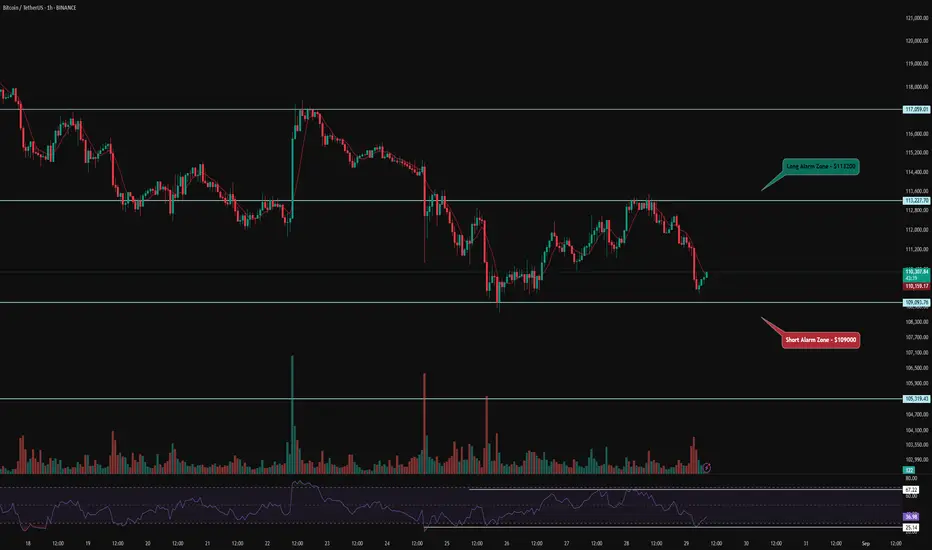
BTC 1H Analysis – Key Triggers Ahead | Day 24💀 Hey , how's it going ? Come over here — Satoshi got something for you !
⏰ We’re analyzing BTC on the 1-hour timeframe timeframe .
👀 On the 1-hour Bitcoin chart, BTC is in a box and has formed a V-pattern. Breaking the box's ceiling would trigger the V-pattern breakout. The breakout trigger for Bitcoin is at $112,200.
⚙️ Key RSI levels are 64 and 46. When oscillation crosses 64, Bitcoin’s momentum heads toward overbought.
🕯 Volume, size, and number of green candles have increased, with buyer makers present. There was an attempt to break resistance with higher volume, but seller takers pushed the price back. Buyer makers then guided the price up from a higher low. Breaking resistance needs more volume.
💵 On the 1-hour USDT.D chart, Tether dominance is at 4.35%. Breaking this could bring significant trading volume to Bitcoin.
🔔 Bitcoin’s trading alarm zone is at $112,200, where price action could be highly reliable. No specific short position idea, but if $110,000 breaks with heavy selling, I might open a position.
❤️ Disclaimer : This analysis is purely based on my personal opinion and I only trade if the stated triggers are activated .
