ELLIOTT WAVE XAUUSD H4 update
EW Trade Set Up H4
monitoring the end of subminuette wave ii
subminuette wave ii is going to end in a double zigzag.
Waiting for an accumulation in the price range 3250/3315 before subminuette iii starts.
daily key levels (area)
3315
3275 POC
3250
Oscillators

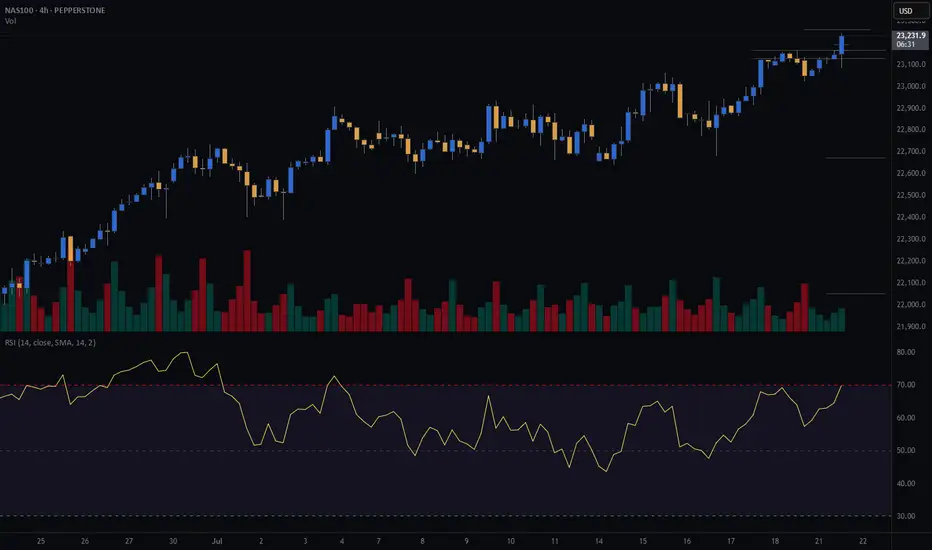
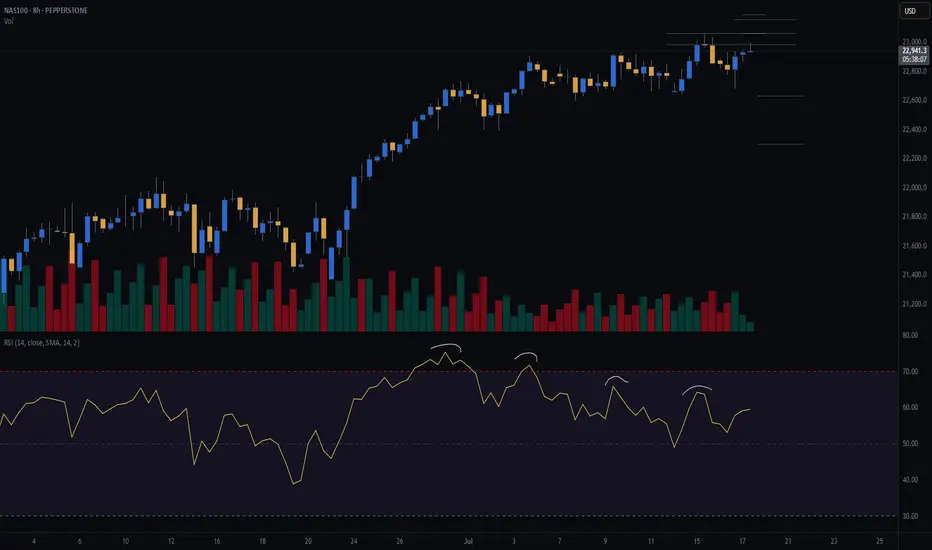
NASDAQ (CASH100) SHORT - Double TOP H4Risk/reward = 11.3
Entry price = 23 190
Stop loss price = 23 270.4
Take profit level 1 (50%) = 22 674
Take profit level 2 (50%) = 22 053
All variables met, and entered the trade.
What is everyone's thoughts on shorting or longing cash100?
BTCUSD - BEARISH DIVERGENCE DETECTEDCAPITALCOM:BTCUSD
BTCUSD has been in a bullish trend over the past few hours and is now approaching the resistance at 119,500.00.
On the hourly chart, a bearish hammer has formed alongside a stochastic divergence, signaling potential downside.
⚡ This signal is reinforced by a strong resistance level above, adding weight to a possible pullback scenario.
📉 If BTCUSD rebounds from this level, consider Sell setups with take profit at the nearest support.
📈 If it breaks out, look for Buy opportunities on confirmation.
⚡ We use Stoch (14) to spot potential reversals when it exits overbought or oversold zones — helping you catch clear, confident entries.

Bitcoin monthly RSI CYCLEEvery time Bitcoin peaked in previous cycles, its monthly RSI exceeded 90. In this cycle, the RSI hasn't surpassed 75, but I expect a breakout through 75 to at least 86 in the coming months.

3-Year Euro Uptrend — An Absurdity Amid a Weak EconomyCMCMARKETS:EURUSD
The euro is climbing, hitting its highest levels since late 2021 near $1.18. This surge is driven by diverging central bank policies—with the ECB holding rates steady while the Fed leans dovish—amid global tensions that push gold higher and rattle markets, weakening the dollar even though the eurozone economy remains fragile.
📉 1️⃣ Dollar Weakness Takes Center Stage
Since its January 2025 peak, the U.S. Dollar Index (DXY) has fallen by over 11% 📉—one of its worst starts in decades, comparable to the slumps of 1986 and 1989. As inflation cools, markets are betting on Fed rate cuts, pulling U.S. Treasury yields lower. Coupled with monetary policy divergence and tariff drama, the dollar’s usual safe-haven appeal is fading, even amid ongoing geopolitical tensions.
📊 2️⃣ Fed–ECB Policy Divergence
While the ECB has signaled the possibility of one or two cuts this year, markets are pricing in a milder path. By contrast, the Fed is tilting dovish, with swaps markets expecting a rate cut in September and another by December 🗓️. This widening yield differential supports EUR/USD, even though eurozone growth remains soft.
⚖️ 3️⃣ Trump Tariff Risks and Sentiment Shift
Uncertainty around U.S. trade policy—especially the threat of renewed tariffs—has weighed more heavily on USD sentiment than on eurozone currencies. Markets view these tariffs as inflationary and damaging to U.S. growth prospects. Speculative positioning data confirms record bearish sentiment on the dollar, with funds underweight USD for the first time in 20 years 💼.
💶 4️⃣ Eurozone’s Fiscal Shift
Germany has begun spending and borrowing, marking a dramatic pivot from years of fiscal restraint. This has raised hopes for an investment-driven recovery across the eurozone. Meanwhile, ECB President Christine Lagarde is avoiding signaling aggressive cuts, stabilizing market expectations and maintaining a sense of monetary calm—for now 🛡️.
🛡️ 5️⃣ Safe-Haven Flows Shifting
Traditionally, geopolitical stress boosts the USD as a safe haven. This cycle is different: investors are increasingly turning to gold, the Swiss franc, and the yen as defensive assets, indirectly supporting the euro. In April, when Trump delayed tariff plans, safe-haven USD flows unwound further, fueling euro gains 💰.
⚠️ Risks Ahead for EUR/USD:
💔 Weak Eurozone Fundamentals:
The eurozone economy is not booming. The IMF projects just 0.9% growth for 2025, with Germany, France, and Italy struggling to regain momentum. The ECB’s Financial Stability Review flags worsening credit conditions, weak private investment, and deteriorating balance sheets, none of which support sustained euro appreciation 📉.
🚢 A Strong Euro Hurts Exports:
Eurozone exporters in machinery, chemicals, and autos are already facing squeezed margins from rising input costs and global protectionism. A stronger euro makes exports less competitive, shrinking the eurozone’s current account surplus, which dropped sharply from €50.9 billion in March to €19.8 billion in April, according to the ECB 📊.
⚡ Political Risks Looming:
Fragile coalitions in Germany, budget battles in France, and rising anti-EU sentiment in Italy and the Netherlands could swiftly unwind euro gains if tensions escalate. Should the ECB turn dovish to support a weakening labor market, the euro’s rally could reverse quickly 🗳️.
📈 7️⃣ Technical Picture: Overextension Warning
In addition to the macro drivers, EUR/USD is now technically overextended. The pair has already retraced exactly 78.6% of its major bearish trend that started in January 2021 and ended in September of that year. Ahead lies a strong resistance zone at 1.18000–1.20000, which will be difficult to break without a significant catalyst.
Notably, the daily chart shows bearish RSI divergence, indicating fading momentum beneath the surface of this rally. A pullback toward the 1.13000 level would not be surprising, even as near-term momentum remains strong. This technical setup calls for caution while the pair tests these critical levels.
📈 Technical Outlook: EUR/USD Showing Signs of Overextension
Beyond macroeconomic factors, EUR/USD is currently technically overextended. The pair has retraced exactly 78.6% of its major bearish trend that began in January 2021 and concluded in September the same year. It is now approaching the upper boundary of a 3-year ascending channel, facing a significant resistance zone between 1.18000 and 1.20000—a hurdle unlikely to be crossed without a strong catalyst.
Additionally, the weekly chart reveals a bearish RSI divergence, signaling that underlying momentum is weakening despite the recent rally. Given this, a pullback toward the 1.13000 level is plausible, even as short-term momentum remains robust. This technical setup advises caution as the pair navigates these critical resistance levels.

Australia 200: Pullback Presents Second Chance for LongsThe Australia 200 contract continues to trade above former horizontal resistance at 8627, with Monday’s pullback offering an improved entry level for longs looking to buy the breakout.
Bullish positions could be established ahead of 8627, with a stop beneath for protection. The session high of 8727 looms as an initial test for longs, with a push above that level opening the door for further upside.
While some like to use extension targets, the preference would be to wait for a clear topping pattern before exiting the trade. Others may prefer to adopt a target based on the desired risk–reward of the trade.
Bullish price momentum is showing signs of picking up again, favouring a similar bias. Iron ore futures are also flying in Asia, likely assisting gains across the underlying materials sector.
Good luck!
DS

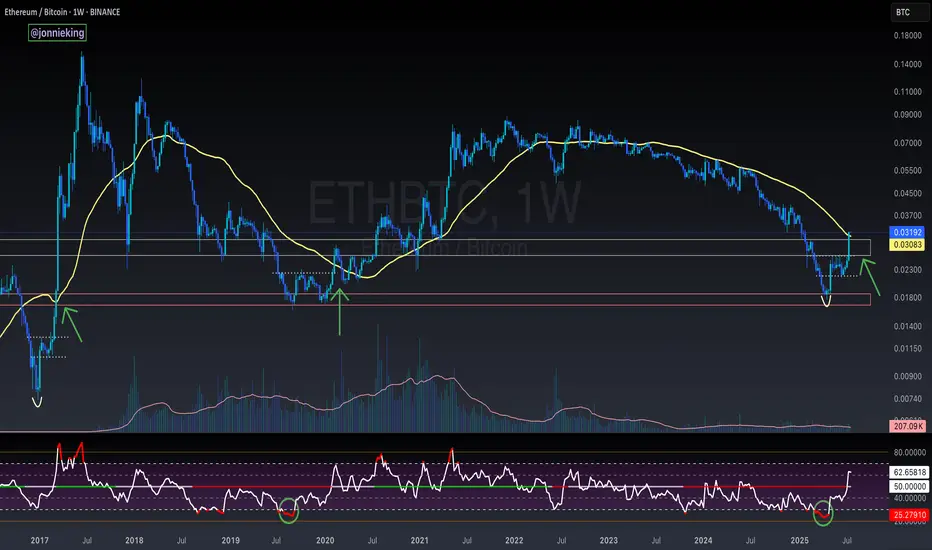
$ETH Closes Above the 50WMA - Alt Season Signal ALT SEASON ALERT 🚨
CRYPTOCAP:ETH Closed the Week ABOVE the 50WMA
Historically this has signaled the start of ALT SEASON.
*NOTE* 2020 had the pandemic hiccup.
This bottoming pattern looks very similar to the 2017 explosion.
Also the RSI matches the 2019 bottom.
Dare I call it yet bros? 🤓
**BTC/USDT Monthly Analysis: Navigating Key Resistance****Overview:**
On the monthly timeframe, Bitcoin (BTC) is exhibiting significant strength as it approaches a pivotal historical resistance zone. This multi-year resistance, ranging approximately from **$115,000 to $120,000**, represents a critical inflection point for the asset.
**Key Observations:**
1. **Historical Resistance Test:** The current price action sees BTC challenging a formidable resistance level that has previously acted as a major ceiling. A decisive breakout above this zone, supported by strong volume, would signal a continuation of the bullish trend towards new all-time highs.
2. **RSI Bearish Divergence:** A notable observation on the Monthly Relative Strength Index (RSI) is the presence of **bearish divergence**. While price has made higher highs, the RSI has printed lower highs, indicating a potential weakening in bullish momentum. This divergence suggests that the current upward move might be losing steam and could precede a healthy price correction or consolidation phase. This is a crucial cautionary signal for long-term holders and potential new entrants.
**Outlook:**
The bullish macro trend for Bitcoin remains intact, yet the confluence of strong historical resistance and a developing bearish divergence on the monthly RSI warrants caution. Traders should closely monitor for a clear break and sustained close above the $120,000 level to confirm further upside. Conversely, a rejection from this resistance zone could lead to a significant retracement to key support levels.
**Disclaimer:** This analysis is for informational purposes only and does not constitute financial advice. Always conduct your own research and manage your risk appropriately.
**M. Kiani**
```ش

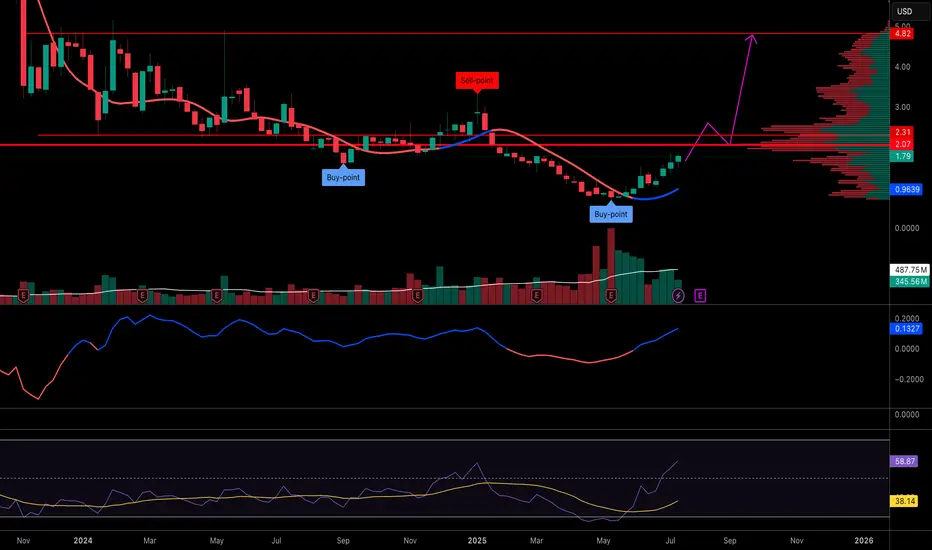
$PLUG long waiting for price to reclaim the base supportAfter base support i'll long after confirmation and change of character, the rsi on weely has crossed the eq and all indicators confirm a reversal and uptrend.
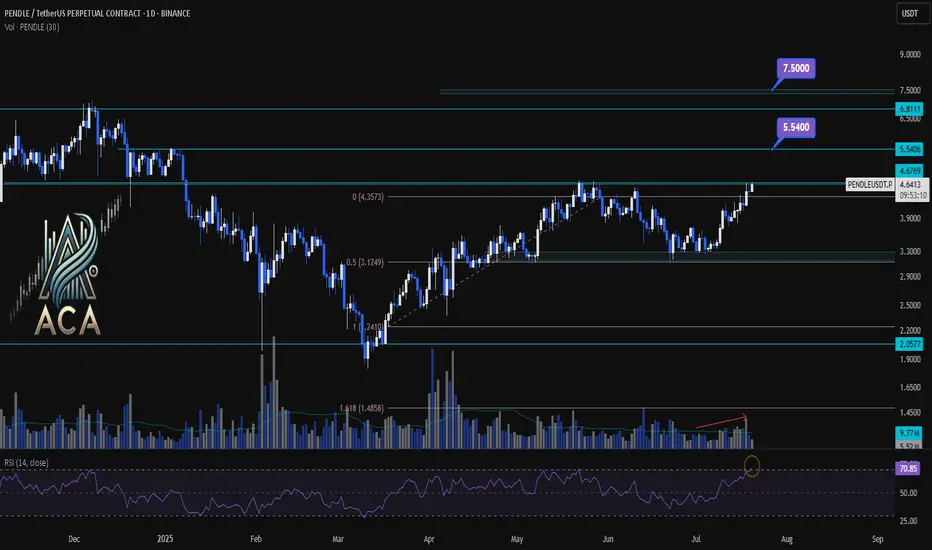
PENDLEUSDT 1D Chart Analysis|Bullish Breakout Eyes Higher TargetPENDLEUSDT 1D Chart Analysis | Bullish Breakout Eyes Higher Targets
🔍 Let’s break down the PENDLE/USDT daily chart, focusing on breakouts above key resistance, Fibonacci retracement dynamics, RSI momentum, and volume confirmation for a comprehensive bullish setup.
⏳ Daily Overview
PENDLE has staged a powerful recovery after pulling back to the 0.5 Fibonacci retracement level (around $3.12). Price is now testing the critical $4.68 resistance—the ceiling from the last corrective wave. RSI has jumped above 71, entering the overbought zone, a classic precursor to strong momentum moves. Volume is rising as bulls attempt a breakout, confirming participation behind the price action.
📈 Technical Convergence and Trend Structure
- Fibonacci Structure: The correction held the 0.5 retracement, a textbook bullish reversal zone in rising trends.
- Resistance Breakout: Price is challenging the $4.68 resistance. A daily close above, especially with high volume, would confirm the breakout and trigger bullish continuation.
- RSI Indicator: RSI has cleared the 70 mark, reinforcing strong momentum. Overbought RSI often supports further rallies when backed by breakout moves and rising volume.
- Volume Confirmation: Volume surged as PENDLE reclaimed lost ground and is now accelerating into the resistance test, suggesting trend conviction and confirming the move.
🔺 Bullish Setup & Targets
- First target: $5.54 — the next resistance based on historical supply and Fibonacci extension.
- If macro conditions like interest rate cuts align, the next potential target: $7.50 — the major extension target where price discovery is likely.
- Key trigger: A strong daily (or weekly) close above $4.68, combined with breakout volume, is likely to ignite the next leg up.
📊 Key Highlights
- Correction held at the 0.5 Fibo, signaling trend health and resetting momentum.
- A bullish daily structure aligned with a weekly breakout confluence.
- RSI and price action both making new local highs — strong uptrend indication.
- Volume confirming the move—a real breakout is underway, not a false start.
🚨 Conclusion
PENDLE/USDT looks primed for continuation higher. The blend of a successful 0.5 retracement retest, breakout attempt above $4.68, robust RSI, and volume surge all point to bullish follow-through. Watch for a confirmed close above resistance as the catalyst for further upside, with $5.54 and $7.50 the next logical targets if momentum persists.
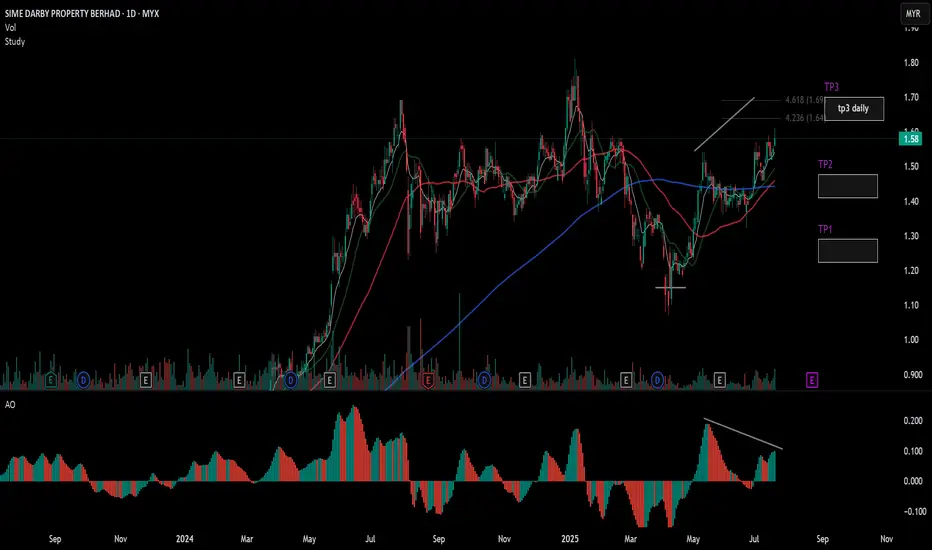
SIMEPROP... cooking going to tp3 dailySimeprop ... make move goint to tp3 daily
but be caution have divergence ..
TAYOR
"These 3 power signals boost the 3-step rocket booster strategy"Am lubosi forex and i would like to welcome you.This is where i share with you technical analysis strategies.
I started trading in 2017 and learning about it has not been easy.My hope for you is that this channel will shape your trading journey and help you
Find a path to making money on your own terms.
In this video am showing you the rocket booster strategy
using 3 indicators and catalysts as follows:
1-Volume Oscillator
2-MACD Indicator
3-Earnings Report Catalyst
These 3 power signals boost
the 3-step rocket booster strategy
Watch this video
to learn more
Disclaimer:Trading is risky please use a simulation trading account before you trade with real money
also learn risk management and profit taking strategies.

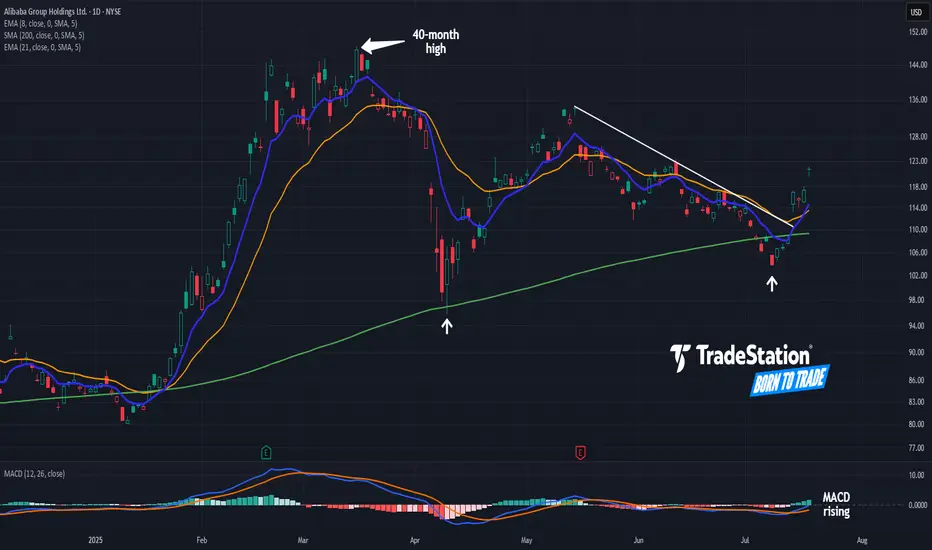
Alibaba Breaks a TrendlineAlibaba began 2025 with a big rally. Now, after a long pullback, some traders may see further upside in the Chinese tech giant.
The first pattern on today’s chart is the pair of higher lows (marked with white arrows) along the rising 200-day simple moving average. Those may reflect the development of a longer-term uptrend.
Second, BABA peaked above $148 in March. It was the highest price since November 2021. That may suggest a long-term downtrend is fading.
Third is the series of lower highs in May and June. The stock broke that falling trendline this week, a potential sign of improving price action in the short term.
Next, MACD is rising and the 8-day exponential moving average is nearing a potential cross above the 21-day EMA. Those could be viewed as further positive short-term signals.
Finally, BABA is an active underlier in the options market. (Volumes have averaged more than 200,000 contracts per session in the last month, according to TradeStation data.) That may help traders take positions with calls and puts.
TradeStation has, for decades, advanced the trading industry, providing access to stocks, options and futures. If you're born to trade, we could be for you. See our Overview for more.
Past performance, whether actual or indicated by historical tests of strategies, is no guarantee of future performance or success. There is a possibility that you may sustain a loss equal to or greater than your entire investment regardless of which asset class you trade (equities, options or futures); therefore, you should not invest or risk money that you cannot afford to lose. Online trading is not suitable for all investors. View the document titled Characteristics and Risks of Standardized Options at www.TradeStation.com . Before trading any asset class, customers must read the relevant risk disclosure statements on www.TradeStation.com . System access and trade placement and execution may be delayed or fail due to market volatility and volume, quote delays, system and software errors, Internet traffic, outages and other factors.
Securities and futures trading is offered to self-directed customers by TradeStation Securities, Inc., a broker-dealer registered with the Securities and Exchange Commission and a futures commission merchant licensed with the Commodity Futures Trading Commission). TradeStation Securities is a member of the Financial Industry Regulatory Authority, the National Futures Association, and a number of exchanges.
Options trading is not suitable for all investors. Your TradeStation Securities’ account application to trade options will be considered and approved or disapproved based on all relevant factors, including your trading experience. See www.TradeStation.com . Visit www.TradeStation.com for full details on the costs and fees associated with options.
Margin trading involves risks, and it is important that you fully understand those risks before trading on margin. The Margin Disclosure Statement outlines many of those risks, including that you can lose more funds than you deposit in your margin account; your brokerage firm can force the sale of securities in your account; your brokerage firm can sell your securities without contacting you; and you are not entitled to an extension of time on a margin call. Review the Margin Disclosure Statement at www.TradeStation.com .
TradeStation Securities, Inc. and TradeStation Technologies, Inc. are each wholly owned subsidiaries of TradeStation Group, Inc., both operating, and providing products and services, under the TradeStation brand and trademark. When applying for, or purchasing, accounts, subscriptions, products and services, it is important that you know which company you will be dealing with. Visit www.TradeStation.com for further important information explaining what this means.
NAS100 (CASH100) SHORT - head and shoulders 30minRisk/reward = 3.9
Entry price = 23 137.9
Stop loss price = 23 153.9
Take profit level 1 (50%) = 23 071
Take profit level 2 (50%) = 23 060
Still need to validate a few variables.
Lets goooooo

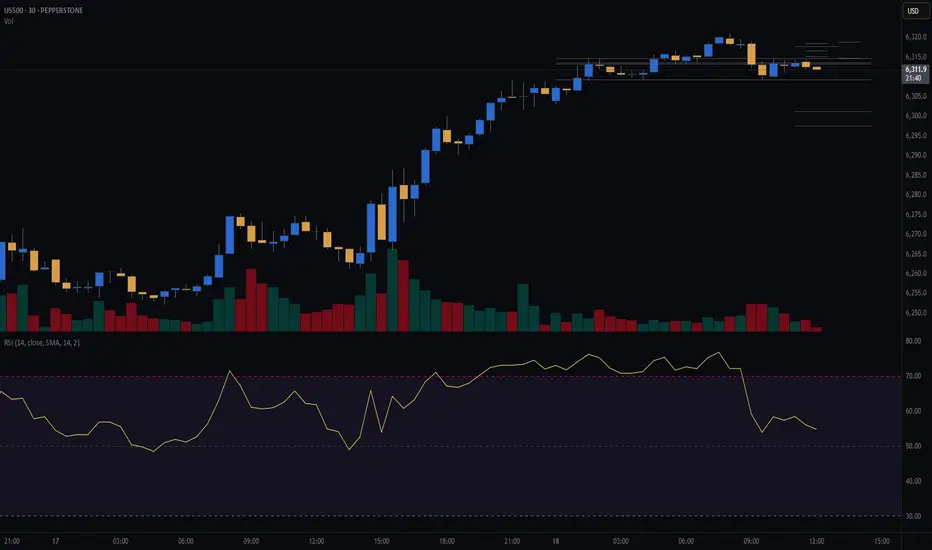
S&P500 (CASH500) (SPX500) SHORT - Head and shoulders 30minRisk/reward = 3.3
Entry price = 6314.8
Stop loss price = 6318.4
Take profit level 1 (50%) = 6301.3
Take profit level 2 (50%) = 6297.5
Waiting on validation from a few other variables.
For example, waiting for the current 30min candle to close in range.
Letssss goooooo
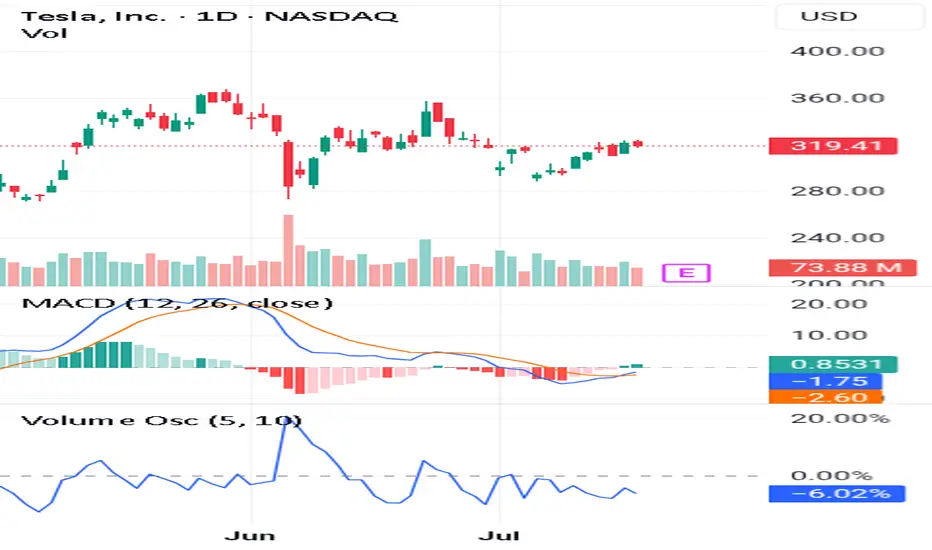
(Learn More)Use These 3 Steps To Spot Long-Lasting Trends👉Trade before the earnings report
👉Make sure the volume oscillator is below zero
👉Make sure the MACD lines give you a Bullish signal
If you look at this chart you can see all the steps alignment.
This is very important because you want to catch a long term trend.
Also it has to follow the 3step rocket booster strategy.
In order for you to learn more about this strategy 🚀 Rocket Boost This Content.
Disclaimer ⚠️ Trading is risky please learn how to use Risk Management And Profit Taking Strategies. Also feel free to use a simulation trading account before you use real money.
Dow Eyes 45000 After Bullish BreakoutThe U.S. 30 contract has broken topside from a short-term bull flag, reinforcing the broader uptrend and putting 45000 resistance back in focus.
Traders looking to play a continuation can consider longs with a tight stop beneath for protection. A break of 45000 may trigger a fresh burst of upside momentum, putting big figures above in play.
Bullish price momentum is also building again, adding to the case for upside.
Good luck!
DS

UK100 short - head and shoulders H4Risk/ reward = 4.6
Entry = 8 998.5
Stop loss = 9 034.2
Take profit level 1 = 8 859.8
Take profit level 2 = 8 794
Still need confirmation,
Waiting for H4 candle to close at 23.00 and will need to validate volume.

NAS100 (CASH100) SHORT - Double Top H8Risk/reward = 4.6
Entry price = 23 063
Stop loss price = 23 190
Take profit level 1 (50%) = 22 635
Take profit level 2 (50%) = 22 303
Still waiting for confirmation on some variables.
For example, need H8 candle to close in range and volume to validate, amongst other variables.
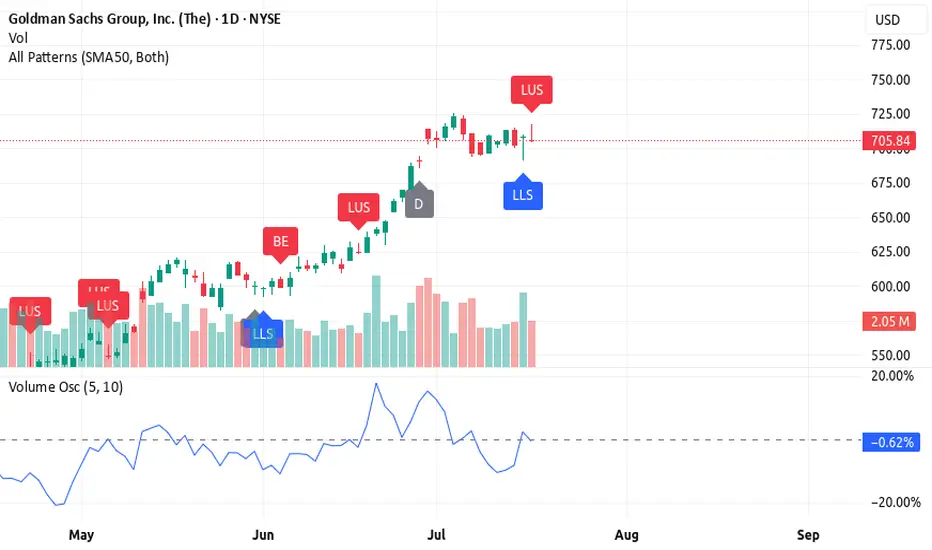
3 Reasons Why Goldman Sachs (GS) Still Looks Bullish🚀 3 Reasons Why Goldman Sachs (GS) Still Looks Bullish (Despite a Bearish Candle)
Goldman Sachs is in a bullish trend, but the latest candlestick is flashing a warning. Here's why GS still looks strong — and what to watch for next 📈
1️⃣ Candlestick pattern – long upper shadow
The long upper shadow shows sellers pushed the price down from the highs, signaling resistance. While bearish short-term, it often happens during strong trends as the market breathes before pushing higher.
2️⃣ High volume on a bearish candle
The negative volume shows resistance, but it may actually represent bear exhaustion. High volume without a breakdown
suggests bears tried to push it down — and failed. Classic fake-out.
3️⃣ Volume oscillator still rising
Despite the pullback candle, the volume oscillator is holding above zero and trending up, showing momentum is still on the bulls' side.
🔥 Rocket Booster Strategy still intact
✅ Price above 50 EMA
✅ Price above 200 EMA
⚠️ Just a temporary shakeout? If the next candle confirms support, GS may continue the bullish push.
⚠️ Disclaimer: Always use a simulation (demo) account before trading with real money. Learn proper risk management and profit-taking strategies to protect your capital.
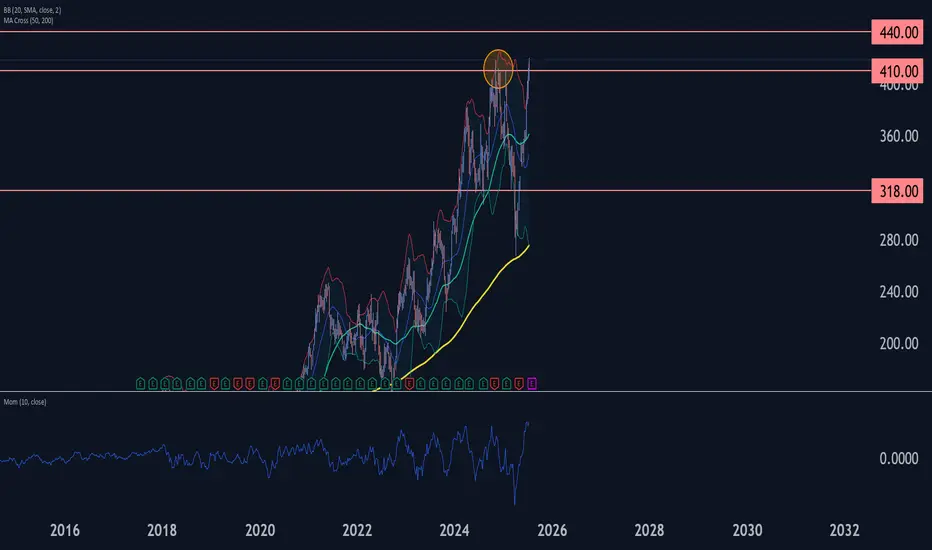
Caterpillar Wave Analysis – 17 July 2025
- Caterpillar broke long-term resistance level 410.00
- Likely to rise to resistance level 440.00
Caterpillar recently broke above the major long-term resistance level 410.00, which has been reversing the price from the end of 2024, as can be seen from the weekly Caterpillar chart below.
The breakout of the resistance level 410.00 accelerated the active intermediate impulse wave (C) from the middle of 2025.
Given the overriding weekly uptrend and the accelerating weekly Momentum, Caterpillar can be expected to rise to the next resistance level 440.00 (target for the completion of the active intermediate impulse wave (C)).
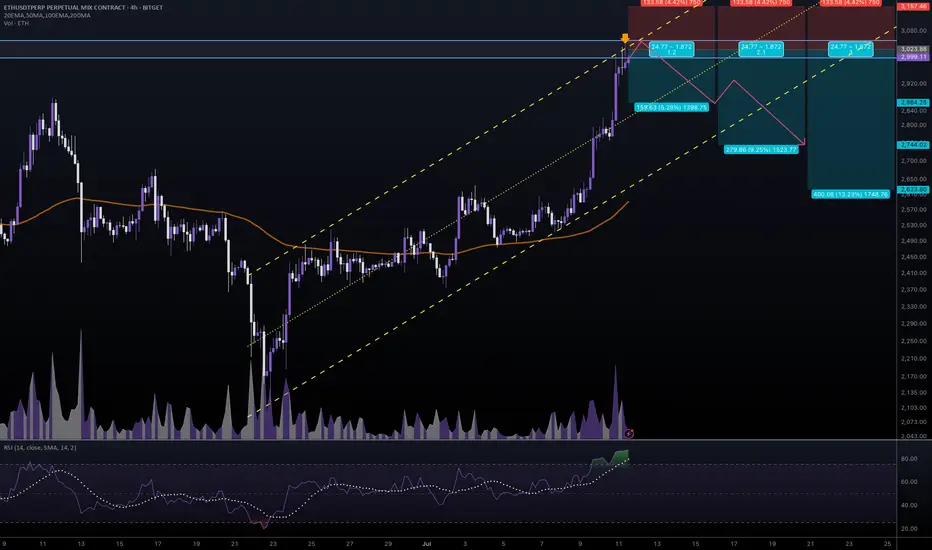
#ETHUSDT #4h (Bitget Futures) Ascending channel on resistanceEthereum printed a gravestone doji followed by a shooting star, RSI is overbought, local top seems in.
⚡️⚡️ #ETH/USDT ⚡️⚡️
Exchanges: Bitget Futures
Signal Type: Regular (Short)
Leverage: Isolated (9.0X)
Amount: 5.0%
Entry Zone:
2996.99 - 3050.49
Take-Profit Targets:
1) 2864.25
2) 2744.02
3) 2623.80
Stop Targets:
1) 3157.46
Published By: @Zblaba
CRYPTOCAP:ETH BITGET:ETHUSDT.P #4h #Ethereum #PoS ethereum.org
Risk/Reward= 1:1.2 | 1:2.1 | 1:3.0
Expected Profit= +47.5% | +83.3% | +119.0%
Possible Loss= -39.8%
Estimated Gaintime= 1-2 weeks
Short WISE as leading diagonal has been completedWISE can be shorted with the first target at the lower edge of the diagonal and then, at around 800 pence (start of wave 5), if move lower confirmed.
Clear RSI divergence shows trend reversal in the short-term at least (until touching lower band of the diagonal). So the lowest upside is around 14-16% here.
SL can be set to 1230 pence.
