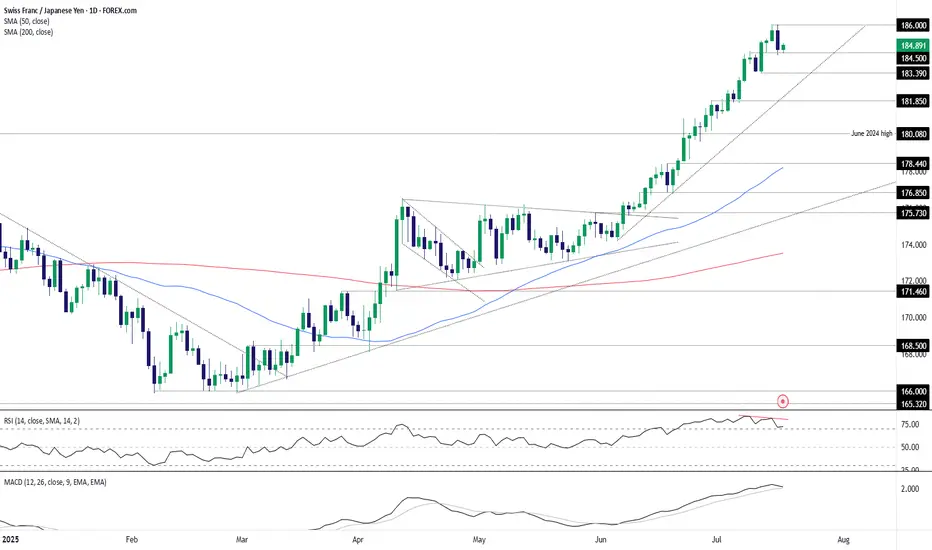
CHF/JPY Reversal brewing?Is the high-flying CHF/JPY cross about to hit an air pocket? Having printed a bearish engulfing candle on Wednesday, and with bearish divergence between RSI (14) and price while still in overbought territory, the risk of a pullback appears to be growing. MACD is also curling over towards the signal line, hinting that bullish momentum is waning.
Should the price break and hold beneath 184.50, shorts could be established with a tight stop above the level for protection. 183.39 screens as an initial target, coinciding with the low struck on July 11. If it gives way, it could open the door to a deeper unwind towards 181.85, a level that acted as both support and resistance in recent months.
If the price resumes its uptrend and takes out the current record high above 186.00, it would invalidate the near-term bearish bias.
Good luck!
DS
Oscillators
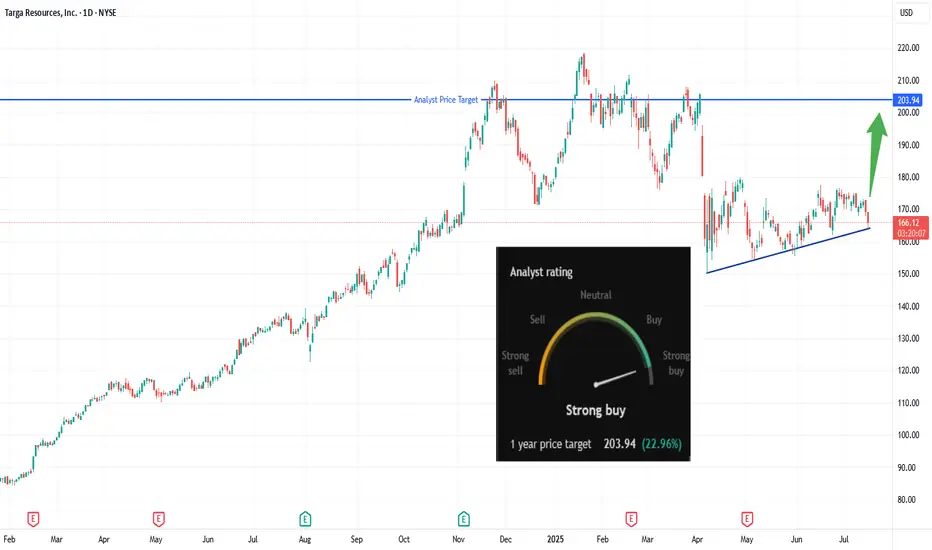
Breakout Brewing: Is TRGP About to Explode?🔹 Trade Summary
Setup:
Ascending triangle forming over several months
Price consolidating near major resistance
Strong analyst buy rating with 1-year target at $203.94
Entry:
Buy on daily close above $169.42 (breakout trigger)
Stop-loss:
Below $159 (invalidate the setup)
Targets:
$203.94 (analyst target / recent highs)
Risk/Reward:
Approx. 1:3.5 (risking ~$10 for ~$34 gain)
🔹 Technical Rationale
🔹 Ascending triangle pattern suggests bullish continuation
🔹 Flat resistance at $169.42 now being challenged
🔹 Daily timeframe, recent higher lows showing building pressure
🔹 Catalysts & Context
🚦 Analyst “Strong Buy” rating with 1-year upside potential of +22.96%
🛢️ Energy sector momentum, especially in midstream & LNG plays
📰 Potential earnings/corporate updates could drive breakout
🔹 Trade Management Plan
Entry: Buy only on daily close above $169.42
Stop-loss: Below $159 — trail up if price closes above $180
Scaling: Take partial profits at $185, remainder at $203.94 (target)
What’s your view? Are you watching NYSE:TRGP ? Comment below or vote:
🔼 Bullish
🔽 Bearish
🔄 Waiting for confirmation
🔹 Disclaimer
Not financial advice. Trade at your own risk.
*** Don't forget to follow us for more trade setups ***
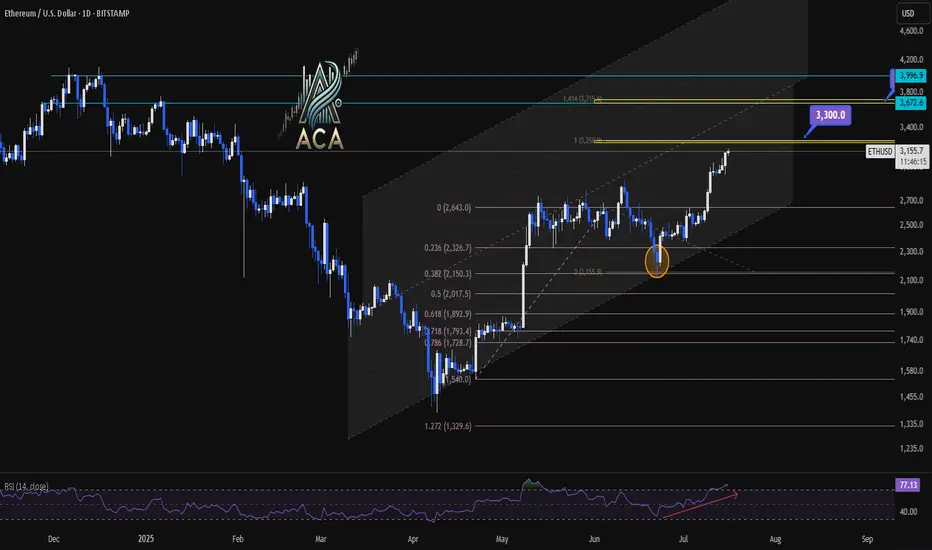
ETHUSDT 1D Chart Analysis | RSI Strength & Fibonacci TargetsETHUSDT 4H Chart Analysis | RSI Strength & Fibonacci Targets in Play
🔍 Let’s break down the latest ETH/USDT setup — bullish momentum is building with confluences pointing toward key upside targets.
⏳ 4-Hour Overview
Ether continues climbing within a well-defined ascending channel, with recent candles holding above mid-level support. Price is pressing higher from a clean bounce at the 0.5 and 0.618 Fibonacci retracement zone ($2,017–$1,899), signaling the correction has likely ended.
📉 Fibonacci Levels & RSI Confirmation
- The strong recovery aligns with rising volume and a bullish structure.
- RSI is pushing into overbought territory (above 73), often a sign of strength during trends—not exhaustion.
- ETH is now positioned for a breakout continuation move if momentum holds.
🎯 Bullish Targets Ahead
- Immediate resistance: $3,300 (1.414 Fib extension + historical supply)
- Next major target: $3,700 (1.618 extension + upper channel confluence)
- Pullback zones: $2,950 (mid-channel) and $2,017 (Fib support base)
📊 Key Highlights:
- Price is respecting the rising channel structure — higher lows, higher highs in play.
- Volume supports the breakout narrative, rising on green candles.
- RSI breakout supports trend continuation, not exhaustion.
- Targets at $3,300 and $3,700 remain actionable on a confirmed breakout.
🚨 Conclusion:
ETH is showing a multi-variable bullish setup with clear continuation potential. A strong move above $3,300 could quickly send price toward $3,700. Pullbacks to $2,950–$2,017 could offer high-risk/reward re-entry zones. Momentum favors bulls — stay alert.
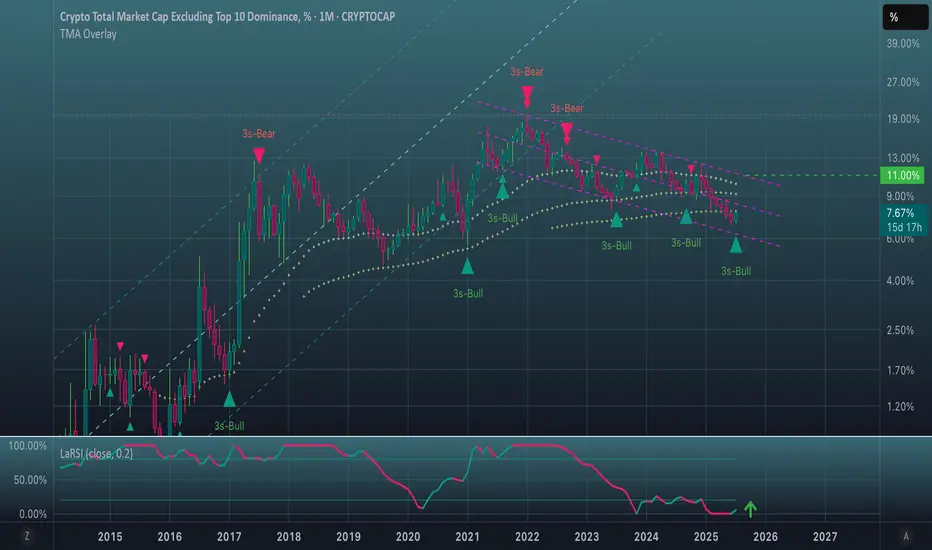
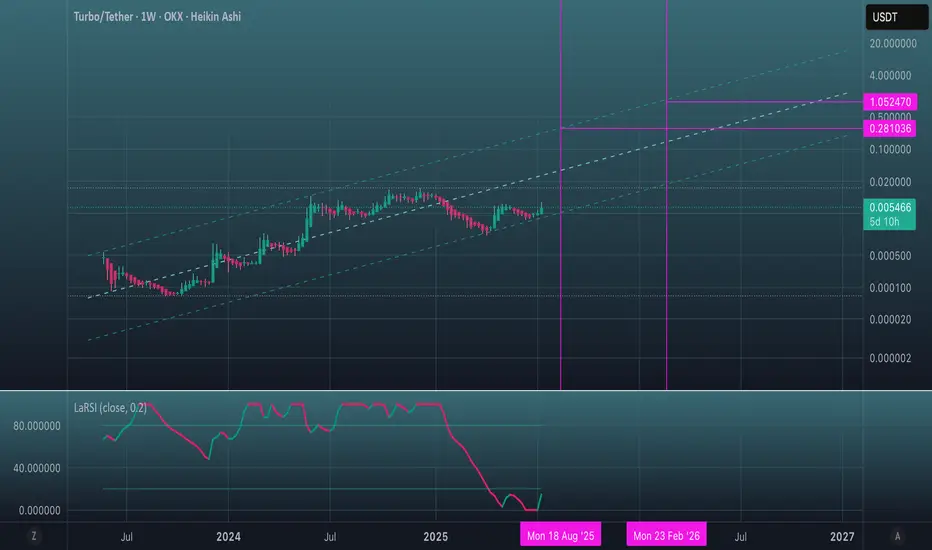
It's high time to make the header optional.Maybe there's a good chance.
OK, LaRSI on the monthly chart shows that the share of alts could rise significantly.
But there is a bullish correlation with bullish sentiment in the stock market.
However, the candle has gone below the 100 SMMA for the first time.
But at the same time a bullish momentum is forming at this point.
I suggest waiting for the end of the month.
*******************************************************************
But real strength can only be demonstrated
if the candles break out of this channel. Where they are now.
The 10.7%-11% level will be critical.
As usual, no need to call anyone on anything.
Trends Report#1:Learn How To See Bullish Chart Patterns It's been a wild week.As I am strategy building.
So far I have about 3 solid trading strategies.
Then I have two more pending to learn more.
My dream as a man has always been to learn how to make money.
Staying in the financial markets because I went to college to study information and technology.
In my academic studies there was nothing close to what I learned on trading.
Financial technology software development is what I have decided to study as an academic pursue.
The education system is broken.
Look at this chart.
☝️The price is above the 50 EMA
☝️The price is above the 200 EMA
☝️The price has reversed on a Bullish Harami Candlestick pattern .
This reversal is confirmed by both the positive volume + volume oscillating tool.
To learn more 🚀 Boost This Content
Disclaimer ⚠️ Trading is risky please learn Risk Management And Profit Taking Strategies.Also feel free to use a simulation trading account before you use real money.

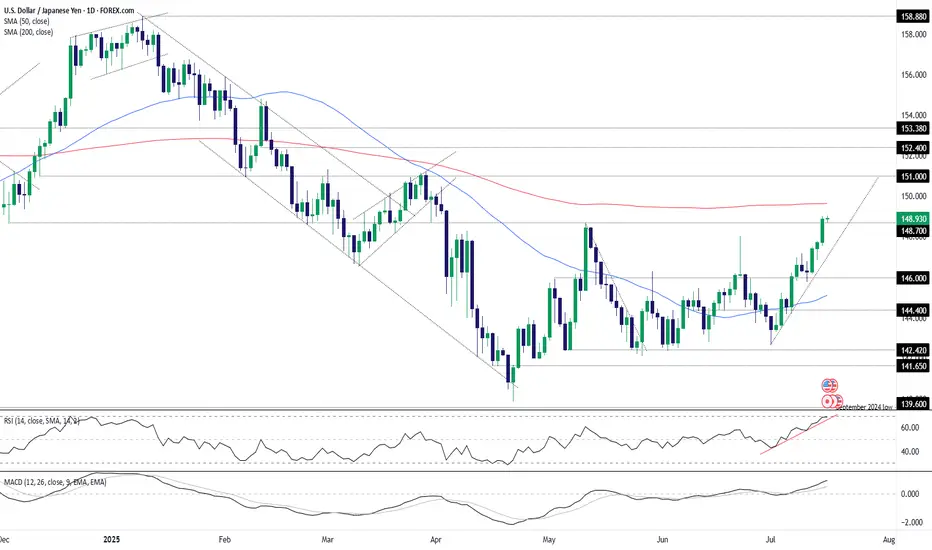
USD/JPY: 148.70 cleared as yields and momentum alignAided by the latest leg higher for U.S. Treasury yields following the June U.S. inflation report, USD/JPY closed at the highest level since April on Tuesday, taking out the important 148.70 level in the process. If the pair manages to consolidate the break on Wednesday ahead of separate U.S. PPI data for June, the level may revert to offering support, providing a platform for new long positions to be established with a stop below for protection.
The 200-day moving average is the first major hurdle for bulls to overcome, sitting today at 149.63. If it were to be taken out, it would only add to the bullish price action seen recently. Above, 150 will naturally receive some attention given it’s a major big figure, although there’s little visible resistance until 151.00.
If USD/JPY were to reverse back below 148.70 and close there, it would provide bulls with some food for thought, opening the door for a potential retest of the uptrend the pair has been sitting in since the start of July. However, the message from momentum indicators like RSI (14) and MACD is firmly bullish. With the 50-day moving average also starting to curl higher, near-term price momentum is definitely with the bulls, favouring buying dips in this environment.
SOL / ETH at Critical Inflection PointSOL / ETH loses the 50WMA.
Has been trading below it for the past 7 weeks, something we haven't seen since 2021.
Has also broken down from the 8 month bull flag / parallel channel. Retesting the key POI I've been eyeing.
HOPIUM: We've seen great rallies after CRYPTOCAP:SOL goes down ~40% vs CRYPTOCAP:ETH , which it is at now. We SHOULD see a turnaround here soon.
And I still believe SOL will greatly outperform ETH this cycle, especially when the ETF launches and Alt Season kickstarts.
Right now we're seeing a typical market cycle BTC > ETH > Large Caps > Mid Caps > Micro Caps

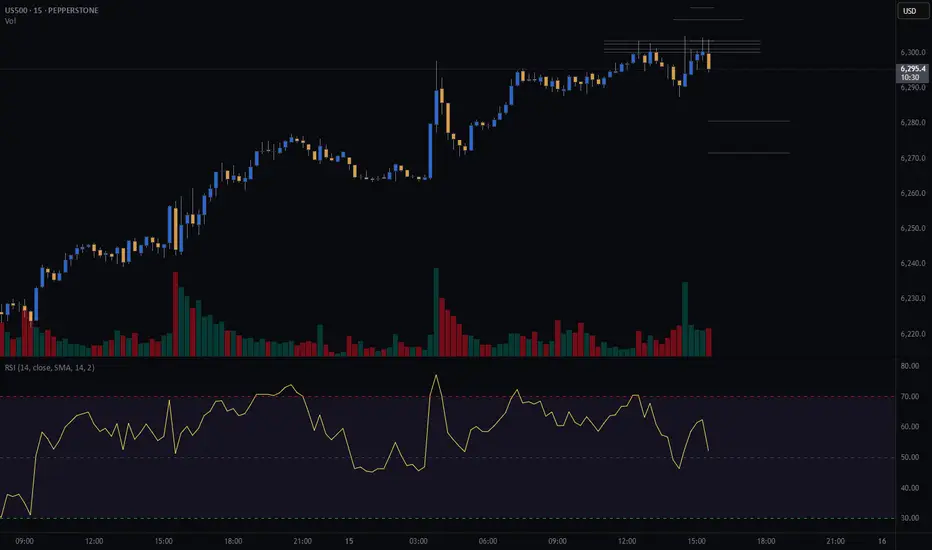
S&P500 (CASh500) Short - double top 15minEntry = 6303.4
SL = 6312.8
Take profit level 1 = 6280.7
Take profit level 2 = 6271.6
Just a couple of lines.Depending on what waves of liquidity will be pumped from bitcoin to slagcoins,
many things are possible. Faster? Lower price.
Slower? More accumulation, stronger level protection.
LaRSI may be preparing to storm the 20 line on the weekly chart.
Positive.
You may agree or disagree, at your discretion.
SMCI: The Monthly Chart says it ALL
Stochastic is way oversold.
MACD is converging.
RSI is converging back up.
Would not be surprised to see this soar back towards the CRT value of $65, then take on new challenges back towards it previous ATH of $122.90 in March, 2024.
Regards,
Terrapins

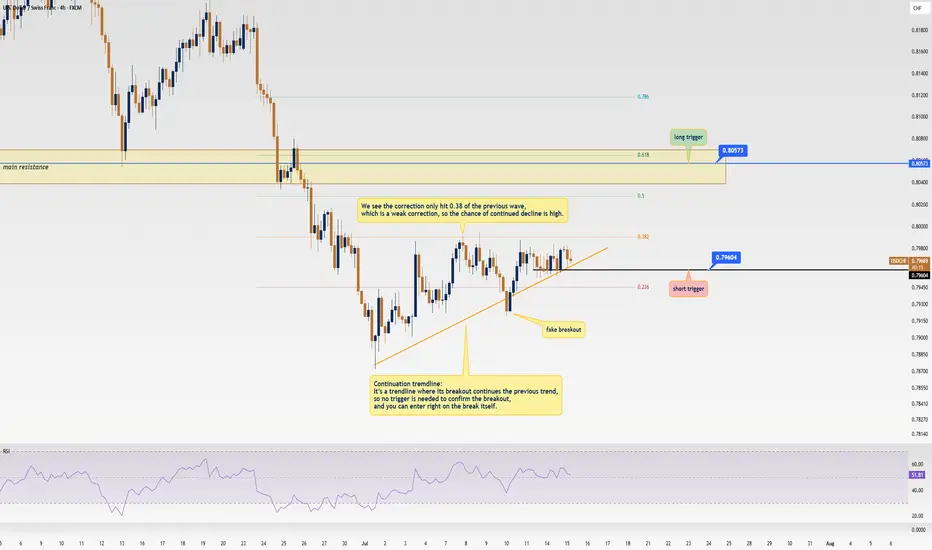
USD/CHF Update: Killer Short Trigger Ready to Pop!Welcome back, traders, it’s Skeptic from Skeptic Lab! 😎 We’ve got a juicy short trigger on USD/CHF that could deliver serious profits if it fires. Stay with me till the end to nail this trade! Let’s dive into the Daily and 4-hour timeframes for the full picture. Currently at $0.79671, here’s the play:
✔️ Daily Timeframe:
We’re in a rock-solid bearish major trend . After hitting a high of $ 0.84649 , we broke the key support at $ 0.80573 , resuming the bearish trend. A pullback to the broken $ 0.80573 level is likely, as it aligns with the 0.6 Fibonacci retracement from the prior 4-hour wave. Trading with the trend is smartest, so shorts are the focus. If you want to long, go with lower risk and close positions faster.
📊 4-Hour Timeframe (Futures Triggers):
Short Trigger: Two options here. Either enter on a trendline break (no extra trigger needed, as continuation trendlines mean the prior trend resumes on a break), or, for a safer play, short on a break of support at $ 0.79604 —this needs minimal confirmation.
Long Trigger: Wait for a break of the resistance zone at $ 0.80573 . Confirm with RSI entering overbought. Check my RSI guide ( link ) for how I use it differently—game-changing stuff!
📉 Key Insight: Stick to the bearish trend for higher-probability trades. Shorts at $0.79604 or on a trendline break are your best bet.
🔔Risk management is your lifeline—cap risk at max 1%–2% per trade to stay in the game.
I’ll catch you in the next analysis—good luck, fam! <3
💬 Let’s Talk!
Which USD/CHF trigger are you locked on? Hit the comments, and let’s crush it together! 😊 If this update lit your fire, smash that boost—it fuels my mission! ✌️
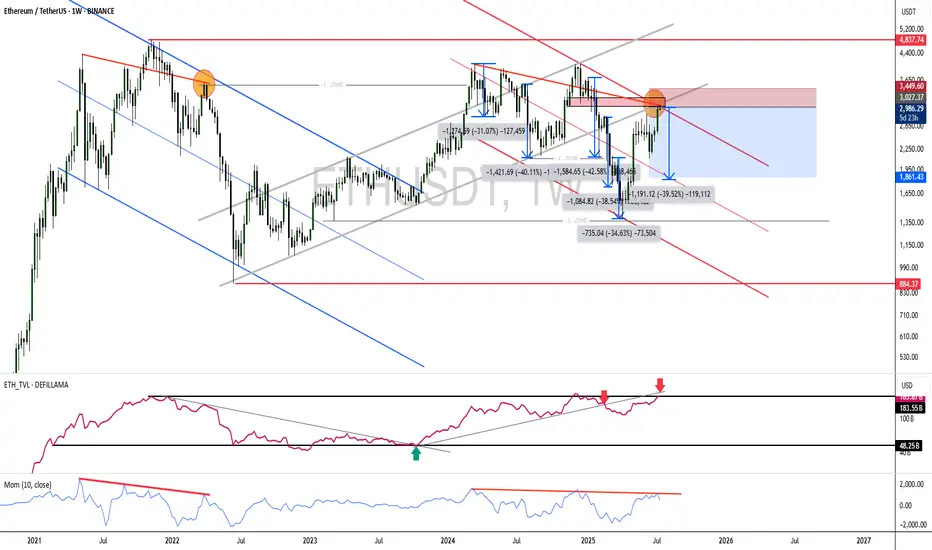
Is ETH overextended and due for a correction?For those holding ETH, this is a good point to set up a hedge using derivatives.
If the price keeps going up (which I think is unlikely at this moment—perhaps it will move sideways), buying at these levels is crazy.
In fact, there’s been a recent rally, full of people on X and YouTube saying this is the big moment to buy… That immediately raises a red flag for me!
And what about the FEDFUNDS? Have you taken a look? Haha, just something to think about.
--
After a long time away from TradingView and the community, I’m back to breathe some life into it!
Missed you all — let’s enjoy life and make the most of what it has to offer!
KULR Daily Watch – Triangle Squeeze Loading📍 Price Action:
Sitting tight at $6.50, coiling inside a clean symmetrical triangle. Last fake-out under support didn’t confirm → bulls still holding the line.
📊 Pattern Probabilities (Bulkowski):
Symmetrical triangles break ~54–60% in trend direction. Post-breakout moves hit ~60–75% of measured height → decent odds for upside here.
✅ Volume contracting = typical pre-breakout behavior
✅ RSI divergence still bullish
✅ Channel since 2023 intact, macro structure supports trend-following
🎯 Targets & RR Setup:
Trigger zone: $7.20–$7.50
Target 1: $9.45 (+31% | RR ~2.5:1)
Target 2: $28.81 (+298% | RR ~12:1)
Target 3 (channel top): $168.12 (+2,368% | moonshot 🌙)
⏳ Next Step:
Break over $7.50 = green light for Target 1. We’re trailing stops below the rising trendline to lock in gains without killing the move early.
#KULR #TrianglePattern #BreakoutWatch #TargetTraders #StockMarket

GAIL at Best Support zone !! There are two chart of Gail on Daily timeframe.
On the first chart Gail is moving in well defined parallel channel with support near at 178-180 zone.
Daily RSI is also taking support and bouncing back, indicating a revival in short-term momentum and strengthening the overall bullish setup.
On the second chart , the stock is bouncing from the supertrend support around ₹180, reinforcing bullish sentiment. However, on the shorter timeframe, the supertrend indicator is acting as resistance near ₹192, which needs to be breached for further upside continuation.
Thank You !!

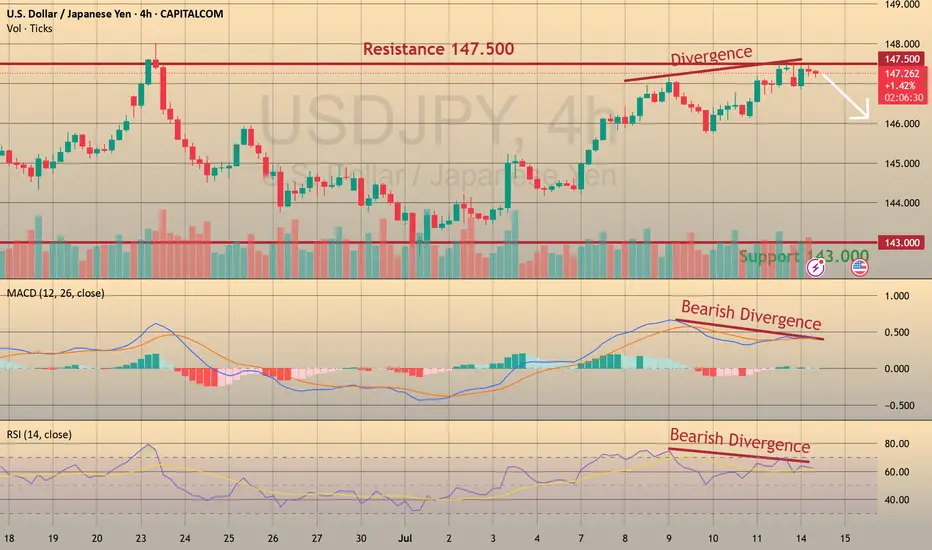
USDJPY: Bearish Divergence – Eyeing Shorts to 143 CAPITALCOM:USDJPY
We’re seeing strong bearish divergence in USDJPY near the 148 resistance zone, shifting our focus to short opportunities with a medium-term target at 142.
📈 Trading Plan:
🔻 SELL Stop: 147.040
❌ Stop Loss: 149.220
✅ Take Profit: 143.000
(Click 👉 Trade Now 👈 on your mobile to copy SL & TP easily)
🔍 Why am I short here?
✅ Technical: Clear bearish divergence on the H4 (RSI & MACD), indicating potential reversal signals.
✅ Resistance Zone: Price is testing the key 148 resistance, providing an ideal risk-reward location for shorts.
✅ Macro Event: Ahead of tomorrow’s US CPI release, a conservative trade structure is maintained to manage volatility risks.
📰 Fundamental Snapshot:
Japan’s economy shows signs of stabilization:
Core machinery orders fell only 0.6% MoM in May to ¥913.5B, much better than April’s -9.1% and forecasts of -1.5%.
Despite the headline decline, it indicates resilience in Japan’s capital spending, supporting the JPY’s medium-term outlook amid global trade and growth risks.
Trade cautiously!
NATURAL GAS - REBOUND FROM THE MAJOR TRENDLINE AND ANOTHER LONG CAPITALCOM:NATURALGAS
Last week on Wednesday and Thursday we observed the false breakout of the major trendline. Eventually, Thursday ended up bullish, gaining 4.8% day-to-day. On Friday the asset has been trading majorly sideways, retesting the major trendline (pic 1). Technically, looks like the divergence on RSI, MACD and Momentum works out as well as the bullish wedge (pic 2). Fundamentally, we still have warm temperature weather forecasts in the U.S. and bullish Thursday's EIA report. Additionally, today the market opened with a bullish gap and continues to grow, which is a good signal for the buyers.
Considering major levels here, I decided to open long positions:
🔼 a market buy order at 3.4556 with
❌a stop loss at 3.2995 and
🤑a take profit at 3.7927
At 3.6000 would be reasonable to reduce long position on a half. Thank you for the attention!

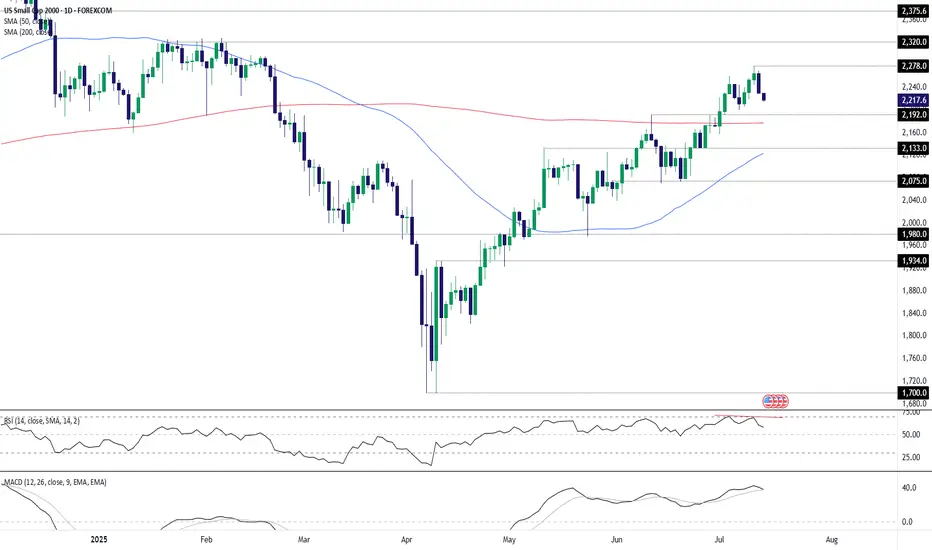
US Small Caps: Evening star pattern flags reversal riskThe U.S. Small Cap contract often generates reliable reversal signals, meaning the three-candle evening star pattern completed Friday should be of interest to traders, especially with bullish price momentum also showing signs of rolling over.
Should the price push back towards Monday’s opening level, shorts could be established beneath the level with a stop above for protection. 2192 looms as an initial target, having acted as both support and resistance in the recent past, although the 200-day moving average found at 2176.7 screens as a more appealing target given its importance for longer-term directional moves in the past.
If the price were to close beneath the 200DMA, it may act as a catalyst to spark a deeper unwind towards 2133 or 2075.
Good luck!
DS
GBP/AUD: Familiar support holds as global growth fears biteThe bearish unwind in GBP/AUD stalled in familiar territory, bouncing from 2.0500 in Asian trade, continuing the pattern seen since April when Donald Trump first unveiled reciprocal tariff rates on U.S. trading partners. Now, like then, the bounce likely reflects concern about the outlook for the global economy following the unveiling of 30% tariff rates on E.U. imports entering the United States from August 1. The headline-driven nature of the move overrides the deeply bearish message coming from momentum indicators like RSI (14) and MACD.
If the pair were to move towards 2.0500 again, it would create a decent long setup where positions could be established above the level with a stop beneath for protection. 2.0600 and 2.0700 screen as possible targets, although the most appealing target would be 2.0800 from a risk-reward perspective—that level has seen plenty of work either side of it over recent months and has the 50-day moving average located just above.
If the pair were to reverse back through 2.0500 and close there, the bullish setup would be invalidated, opening the door for bearish trades to be set targeting support at 2.0300.
Good luck!
DS

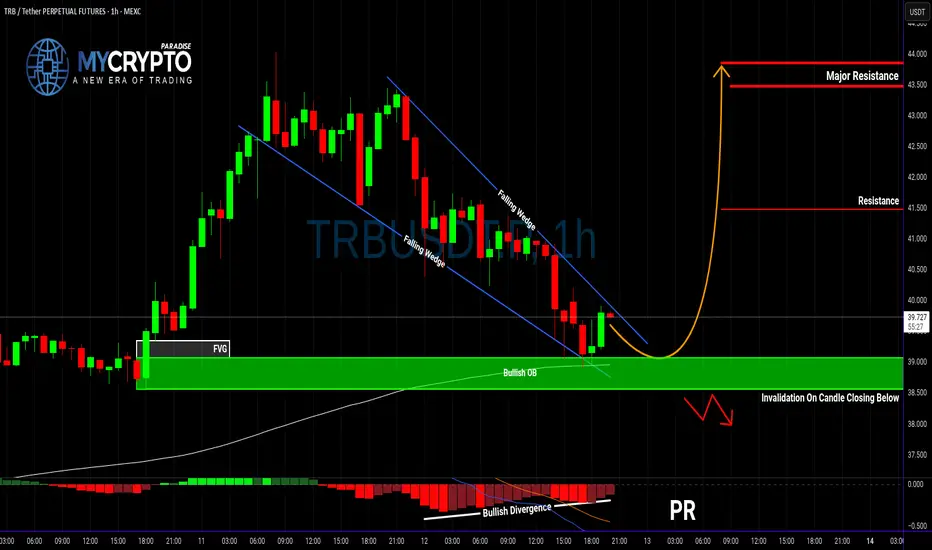
TRBUSDT: Massive Bullish Setup or a Fakeout Trap?Yello Paradisers — is TRBUSDT gearing up for a major breakout, or is this just another fakeout before a deeper drop? Our previous calls have been consistently accurate, and now this chart is flashing multiple signals that deserve your full attention.
💎Currently, TRBUSDT has formed a textbook falling wedge pattern, a well-known bullish reversal signal. What's adding strength to this setup is a clear bullish divergence, suggesting that momentum may be shifting in favor of the bulls. Even more compelling, the price is now holding firmly inside a bullish Order Block (OB) zone, which is aligned with the 200 EMA — a powerful confluence that increases the probability of a bullish move significantly.
💎For aggressive traders, this could be a valid spot to enter immediately, capitalizing on the current structure and zone. However, for those looking for a more calculated entry with improved risk-to-reward, waiting for a pullback could provide a much better setup — with the potential to offer over 4.5 RR, making it a high-probability trade idea.
💎That said, it’s important to manage risk carefully. If TRBUSDT breaks down and closes candle below the bullish OB zone, this would invalidate the bullish setup entirely. In that case, the smart move would be to wait patiently for new price action to form before making any decisions. Reacting emotionally here could lead to unnecessary losses, so discipline is key.
🎖Strive for consistency, not quick profits. Treat the market as a businessman, not as a gambler. If you want to be consistently profitable, you need to be extremely patient and always wait only for the best, highest probability trading opportunities.
MyCryptoParadise
iFeel the success🌴
A life-changing SBET long ideaSBET stock presents an amazing long opportunity that has a potential to do over 100x. After the break out of a down trend line, price retraced to the support, with price closing above this support level.
To advantage of this long opportunity, you can buy from the current market price while the exit can be at $1.34 and the targets can be at $123.70, $178.48, $541.22, $1041.90 and the final target at $2155.20.
Confluences for the long opportunity are as follows:
1. Break out of down trendline
2. Retest of the down trendline and support level.
3. Bullish divergence signal from awesome oscillator.
Disclaimer: This is not a financial advice. The outcome maybe different from the projection. Don't take the signal if you're not willing to accept the risk.

Netflix is going to fall sharply soonNetflix is in the huge 5th wave extension. I expect it to complete wave (v) of 5 very soon, probably within the next week.
RSI divergence on 3-days, weekly frames is quite visible and supports the upcoming trend reversal.
When wave 5 is extended, retracement typically goes to the bottom of wave (ii) of this 5th wave. This would mean 1180-1195 USD to end the wave 5. Also, at this price wave 5 will be 2.168 times bigger than waves 1 and 3 together.

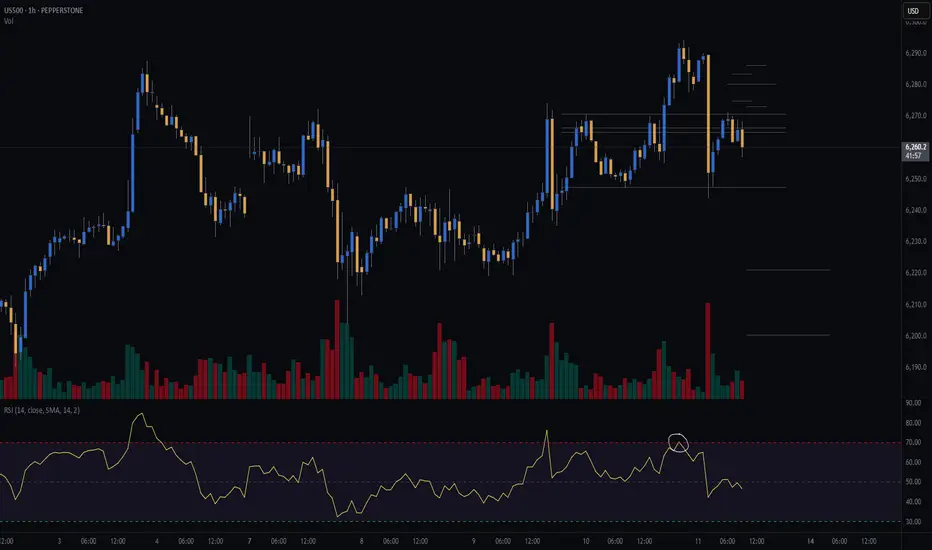
S&P 500 (CASH500) Short - Head and shoulders H1Potential short on S&P 500.
Risk/reward = 3.4
Entry = 6264.9
Stop loss = 6280.3
TP level 1 = 6221.7 (50%)
TP level 2 = 6200.5 (50%)
Need current candle to close back in range at 10.00 for all variables to be met.
Volume exception applied since current candle is the open of European markets.
Potential Top in CostcoCostco Wholesale has been quietly limping, and some traders may see downside risk in the big-box retailer.
The first pattern on today’s chart is the June low of $973.90. COST made lower highs while trying to hold that level but is now sliding below it. That may be viewed as a potentially bearish triangle breakdown.
Second, the 8-day exponential moving average (EMA) is under the 21-day EMA. MACD is also falling. Both of those signals may be consistent with short-term downtrends.
Third, COST made a lower high in June compared with February. Compared with the broader market’s breakout, such price action may reflect a lack of buying interest.
Finally, the 100-day simple moving average has turned meaningfully lower for the first time in over two years. That may suggest a weakening longer-term trend.
TradeStation has, for decades, advanced the trading industry, providing access to stocks, options and futures. If you're born to trade, we could be for you. See our Overview for more.
Past performance, whether actual or indicated by historical tests of strategies, is no guarantee of future performance or success. There is a possibility that you may sustain a loss equal to or greater than your entire investment regardless of which asset class you trade (equities, options or futures); therefore, you should not invest or risk money that you cannot afford to lose. Online trading is not suitable for all investors. View the document titled Characteristics and Risks of Standardized Options at www.TradeStation.com . Before trading any asset class, customers must read the relevant risk disclosure statements on www.TradeStation.com . System access and trade placement and execution may be delayed or fail due to market volatility and volume, quote delays, system and software errors, Internet traffic, outages and other factors.
Securities and futures trading is offered to self-directed customers by TradeStation Securities, Inc., a broker-dealer registered with the Securities and Exchange Commission and a futures commission merchant licensed with the Commodity Futures Trading Commission). TradeStation Securities is a member of the Financial Industry Regulatory Authority, the National Futures Association, and a number of exchanges.
TradeStation Securities, Inc. and TradeStation Technologies, Inc. are each wholly owned subsidiaries of TradeStation Group, Inc., both operating, and providing products and services, under the TradeStation brand and trademark. When applying for, or purchasing, accounts, subscriptions, products and services, it is important that you know which company you will be dealing with. Visit www.TradeStation.com for further important information explaining what this means.
