Altcoins are looking good.Altcoins are looking good.
After 1,340 days, Alts made a significant breakout against Bitcoin.
others + total2 + total3 / bitcoin
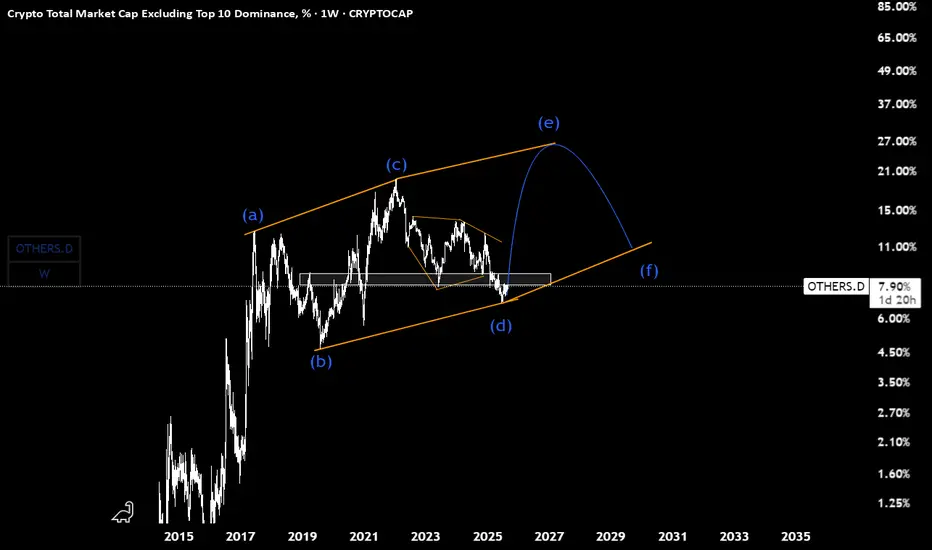
Others

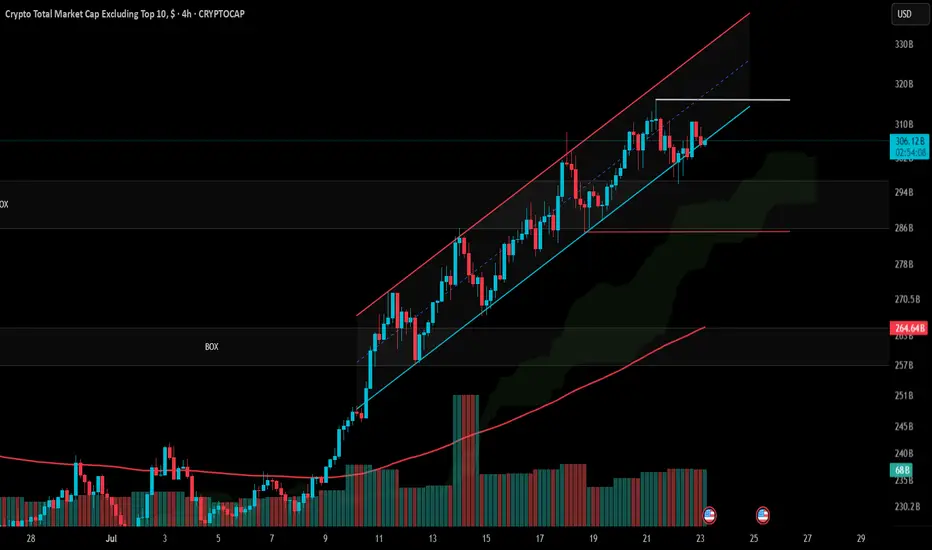
Others.D(based on NEo wave)there is 2 ways for wave E
its E of diametric or E of triangle.
we should wait for it but triangle makes a sharper wave E.
confirmation is breaking the white box on W timeframe.
Altseason 3.0 is inevitable!Altseason 3.0 is inevitable!
The altcoins season is a reality within the market's dynamics. Expecting a bear season without witnessing an unrealized altseason process is illogical.
CRYPTOCAP:OTHERS / CRYPTOCAP:BTC

CRYPTO: OTHERS (1W)'OTHERS' is an index that tracks the total market cap of crypto excluding the top 10. This is very helpful in determining the performance of alt coins.
Chart shows that there is a current resistance hanging in around the ATH (486.4B). If it breaks, we can likely see targets of around 798.92B as it is trying to complete wave (3) of the wave 5 encircled count. If price decides to reject the resistance rather than breaking, it is still safe to assume that we are in an uptrend as long as the price doesn't enter the area of wave (1) once it reaches 471.66B.
Summary:
Target of Wave (3) - 471.66B or 798.92B
Invalidation - 177.51B
Feel free to comment your thoughts :)

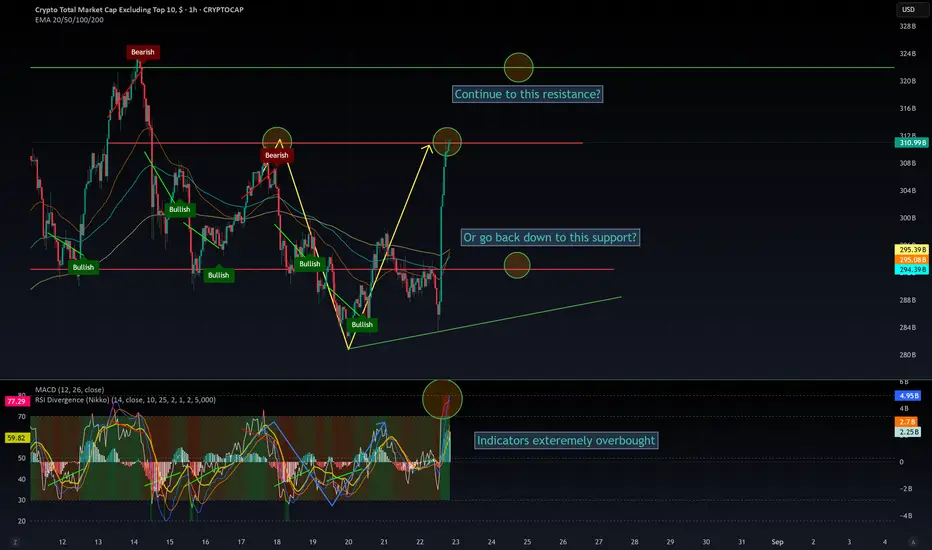
$OTHER Low Timefram (1H) UpdateThe market reacted positively to Powell’s tone, and we saw a massive pump. 🚀
But let me warn you—this move was predictable for a few reasons:
CRYPTOCAP:BTC liquidity was cleared at $111k
A massive $3B short squeeze was lined up for CRYPTOCAP:ETH
👉 This isn’t the first time market makers use Powell as an excuse to liquidate traders—and this time is no exception.
Did Powell announce a rate cut? ❌ No.
He simply tried to de-escalate tensions with Trump. The rate cut still depends on inflation data.
⚠️ Even a 0.5% cut wouldn’t be a revolution. The market isn’t reacting to fundamentals—it’s hunting liquidity. Retail is the target.
Every week the same cycle:
Friday FOMO → lure in retail
Monday dump → wreck them.
📉 Don’t buy the top. The real entry was before the pump. Now is a selling opportunity. If you’re on the sidelines, patience will give you another entry.
DYOR.
Altcoin Season Heating UpI want to highlight the OTHERS crypto index – which tracks the total market cap of all altcoins excluding the top 10.
Based on my Elliott Wave count, OTHERS has just completed a corrective move down to the 50% Fibonacci retracement (~$260B). From there, we’ve already seen a new higher high being printed on the daily chart – a strong bullish confirmation.
Right now, OTHERS looks to be entering the heart of a major Wave 3, the most powerful part of an Elliott Wave cycle. Historically, Wave 3 tends to deliver the strongest price acceleration.
📈 My target:
Wave 3 could drive OTHERS capitalization toward $420B.
That’s a potential +50% increase from the recent low.
💡 What this means for altcoins:
On average, we could see 50% growth across the altcoin market in the coming weeks.
Naturally, some projects with stronger momentum may rally much more – 100%+ moves are on the table.
⚡ Bottom line:
The bullish structure is intact, Wave 3 is unfolding, and altcoins are showing signs of strength. I remain firmly bullish on altcoins over the next month.

Mega Altcoins SeasonMega Altcoins Season ⏳
For the first time since 2021, signs of an ALTseason are literally there.
OTHERS + TOTAL2 + TOTAL3

Others: Now or Never- As always, the chart tells the full story (Trend, Fibonnacci and Elliot Waves).
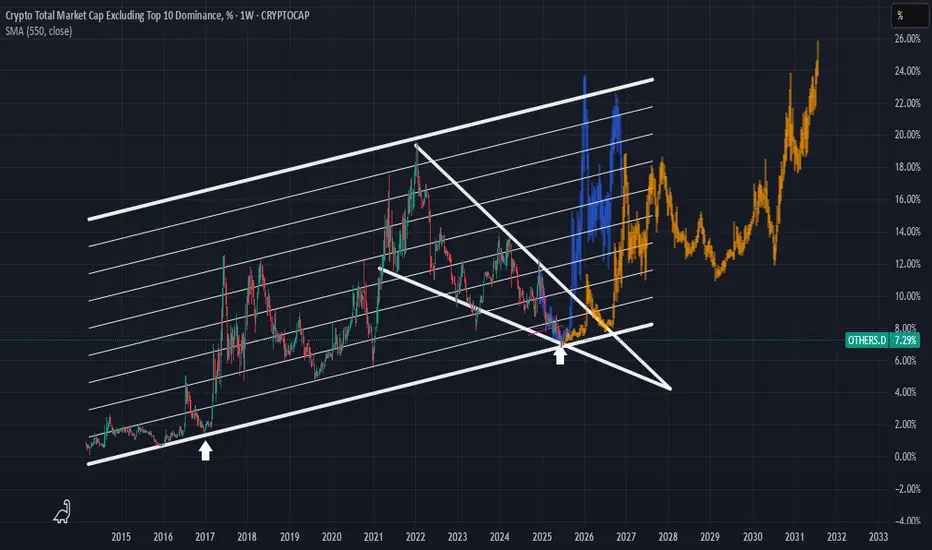
Historically, OTHERS.D (altcoin dominance) has had big swings depending on market cycles:
- During altcoin seasons (e.g. 2017, 2021), it has surged strongly as capital rotated from BTC and ETH into mid-cap and small-cap coins.
- Macro Cycle : if Bitcoin finishes its post-halving run (2025–2026), then money often rotates into altcoins, pushing OTHERS.D higher.
- Historical levels: OTHERS.D peaked near 20% in 2021. So 27% is ambitious but not impossible if altcoin adoption accelerates.
Remember, I only provide technical analysis and assumptions, fundamentals can shift everything at any moment, whether through governments, wars, unforeseen events, or even something as wild as an asteroid or alien invasion.
Happy Tr4Ding !

$OTHERS Market Update 📢 CRYPTOCAP:OTHERS Market Update
CRYPTOCAP:OTHERS has been consolidating in my horizontal range, between $193B and $320B.
⚠️ A clear Head & Shoulders pattern is forming — one of the most reliable bearish setups. At the same time, both RSI and MACD are in overbought territory, increasing the probability of a correction.
📉 Main Scenario:
A breakdown of support looks likely, with a retrace toward $260B. I don’t expect it to fall much lower.
✅ This reset would be healthy, clearing short-term exhaustion and setting up for a longer, more sustainable rally.
✅ It would also create great buying opportunities, especially for altcoins that haven’t pumped yet, like CRYPTOCAP:PEPE and $SUI.
📊 Alternative Scenario:
CRYPTOCAP:BTC and CRYPTOCAP:ETH could continue their institutional-driven rally, preventing this retrace. But that would leave many sidelined traders without the chance to reload at lower levels.
⚖️ Key takeaway:
Patience is everything. Even if CRYPTOCAP:BTC pushes higher next week, markets often pull back unexpectedly, offering us a second chance to buy.
🚀 Watch my green zones and check my other ideas for refill opportunities.
🔎 DYOR & trade safe.
🔖 #Crypto #Altcoins #OTHERS #Bitcoin #Ethereum #Altseason #CryptoTrading #TradingView #BTC #ETH #PEPE #SUI #CryptoAnalysis

$TOTAL analysis and the market psychologyOn this chart, I’ve highlighted some reliable patterns showing how the market often moves opposite to public sentiment.
📉 The triple top pattern led to only a small correction, and now we’re entering another one.
It’s the same story every time: when the RSI is overbought, social media explodes with “BUY! BUY! BUY!” — fueling FOMO and pushing late entries. That’s usually the best time to take profits.
Now, with CRYPTOCAP:BTC correcting after touching $124K and eyeing the $111K zone, we’re likely to see fear and negativity on social media, with people calling for the “end of the bull market.” Ironically, that’s exactly when smart money starts buying.
The market is designed to play with your emotions:
When it dumps → that’s your chance to buy at strong entries.
When RSI is overheated and everyone screams ATH → that’s the moment to take profit.
So… are you ready to refill your bags? 🚀
Check my ideas for clear entry zones on coins like CRYPTOCAP:INJ , SEED_DONKEYDAN_MARKET_CAP:BONK , CRYPTOCAP:PEPE , LSE:CFX , SEED_DONKEYDAN_MARKET_CAP:FLOKI , CRYPTOCAP:SUI , and more.
⚠️ DYOR (Do Your Own Research).

OTHERS data points to biggest ALT-Season Good Day Investors and traders,
This the OTHERS on the weekly and I have taken some measured moves in what could be expected in time and price.
The OTHERS chart in my opinion is the last form of the higher risk curve which generally happens at the very end of cycles The others does not include the top ten crypto, so it a very good form of risk on.
I have been looking at the OTHERS chart fairly often of recent times because this is the time for it to really outshine Bitcoin and lead the market with fairly explosive gains.
I have marked a couple of possible time lines that could occur and both seem to be lining up in sort of way or another. From what I can see, others has one big wave remaining, and it’s the one you don’t want to miss
The Indicators
Fibonacci retracement
I have placed a potential take profit zone from the 1.272 to the 1.618 levels and anywhere in between. I have added an up trending channel that OTHERS would have to hold to stay somewhat relevant or then could be susceptible to adjustment.
2.RSI
I have measured the first breakout of the RSI from the 2015-17 and 2019-21 bull runs along with this one so far. The one more relevant to us is 2015-17 as this is the cycle we are more closely following. There seems to be a recurring trend of 90 plus bars before a top to OTHERS. One more thing that really stands out to me in the RSI this the first time it has shown a very strong bearish divergence. normally it seems to maintain or gain strength. right to the very end. time will reveal the real issue here.
3. ISO
The average sentiment oscillator to also show very consistent data for us. I have two measurements. The one points to late July and the the other late October. To me this could be the potential ALT-season time frame from July as it fizzles in the October time frame.
My suggestion to you is follow what you have been taught so far, do not get greedy, take profits when they are there and trust your game plan and stick to it. ALT- SEASON can you a lot of money, or lose you a lot of money. By design, its there to take any profits you have may have, or catch any late coming stragglers. Don’t get caught up in the hoopla.
Once again, I ask you for you input, I really want to hear from you.
Check my bio for more links and information
Kind regards,
WeAreSat0shi

TICK... TOCK... ALTSEASONTICK... TOCK... ALTSEASON
OTHERS + TOTAL2 + TOTAL3 \ ALTCOINS
1380-day major resistance breakout!

$OTHERS / $BTC ALTSEASON REALITY IS INEVITABLE
The reality of the altseason, which was declared dead and denied in all cycles, is literally loading despite everything.

OTHERS \ ALTCOINS The ALTSEASON Approaching When You Least Expect It
The reality of alt-season forming at each stage of the cycle is inevitable and will happen again.
others \ btcOthers bitcoin pair has found support from the rising trend line since 2016 2017 and continues to recover

Has Bitcoin become a "SAFE" asset ? These charts show that......
After we heard the US Federal Reserve hold rates yesterday, Markets Fell some.
And Bitcoin joined them for a couple of hours but Look now.
While the $ falls, the S&P Falls, GOLD is the traditional haven of safety and we can see how it Rose in Value over the last 12 hours
The $ has Fallen over the last 8 hours
S&P Stalled for the last 24 hours
And the STRONGEST positive moves over the last 12 hours were from BITCOIN rising, though it is taking a breather for the moment.
SO, has it become a SAFE HAVEN ?
Put it like this. Bitcoin has NOT lost value like it used to when under pressure.
We have yet to see what would happen once it reaches its cycle Top. Will it retreat as it has historicaly...
But for now, it does seem to be a strong store of Value and remains with potential and likelihood of further rises.
The TOTAL CRYPTO MARKET CAP chart below
This shows us that the investor market seems Very confident in the Crypto Market,,Just going from strength to strength.
The TOTAL 2 Market Cap chart shows us something very interesting.
The TOTAL2 chart is the Total Market Cap MINUS BITCOIN
Compare the 2 charts and you will see how the TOTAL chart has risen way over its previous cycle ATH but the TOTAL2 is currently being rejected off its previous ATH line.
This clearly shows us that BITCOIN is the strength in the Crypto Market.
It is the same story on the TOTAL3 chart ( TOTAL minus BTC & ETH )
It is the same on the OTHERS chart ( Top 125 coins minus top 10 by market Cap )
BITCOIN CARRIES THE MARKET
These are early days but the Future of Bitcoin does seem VERY good
So far this cycle, the largest retrace was -31%
This drop was NOT a sharp Drop over a short period of time. It was an expected and controlled drop over 112 days.
But the zoomed out version of that chart tells us something VERY GOOD
PA has risen above and Tested and held that line of resistance that had rejected PA at Cycle Top ATH in 2017 and 2021.
That is a HUGE move and we wait to see if we Hold and move higher away from this line.
SO, Is Bitcoin a Safe Haven ?
It is certainly looking more and more like it.
PA is secure, has held position well and is in Price discovery...slowly and with caution...but always moving forward.
The traditional 4 yeat Cycle would end in late Q4 this year and so we have to wait and see what happens then.
But Bitcoin PA has moved into New ground on so many fronts now.
The traditinal BEAR market may not appear, in which case, YES, Bitcoin could become a New SAFE HAVEN
Buy Bitcoin
Hold Bitcoin
#Others Update #1 – July 23, 2025#Others Update #1 – July 23, 2025
The Others chart (crypto market cap excluding top 10) had been following a well-defined ascending channel. However, in recent candles, the price has started slipping below the lower boundary of this channel — a potentially bearish sign for altcoins.
Despite still technically being within the broader impulsive structure, it’s critical for price to reclaim and hold above $316B to maintain bullish momentum.
If the market corrects back to the origin of the impulsive leg, we may see a drop toward $285B, which would likely cause a 10–20% decline in altcoins overall.
The structure is not entirely broken yet, but Others is hovering at a risky edge. If you're holding altcoins, now is the time to be extra cautious.
We start ALT Season now with 3 targets!Hello guys,
As you can see we have 3 targets🎯 green, blue, red,
which target we will reach?
It depends on the Fractal scenario on the right, So we will wait 2 clear trends,
each one has 3 tops and Clear correction between the up trends,,
Don't lose your positions and don't jump between currencies!
Also Don't burn your wallet with Future!
Spot is Enough!

Do you believe in miracles?Others dominance is crazily undervalued way beyond anyone's imagination, it's been a crazy 4 year bear market for alts. Big question is, when will it end. Can't fathom this industry getting killed by exchanges, just look at others.d go man, crazy low.
If this were the equivalent to 2019/2020 and 2015/2016, any buy in this range is a one in a lifetime opportunity.
If this is like December 2016, well, that would save us years of struggle. Hard to tell what's going to happen but I still believe Trump will give us an extended bullrun that will peak when the FIFA world cup is on somewhere around July 4th 2026.
Great depression? this goes way beyond that, what more of a great depression do you want. Just brutal.

Very similar to January 2016You are looking at the Crypto Total Market Cap Excluding the Top 10 cryptocurrencies (OTHERS.D) on a weekly timeframe. This chart is often used as an "Altcoin Index" to gauge the strength of the broader cryptocurrency market beyond the major players like Bitcoin and Ethereum.
Here's my observation about being in a period similar to January 2016.
The technical analysis on this chart is built around a few key concepts:
1. Long-Term Ascending Channel: The dominant feature is a large parallel ascending channel that has contained the altcoin market cap's movements since 2015. The upper line has acted as a resistance level during bull market peaks, and the lower line has served as a major support level during bear market bottoms.
2. Historical Fractal (The "January 2016" Idea): My idea centers on a historical comparison, or a "fractal."
- The first white arrow points to a period in late 2016. At this time, the altcoin market cap found a bottom right on the support line of the ascending channel. This bottoming phase preceded the explosive 2017 bull run.
- The second white arrow points to a projected time in late 2025 / early 2026. The chart suggests that the market is currently in a similar bottoming pattern near the same long-term support line.
3. Falling Wedge: I've drawn a large falling wedge pattern starting from the peak in late 2021. This is typically a bullish reversal pattern, suggesting that the long downtrend could be nearing its end. The price is currently interacting with the apex of this wedge, a critical decision point.
4. Price Projection: The orange and blue bar patterns are copies of the price action that followed the 2016-2017 bottom. By pasting this fractal to the current time, the chart visualizes a potential future where history rhymes, leading to a massive new bull market for altcoins extending into 2027 until the end of the roaring 20s.
The Bullish Case (According to the Chart)
The argument presented by this analysis is clear:
• The altcoin market is at a historically strong support level (the bottom of the ~10-year channel).
• This is the same support level that kicked off the massive 2017 bull market.
• The market is consolidating within a falling wedge, which has a higher probability of breaking to the upside.
If this analysis holds true, the current period could be seen as a significant accumulation zone before the next major market expansion, much like the period around January 2016 was.
Important Considerations and Risks
While this is a compelling technical setup, it's crucial to maintain a balanced perspective. Here are some factors to consider:
• Past Performance is Not a Guarantee: This is the most important principle in financial markets. While historical patterns can provide valuable insight, they do not guarantee future results.
• Market Dynamics Have Changed: The cryptocurrency market of 2025 is fundamentally different from that of 2016.
• Maturity and Size: The market is significantly larger and includes substantial institutional investment, which can alter market behavior and volatility.
• Macroeconomic Factors: Global economic conditions, such as interest rates and inflation, now have a much stronger influence on the crypto market than they did in its earlier days.
• Regulatory Environment: Increased global regulatory scrutiny can introduce uncertainty and risks that were not present in the 2016-2017 cycle.
• Subjectivity of Technical Analysis: The trendlines and patterns are drawn based on an analyst's interpretation. Another analyst might draw them slightly differently, leading to a different conclusion.
Conclusion
The idea that "we're in January 2016 all over again" is a valid interpretation based on the technical patterns in this chart. The analysis points to the altcoin market being at a critical long-term support level, similar to the setup that preceded a major historical bull run.
This chart lays out a clear bullish roadmap. However, everyone should treat it as a potential scenario, not a certainty. I'll continue to monitor if the price respects these historical levels so that you guys are mindful of the broader market and macroeconomic factors that could influence the outcome.
Disclaimer: This analysis is for informational purposes only and is based on the technical analysis presented in the user-provided image. It should not be construed as financial advice. All investment decisions carry risk, and you should conduct your own research.
Altcoins Market Cap: We on the Verge of a 5T Exposion!Hey crypto traders! Let’s dive into this monthly chart of the Altcoins Market Cap. You won’t believe what’s brewing!
We’re currently approaching a critical channel support at 200B, a level that might act as a springboard for massive rally — check out the jumps from channel support in 2019 and 2023! Each time the market cap hit this support, it skyrocketed, and now we’re at that pivotal moment again.
The chart projects a jaw-dropping target of $5T within the next 24 months if history repeats itself!
The price action shows we’re testing the lower boundary of this ascending channel, with the market cap sitting around 239.65B. A bounce here could send altcoins on a parabolic run, potentially hitting 5T by mid-2026. But if support fails, we might see a dip toward 100B — let’s keep an eye out!
Key Levels to Watch:
Support: 175B (channel support)
Resistance: 1.55T, 5T (projected target)
Breakdown Risk: 100B
Are altcoins about to explode to 5T, or will we see a deeper correction? Drop your thoughts below!
PS take a look at others vs. btc price action here:

$OTHERS: Decision Time for AltcoinsDecision Time for Altcoins
Unless something drastic changes — like Trump firing Powell and cutting rates to 0% — the chart suggests a potential correction.
MACD is overheated, RSI is overbought, and we're hitting major resistance. An ABCD or extended ABCDEF pattern seems likely, with a upside target around $260B amd a downside support at $230B in total altcoin market cap.
Of course, the market can always choose to ignore the signals and continue its uptrend directly to the next resistance at $260B.
Stay sharp. Let’s see how it unfolds.
DYOR.
#Altcoins #Crypto #Bitcoin #ETH #MACD #RSI #TechnicalAnalysis #CryptoMarket #DYOR #PriceAction

APE coin cup & Handle. This chart shows good potential as the #Alts start to take back center stage form #BTC
neckline around 79c
could be a triple if Alts can sustain an uptrend.
it's been a while
but the time is now
if it is to be the case.
