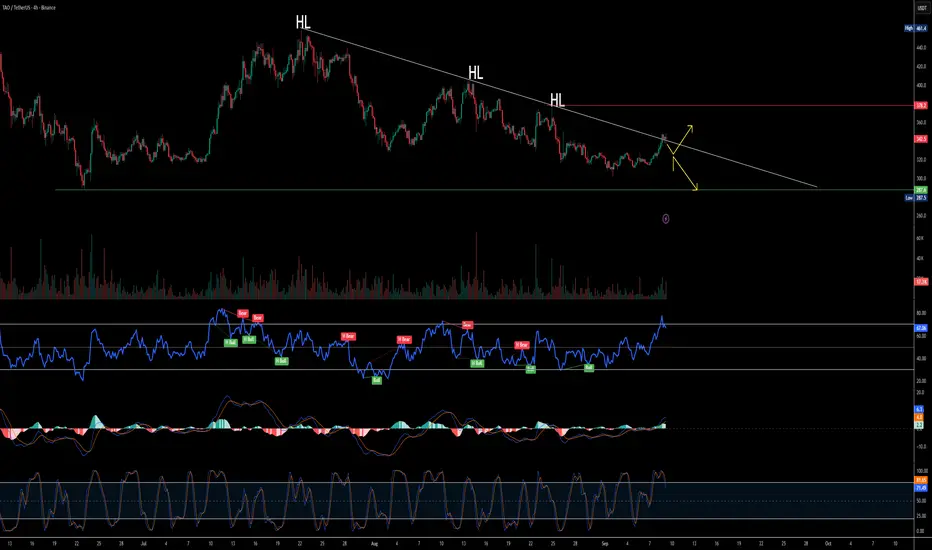
$TAO Higher Lows Forming but Overbought Signals Trigger SelliOn the 4-hour timeframe, TAOUSDT is consistently forming higher lows, but the structure still aligns with a bearish trend overall. For a clear breakout confirmation, price needs to surpass the $380 resistance zone.
Currently, both the Stochastic RSI and RSI are in the overbought region, indicating that sellers have started booking profits. This explains the short-term selling pressure.
If the price sustains above the $320 support level, there is potential for a reversal move toward new highs. However, failure to hold this zone could lead to another retest of the critical support near $287.
Traders should wait for confirmation before positioning, as the next direction depends on whether $320 holds or breaks.
Overbought
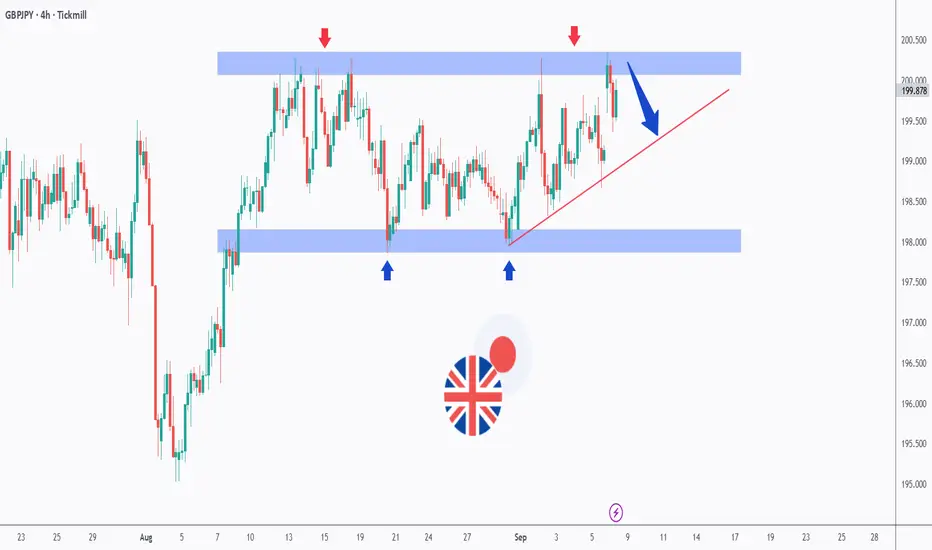
GBPJPY – Testing the Range Once AgainGBPJPY has been stuck in a wide range between 198.00 (support) and 200.50 (resistance) for several weeks now.
🔻 Sellers continue to defend the upper boundary (red arrows).
🔹 Buyers are stepping in around the 198.00 demand zone (blue arrows).
📈 Price is currently rejecting the resistance area once more while also sitting above the rising trendline (red).
If the resistance holds, we could see a rejection toward the lower bound of the range. On the other hand, a clean breakout above 200.50 would be needed for bulls to take full control. 🚀
This setup makes GBPJPY one of the key pairs to watch in the coming days.
Disclaimer:
This analysis is for educational purposes only and does not constitute financial advice. Always do your own research and follow your trading plan before making any investment decisions.
📚 Stick to your trading plan regarding entries, risk management, and trade execution.
Good luck!
All Strategies Are Good; If Managed Properly!
~Richard Nasr
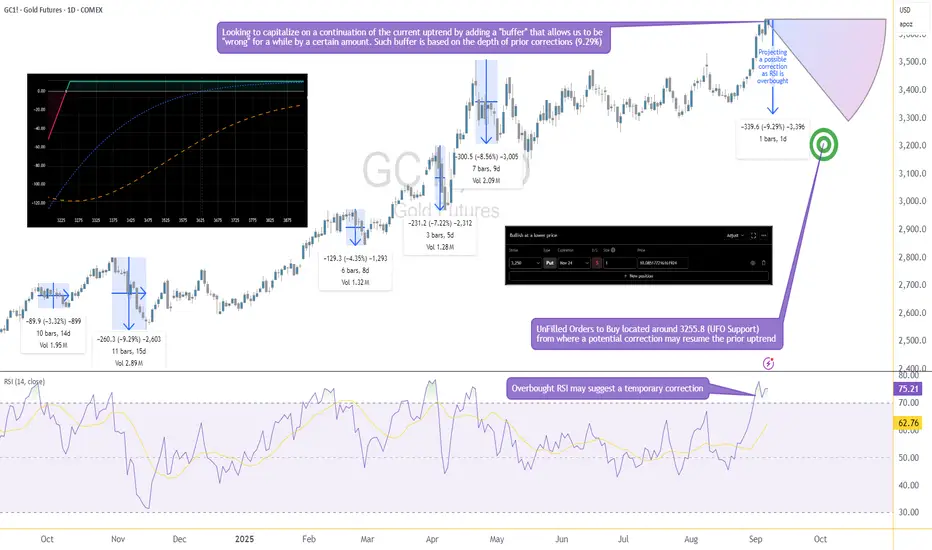
Options Blueprint Series [Basic]: Gold Income or Bargain Entry?The Setup: A Pullback with a Plan
Gold has been riding a strong bullish wave, yet momentum indicators suggest it's time for a breather. RSI is now overbought, and if history repeats, we could see a healthy correction of up to 9.29%, in line with prior pullbacks. This projects price near 3255, where we also find a cluster of UnFilled Orders (UFOs) acting as a potentially relevant support. It’s a key price area where buyers may step in again.
Rather than try to perfectly time the correction or the bottom, we’re applying a more forgiving approach: selling a PUT far below current price—generating income while leaving room to be wrong by over 375 points.
This is not a hedge. This is a standalone income strategy that accepts risk but frames it intelligently using technical context and options structure.
The Strategy: Selling the 3250 PUT on GC
We're using a simple but powerful strategy—selling a naked PUT—which can generate income or result in ownership of Gold at a deep discount if price dips.
Underlying Asset: GCZ2025 – using Gold Futures Options (Nov 24 2025 Expiration)
Strategy: Sell 1x 3250 PUT
Premium Collected: 10.09 points ≈ $1,009
Breakeven Price: 3240
Max Profit: $1,009 (if Gold stays above 3250 until expiration)
Max Risk: Unlimited below breakeven
There are two possible outcomes here:
Gold stays above 3250 → we keep the full premium.
Gold drops below 3250 → we get assigned and become long GC at 3250. From there, we’re exposed to downside risk in Gold, with a breakeven at 3240.
The position benefits from time decay and stable to rising prices, but it does carry the full downside exposure of long Gold futures if the trade moves against us.
We want to be very clear here—this is a naked trade with undefined risk. That doesn’t make it reckless if done with sizing discipline and technical alignment, but it’s not a beginner-friendly strategy.
Gold Contract Specs
Understanding the size and risk of what you're trading is critical—especially with naked options.
✅ GC – Gold Futures (Full Size)
Symbol: GC
Contract Size: 100 troy ounces
Tick Size: 0.10 = $10
Point Value: 1 point = $100
Initial Margin (as of Sep 2025): ~$15,000 per contract (subject to change)
Underlying for the Option: GC Futures
✅ MGC – Micro Gold Futures
Symbol: MGC
Contract Size: 10 troy ounces
Tick Size: 0.10 = $1
Point Value: 1 point = $10
Initial Margin: ~$1,500 per contract (subject to change)
Why does this matter?
Because if GC collapses below 3250 and you're assigned long, you’ll be exposed to full-size futures. That’s $100 per point of movement. A 50-point drop? That's $5,000 in unrealized loss.
That’s where MGC becomes your best ally. Micro Gold futures offer a scalable way to hedge. If price begins moving down or breaks below the support zone, one could short MGC against the Short GC 3250 PUT to cap further losses or rebalance directional exposure with reduced size and margin impact.
The Technical Confluence: Where Structure Meets Strategy
The 3250 strike isn’t just a random number—it’s calculated. Historical RSI-based corrections in Gold have shown recent worse-case scenarios around 9.29%, and projecting that from recent highs lands us precisely near the 3255 zone. This level also aligns with a clear UFO support, where institutional buyers have likely left behind unfilled orders.
That confluence—statistical retracement, technical indicator, and order flow support—gives the 3250 strike an interesting probability structure. Selling a Put beneath it means we are placing our bet below the “floor” and getting paid while we wait.
If Gold never corrects that far, we profit.
If it does, we might get long near a historically meaningful level.
There’s no need to catch the top. There’s no need to nail the bottom.
Just structure the trade where the odds are already potentially skewed in your favor.
Trade Plan: Reward, Risk & Realism
This trade isn’t about precision entry or leveraged glory—it’s about risk-defined logic with a cash-flow twist. Here's the full breakdown:
🧠 Trade Parameters
Strategy: Sell 1x Gold Futures 3250 PUT Options
Premium Collected: 10.09 points = $1,009
Point Value (GC): $100/point
Breakeven Price: 3240 (3250 – 10)
Expiration: Nov 24, 2025
🟩 If Gold Stays Above 3250
You keep the full premium → $1,009 profit
🟥 If Gold Falls Below 3250
You may be assigned 1 GC contra<ct long at 3250
Unrealized losses begin below breakeven (3240)
Losses can be significant if Gold falls aggressively
⚠️ Reward-to-Risk?
Reward is capped at $1,009
Risk is unlimited below breakeven
The trade only makes sense if you're prepared to own Gold, or hedge dynamically via MGC or using any other technique
This isn’t a “set-and-forget” income play—it’s a calculated entry into a structured exposure with a fallback plan.
Risk Management: No Margin for Error
Selling naked options isn’t “free money.” It’s responsibility wrapped in premium. Here's what must be considered:
❗ Undefined Risk
When you sell a naked PUT, you're exposed to the full downside. If Gold drops $100 below your strike, that’s a $10,000 loss. Don’t sell naked options unless you’re ready—and capitalized—to buy the underlying or actively hedge it.
🔄 Use MGC to Hedge
If Gold breaks below 3250, using Micro Gold Futures (MGC) offers a surgical way to hedge risk without overleveraging. A simple short MGC can offset GC losses proportionally, depending on how aggressive the move becomes.
🧮 Precision Matters
Avoid entering trades too early or too large.
Place an “invalidation” point: if price violates the support zone with conviction, reduce or hedge exposure.
Never sell premium just because it’s “high”—sell where structure backs the trade.
📊 Discipline Trumps Direction
This strategy is valid only if risk is respected. The market doesn’t owe anyone consistency—but a structured, risk-controlled approach keeps you in the game long enough to see it.
When charting futures, the data provided could be delayed. Traders working with the ticker symbols discussed in this idea may prefer to use CME Group real-time data plan on TradingView: www.tradingview.com - This consideration is particularly important for shorter-term traders, whereas it may be less critical for those focused on longer-term trading strategies.
General Disclaimer:
The trade ideas presented herein are solely for illustrative purposes forming a part of a case study intended to demonstrate key principles in risk management within the context of the specific market scenarios discussed. These ideas are not to be interpreted as investment recommendations or financial advice. They do not endorse or promote any specific trading strategies, financial products, or services. The information provided is based on data believed to be reliable; however, its accuracy or completeness cannot be guaranteed. Trading in financial markets involves risks, including the potential loss of principal. Each individual should conduct their own research and consult with professional financial advisors before making any investment decisions. The author or publisher of this content bears no responsibility for any actions taken based on the information provided or for any resultant financial or other losses.
GBPCAD Trendline Sell IdeaWith the RSI at 64.84, an overbought level, and the current price at the upper trendline. Hence, based on these conditions, I anticipate a sell on the GBPCAD currency pair.

NZDCAD – Range Resistance in Play!📌 NZDCAD has been moving within a clear range structure between support and resistance zones on the 1H timeframe.
Price is now approaching the upper resistance area, where sellers have consistently stepped in to cap bullish momentum.
If this level holds, we could see a bearish reversal, driving price back toward the support zone near the lower boundary of the range.
This setup offers a classic opportunity to trade the swing from resistance back into support.
⚠️ Always remember: patience pays. Let the market come to you.
📚 Always follow your trading plan regarding entry, risk management, and trade management.
Good luck!
All Strategies Are Good; If Managed Properly!
~Richard Nasr

AUDJPY - The Bears Are Still Strong!Hello TradingView Family / Fellow Traders. This is Richard, also known as theSignalyst.
📈AUDJPY has been overall bearish trading within the falling broadening wedge pattern marked in red and it is currently retesting the upper bound of the channel acting as a non-horizontal resistance.
Moreover, the blue zone is a strong resistance.
📚 As per my trading style:
As #AUDJPY retests the red circle zone, I will be looking for bearish reversal setups (like a double top pattern, trendline break , and so on...)
📚 Always follow your trading plan regarding entry, risk management, and trade management.
Good luck!
All Strategies Are Good; If Managed Properly!
~Richard Nasr

AUDCHF - Already Overbought!Hello TradingView Family / Fellow Traders. This is Richard, also known as theSignalyst.
📈AUDCHF has been overall bullish trading within the rising channel marked in red and it is currently retesting the upper bound of the channel acting as an over-bought zone.
Moreover, the blue zone is a strong weekly resistance.
📚 As per my trading style:
As #AUDCHF approaches the red circle zone, I will be looking for bearish reversal setups (like a double top pattern, trendline break , and so on...)
📚 Always follow your trading plan regarding entry, risk management, and trade management.
Good luck!
All Strategies Are Good; If Managed Properly!
~Rich
Disclosure: I am part of Trade Nation's Influencer program and receive a monthly fee for using their TradingView charts in my analysis.

EURUSD - One More Bearish Impulse Soon!Hello TradingView Family / Fellow Traders. This is Richard, also known as theSignalyst.
📈EURUSD has been overall bearish trading within the falling broadening wedge pattern marked in red and it is currently retesting the upper bound of the channel acting as a non-horizontal resistance.
Moreover, the blue zone is a strong supply.
📚 As per my trading style:
As #EURUSD retests the red circle zone, I will be looking for bearish reversal setups (like a double top pattern, trendline break , and so on...)
📚 Always follow your trading plan regarding entry, risk management, and trade management.
Good luck!
All Strategies Are Good; If Managed Properly!
~Rich
Disclosure: I am part of Trade Nation's Influencer program and receive a monthly fee for using their TradingView charts in my analysis.

Supply in Sight: AUDUSD Gearing Up for a Reversal?Hello TradingView Family / Fellow Traders. This is Richard, also known as theSignalyst.
📈AUDUSD has been overall bullish trading within the rising channel marked in red and it is currently retesting the upper bound of the channel acting as an over-bought zone.
Moreover, the blue zone is a strong supply.
📚 As per my trading style:
As #AUDUSD approaches the red circle zone, I will be looking for bearish reversal setups (like a double top pattern, trendline break , and so on...)
📚 Always follow your trading plan regarding entry, risk management, and trade management.
Good luck!
All Strategies Are Good; If Managed Properly!
~Rich
Disclosure: I am part of Trade Nation's Influencer program and receive a monthly fee for using their TradingView charts in my analysis.

USDJPY - Now or Never!Hello TradingView Family / Fellow Traders. This is Richard, also known as theSignalyst.
📈USDJPY has been overall bullish trading within the rising channel marked in blue and it is currently retesting the upper bound of the channel acting as an over-bought zone.
Moreover, the green zone is a strong weekly resistance.
📚 As per my trading style:
As #USDJPY is around the red circle zone, I will be looking for bearish reversal setups (like a double top pattern, trendline break , and so on...)
📚 Always follow your trading plan regarding entry, risk management, and trade management.
Good luck!
All Strategies Are Good; If Managed Properly!
~Rich
Disclosure: I am part of Trade Nation's Influencer program and receive a monthly fee for using their TradingView charts in my analysis.

CHFJPY - The Bulls Are Exhausted!Hello TradingView Family / Fellow Traders. This is Richard, also known as theSignalyst.
📈CHFJPY has been overall bullish trading within the rising channel marked in blue and it is currently retesting the upper bound of it.
Moreover, the green zone is a strong supply.
🏹 Thus, the highlighted red circle is a strong area to look for sell setups as it is the intersection of the upper blue trendline and green supply.
📚 As per my trading style:
As #CHFJPY is hovering around the red circle zone, I will be looking for bearish reversal setups (like a double top pattern, trendline break , and so on...)
📚 Always follow your trading plan regarding entry, risk management, and trade management.
Good luck!
All Strategies Are Good; If Managed Properly!
~Richard Nasr
Disclosure: I am part of Trade Nation's Influencer program and receive a monthly fee for using their TradingView charts in my analysis.

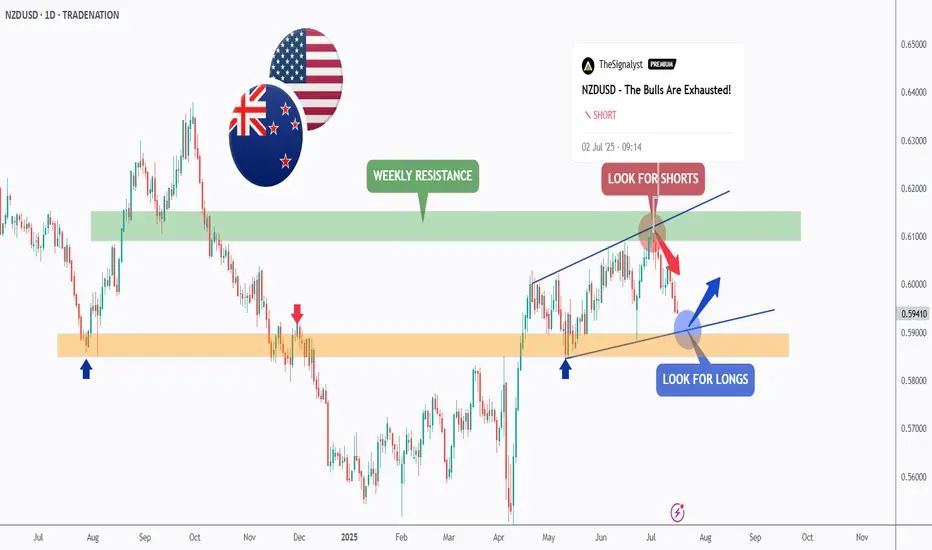
NZDUSD - It is Time!Hello TradingView Family / Fellow Traders. This is Richard, also known as theSignalyst.
As per our last NZDUSD analysis, attached on the chart, it rejected the upper bound of the blue wedge pattern and traded lower.
📈This week, NZDUSD is retesting the lower bound of the wedge.
Moreover, the orange zone is a strong weekly support.
🏹 Thus, the highlighted blue circle is a strong area to look for buy setups as it is the intersection of the lower blue trendline and orange support.
📚 As per my trading style:
As #NZDUSD approaches the blue circle zone, I will be looking for bullish reversal setups (like a double bottom pattern, trendline break , and so on...)
📚 Always follow your trading plan regarding entry, risk management, and trade management.
Good luck!
All Strategies Are Good; If Managed Properly!
~Rich
Disclosure: I am part of Trade Nation's Influencer program and receive a monthly fee for using their TradingView charts in my analysis.
EURJPY - Still Over-Bought!Hello TradingView Family / Fellow Traders. This is Richard, also known as theSignalyst.
📈EURJPY has been overall bullish trading within the rising channel marked in blue. However, it is currently retesting the upper bound of the channel.
Moreover, the green zone is a major weekly supply.
🏹 Thus, the highlighted red circle is a strong area to look for sell setups as it is the intersection of the upper blue trendline and weekly supply.
📚 As per my trading style:
As #EURJPY approaches the red circle zone, I will be looking for bearish reversal setups (like a double top pattern, trendline break , and so on...)
📚 Always follow your trading plan regarding entry, risk management, and trade management.
Good luck!
All Strategies Are Good; If Managed Properly!
~Richard Nasr
Disclosure: I am part of Trade Nation's Influencer program and receive a monthly fee for using their TradingView charts in my analysis.

USDJPY - Trade The Range!Hello TradingView Family / Fellow Traders. This is Richard, also known as theSignalyst.
📈USDJPY has been trading within a range between $140 and $150 round numbers and it is currently retesting the upper bound of the range.
📚 As per my trading style:
As #USDJPY is around the red circle zone, I will be looking for bearish reversal setups (like a double top pattern, trendline break , and so on...)
📚 Always follow your trading plan regarding entry, risk management, and trade management.
Good luck!
All Strategies Are Good; If Managed Properly!
~Rich
Disclosure: I am part of Trade Nation's Influencer program and receive a monthly fee for using their TradingView charts in my analysis.

EURCAD - Weekly Resistance Might Shift The Momentum!Hello TradingView Family / Fellow Traders. This is Richard, also known as theSignalyst.
📈EURCAD has been overall bullish trading within the rising channel marked in blue. However, it is currently approaching the upper bound of the channel.
Moreover, the red zone is a strong weekly resistance.
🏹 Thus, the highlighted red circle is a strong area to look for sell setups as it is the intersection of the upper blue trendline and resistance.
📚 As per my trading style:
As #EURCAD approaches the red circle zone, I will be looking for bearish reversal setups (like a double top pattern, trendline break , and so on...)
📚 Always follow your trading plan regarding entry, risk management, and trade management.
Good luck!
All Strategies Are Good; If Managed Properly!
~Rich
Disclosure: I am part of Trade Nation's Influencer program and receive a monthly fee for using their TradingView charts in my analysis.

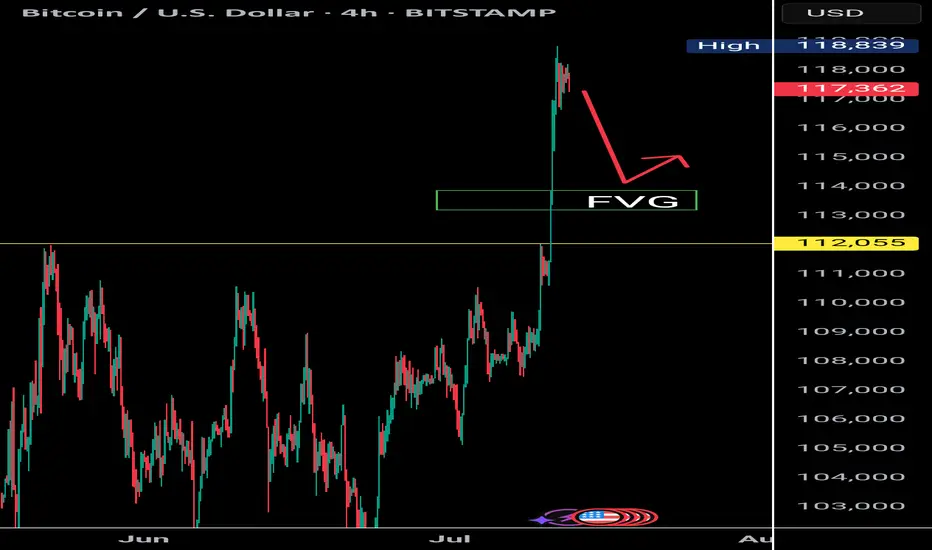
$BTC Rejection at 119K | Eyes on 112K Retest as RSI Cools DownBitcoin faces strong rejection near the $119K resistance zone, showing signs of a cooling market as the RSI exits the overbought territory. Historically, BTC tends to revisit key structural levels after such overheated moves. A favorable re-test zone lies between $114K and $112K, with $112K aligning closely with the previous all-time high — a psychologically significant support area.
Support levels to watch: $112K (favorable retest) and $110K (strong base).
As RSI continues to cool, keep an eye on bullish reactions around these levels for potential entries.
NZDJPY - bulls are exhausted! Hello TradingView Family / Fellow Traders. This is Richard, also known as theSignalyst.
📈NZDJPY has been overall bullish trading within the rising flat channel marked in blue and it is currently retesting the upper bound of it.
Moreover, the green zone is a strong structure.
🏹 Thus, the highlighted red circle is a strong area to look for sell setups as it is the intersection of the upper blue trendline and green structure.
📚 As per my trading style:
As #NZDJPY is hovering around the red circle zone, I will be looking for bearish reversal setups (like a double top pattern, trendline break , and so on...)
📚 Always follow your trading plan regarding entry, risk management, and trade management.
Good luck!
All Strategies Are Good; If Managed Properly!
~Rich
Disclosure: I am part of Trade Nation's Influencer program and receive a monthly fee for using their TradingView charts in my analysis.

EURUSD - Macro Trend Shift Soon?Hello TradingView Family / Fellow Traders. This is Richard, also known as theSignalyst.
📈From a macro perspective, EURUSD has been bearish trading within the falling red channel.
Medium-term, EURUSD has been in a correction phase trading within the rising channel in orange.
Moreover, the green zone is a massive monthly resistance.
🏹 Thus, the highlighted red circle is a strong area to look for sell setups as it is the intersection of the upper red and orange trendlines and resistance.
📚 As per my trading style:
As #EURUSD is around the red circle zone, I will be looking for bearish reversal setups (like a double top pattern, trendline break , and so on...)
📚 Always follow your trading plan regarding entry, risk management, and trade management.
Good luck!
All Strategies Are Good; If Managed Properly!
~Rich
Disclosure: I am part of Trade Nation's Influencer program and receive a monthly fee for using their TradingView charts in my analysis.

US30 - ShortLooking for the Short on US30 final pull back before we see extension to the upside 45,000.

US30 - Long 43,150Still looking for that 43,150 lets get a test of FVG then on bullish PA above we can plan trade. Stops would go below the order block.

EURGBP - Bullish No More!Hello TradingView Family / Fellow Traders. This is Richard, also known as theSignalyst.
📈 EURGBP has been overall bullish trading within the rising channel marked in blue. And it is currently retesting the upper bound of the channel.
Moreover, the orange zone is a strong weekly resistance.
🏹 Thus, the highlighted red circle is a strong area to look for sell setups as it is the intersection of the upper blue trendline and resistance.
📚 As per my trading style:
As #EURGBP is around the red circle zone, I will be looking for bearish reversal setups (like a double top pattern, trendline break , and so on...)
📚 Always follow your trading plan regarding entry, risk management, and trade management.
Good luck!
All Strategies Are Good; If Managed Properly!
~Rich
Disclosure: I am part of Trade Nation's Influencer program and receive a monthly fee for using their TradingView charts in my analysis.

Is Altseason Around the Corner? BTC.D looks tired AF!BTC dominance just hit the top of a rising wedge that has been building for over a year. Price is stalling at 65.64 percent, sitting right against long-standing resistance.
Momentum is weakening. Stochastic RSI is at 72 and starting to roll over. RSI is sitting just under 70 and showing early signs of fading.
The structure suggests we are close to a decision. If BTC dominance starts to fall from here, the conditions for an altcoin run are in place.
Key levels to the downside are already mapped. First is 59.97 percent. Then 58.70 percent. After that, 56.88 percent. The 100-week simple moving average is also sitting at 56.51 percent. If dominance breaks below that level, it opens the door for a larger shift in market flow.
Previous retracements in BTC dominance have aligned with strong moves in altcoins. This current setup is technically clean and nearing resolution.
It is not confirmed yet, but the signals are starting to stack. This is a moment worth watching.

EURJPY - Over-Bought Big Time!Hello TradingView Family / Fellow Traders. This is Richard, also known as theSignalyst.
📈EURJPY has been overall bullish trading within the rising channel marked in blue. However, it is currently retesting the upper bound of the channel.
Moreover, the green zone is a major weekly supply.
🏹 Thus, the highlighted red circle is a strong area to look for sell setups as it is the intersection of the upper blue trendline and weekly supply.
📚 As per my trading style:
As #EURJPY approaches the red circle zone, I will be looking for bearish reversal setups (like a double top pattern, trendline break , and so on...)
📚 Always follow your trading plan regarding entry, risk management, and trade management.
Good luck!
All Strategies Are Good; If Managed Properly!
~Rich
Disclosure: I am part of Trade Nation's Influencer program and receive a monthly fee for using their TradingView charts in my analysis.
