EURUSD - Follow The Bulls Indeed!Hello TradingView Family / Fellow Traders. This is Richard, also known as theSignalyst.
📈EURUSD has been overall bullish trading within the rising channel marked in blue.
This week, EURUSD has been retesting the lower bound of the channel.
Moreover, the orange zone is a strong demand.
🏹 Thus, the highlighted blue circle is a strong area to look for buy setups as it is the intersection of the lower blue trendline and orange demand.
📚 As per my trading style:
As #EURUSD approaches the blue circle zone, I will be looking for trend-following bullish reversal setups (like a double bottom pattern, trendline break , and so on...)
📚 Always follow your trading plan regarding entry, risk management, and trade management.
Good luck!
All Strategies Are Good; If Managed Properly!
~Richard Nasr
P-signal

GBPUSD A Fall Expected! SELL!
My dear subscribers,
My technical analysis for GBPUSD is below:
The price is coiling around a solid key level - 1.3577
Bias - Bearish
Technical Indicators: Pivot Points Low anticipates a potential price reversal.
Super trend shows a clear sell, giving a perfect indicators' convergence.
Goal - 1.3550
My Stop Loss - 1.3590
About Used Indicators:
By the very nature of the supertrend indicator, it offers firm support and resistance levels for traders to enter and exit trades. Additionally, it also provides signals for setting stop losses
Disclosure: I am part of Trade Nation's Influencer program and receive a monthly fee for using their TradingView charts in my analysis.
———————————
WISH YOU ALL LUCK

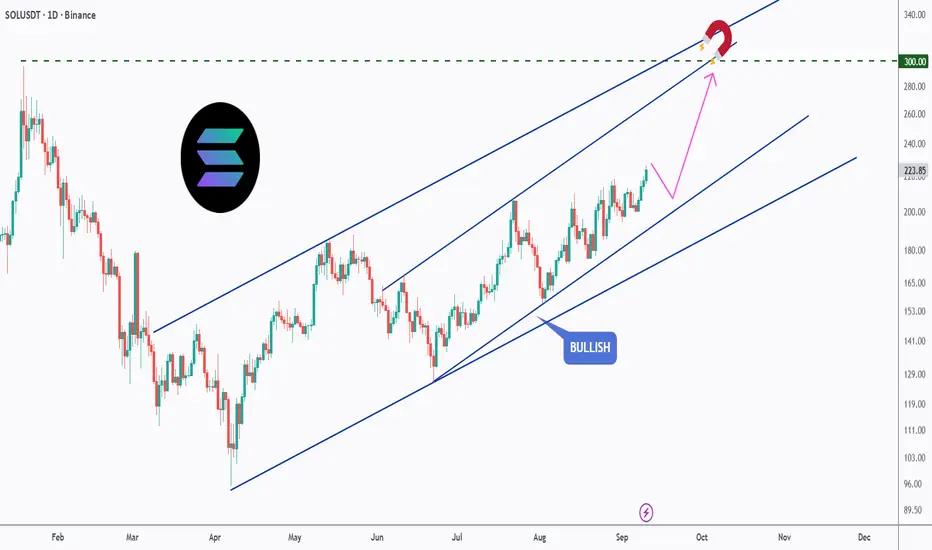
SOL’s Magnetic Path to $300!Solana has been steadily climbing inside a clean bullish channel, and the momentum is showing no signs of slowing down. The price action continues to respect higher highs and higher lows, keeping the bullish structure intact.
🟢 Bullish Channel: SOL is trading neatly within an ascending channel, confirming the trend’s strength.
🎯 Key Target: The $300 level acts as a magnet — a psychological resistance aligning with the channel’s upper boundary.
🔄 Healthy Pullbacks: Any short-term dips within the channel are being absorbed quickly, signaling strong buyer interest.
🚀 Upside Outlook: As long as SOL holds within the channel, the path of least resistance remains to the upside, with $300 as the next major milestone.
📌 Eyes remain on whether Solana can reach the $300 mark before the year’s end.
This is for educational purposes only, not financial advice. Always manage risk properly before trading.
📚 Stick to your trading plan regarding entries, risk management, and trade execution.
Good luck!
All Strategies Are Good; If Managed Properly!
~Richard Nasr
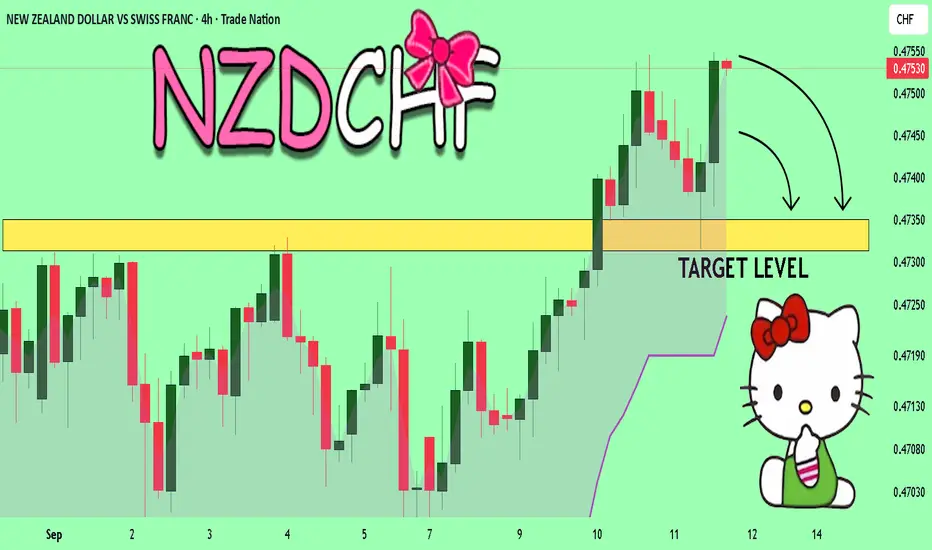
NZDCHF Technical Analysis! SELL!
My dear friends,
Please, find my technical outlook for NZDCHF below:
The price is coiling around a solid key level - 0.4352
Bias - Bearish
Technical Indicators: Pivot Points High anticipates a potential price reversal.
Super trend shows a clear sell, giving a perfect indicators' convergence.
Goal - 0.4735
About Used Indicators:
The pivot point itself is simply the average of the high, low and closing prices from the previous trading day.
Disclosure: I am part of Trade Nation's Influencer program and receive a monthly fee for using their TradingView charts in my analysis.
———————————
WISH YOU ALL LUCK
WLFIUSDT.P - September 12, 2025This is a high-risk trading setup. The probability of success for this trade is low, and there is a significant chance of a full loss.
Entry Price: 0.1994
Stop Level: 0.1694
Profit Target: 0.2445

USDCHF: Long Trading Opportunity
USDCHF
- Classic bullish pattern
- Our team expects retracement
SUGGESTED TRADE:
Swing Trade
Buy USDCHF
Entry - 0.7963
Stop -0.7955
Take - 0.7977
Our Risk - 1%
Start protection of your profits from lower levels
Disclosure: I am part of Trade Nation's Influencer program and receive a monthly fee for using their TradingView charts in my analysis.
❤️ Please, support our work with like & comment! ❤️

SOL The Whales are Selling at This Strong Resistance Level 230$SOL Current Market Update
The coin is now facing a very strong resistance around $230 .
This presents a great short opportunity .
After carefully monitoring buy and sell orders on-chain, I noticed a strong confirmation for the short setup:
Whales and Market Makers sell orders are clustered heavily around the $228 – $230 resistance zone.
✅ My Personal Strategy:
Short Entry: Resistance zone between $228 – $230
🎯 Target 1: $220
🎯 Target 2: $216
Please note:
This is not financial advice – I’m only sharing my personal trades.
Always do your own research before taking action.
👍 Don’t forget to like if you found this useful, and feel free to follow me for more analysis of this kind.
Best of luck 🌹

EURNZD Expected Growth! BUY!
My dear subscribers,
EURNZD looks like it will make a good move, and here are the details:
The market is trading on 1.9695 pivot level.
Bias - Bullish
Technical Indicators: Both Super Trend & Pivot HL indicate a highly probable (Bullish continuation.
Target - 1.9782
About Used Indicators:
The average true range (ATR) plays an important role in 'Supertrend' as the indicator uses ATR to calculate its value. The ATR indicator signals the degree of price volatility.
Disclosure: I am part of Trade Nation's Influencer program and receive a monthly fee for using their TradingView charts in my analysis.
———————————
WISH YOU ALL LUCK

NZDCAD: Trading Signal From Our Team
NZDCAD
- Classic bearish pattern
- Our team expects retracement
SUGGESTED TRADE:
Swing Trade
Sell NZDCAD
Entry - 0.8230
Stop - 0.8238
Take - 0.8216
Our Risk - 1%
Start protection of your profits from lower levels
Disclosure: I am part of Trade Nation's Influencer program and receive a monthly fee for using their TradingView charts in my analysis.
❤️ Please, support our work with like & comment! ❤️

EURUSD On The Rise! BUY!
My dear friends,
EURUSD looks like it will make a good move, and here are the details:
The market is trading on 1.1704 pivot level
Bias - Bullish
Technical Indicators: Supper Trend generates a clear long signal while Pivot Point HL is currently determining the overall Bullish trend of the market.
Goal - 1.1730
Recommended Stop Loss - 1.1690
About Used Indicators:
Pivot points are a great way to identify areas of support and resistance, but they work best when combined with other kinds of technical analysis
Disclosure: I am part of Trade Nation's Influencer program and receive a monthly fee for using their TradingView charts in my analysis.
———————————
WISH YOU ALL LUCK

USD/JPY - Top Down Analysis 🟣 Monthly Chart (Macro Structure)
Context: Price has been ranging within a broad band between 162 resistance and 138–140 support.
Current Zone: Sitting mid-range near 147–148, right under a heavy monthly supply block (150–152).
Bias: Until 150+ breaks clean, upside is capped. Structure suggests more downside liquidity hunts.
🔵 Weekly Chart (Swing Bias)
Supply Zone: Weekly supply at 150–152 rejected strongly.
Trendline: Rising liquidity channel (higher lows), but capped at supply.
Order Flow: Repeated rejections indicate sellers still control the higher timeframe.
Bias: Bearish toward the liquidity resting around 145.
Key Levels:
Resistance: 150–152
Support: 144–145
🟢 Daily Chart (Refined Structure)
Supply Reaction: Strong rejection from the 61.8% retrace within the weekly supply zone.
SSL (Sell-Side Liquidity): Resting neatly at 145 handle, aligning with trendline support.
Bias: Lower-high structure under supply → daily order flow favors continuation down.
⏱ 1H Chart (Execution Layer)
Supply Zone: 147.7–147.9 (confluent with 71% fib retrace & weak resistance).
Reaction: Intraday rejection already showing weakness.
Next Path: Break of weak support at 147.0 would confirm continuation toward 146.8 → 145.5.
Intraday Bias: Sell rallies back into 147.7–147.9.

GBPJPY What Next? SELL!
My dear subscribers,
This is my opinion on the GBPJPY next move:
The instrument tests an important psychological level 199.56
Bias - Bearish
Technical Indicators: Supper Trend gives a precise Bearish signal, while Pivot Point HL predicts price changes and potential reversals in the market.
Target - 199.28
My Stop Loss - 199.71
About Used Indicators:
On the subsequent day, trading above the pivot point is thought to indicate ongoing bullish sentiment, while trading below the pivot point indicates bearish sentiment.
Disclosure: I am part of Trade Nation's Influencer program and receive a monthly fee for using their TradingView charts in my analysis.
———————————
WISH YOU ALL LUCK

GOLD: Bearish Continuation & Short Trade
GOLD
- Classic bearish setup
- Our team expects bearish continuation
SUGGESTED TRADE:
Swing Trade
Short GOLD
Entry Point - 3644.0
Stop Loss - 3652.1
Take Profit - 3630.1
Our Risk - 1%
Start protection of your profits from lower levels
Disclosure: I am part of Trade Nation's Influencer program and receive a monthly fee for using their TradingView charts in my analysis.
❤️ Please, support our work with like & comment! ❤️

EURUSD Set To Grow! BUY!
My dear friends,
EURUSD looks like it will make a good move, and here are the details:
The market is trading on 1.1637 pivot level.
Bias - Bullish
Technical Indicators: Supper Trend generates a clear long signal while Pivot Point HL is currently determining the overall Bullish trend of the market.
Goal - 1.1674
About Used Indicators:
Pivot points are a great way to identify areas of support and resistance, but they work best when combined with other kinds of technical analysis
Disclosure: I am part of Trade Nation's Influencer program and receive a monthly fee for using their TradingView charts in my analysis.
———————————
WISH YOU ALL LUCK

XAUUSD – Bullish Bias Targeting Buy-Side LiquidityOn the 1H timeframe, my perspective on Gold (XAUUSD) remains bullish, with the main target being the buy-side liquidity above current price.
Price has recently formed a bullish Fair Value Gap (FVG), which may serve as support and a potential launch point for further upside. If price holds here, we could see continuation toward higher levels. For entry, I’ll be waiting for lower timeframe reaction and confirmation.
However, it’s also important to note the sell-side liquidity resting just below the FVG. There is a possibility that price may first sweep this liquidity, tap into the underlying bullish order block, and then begin the upward move.
For this reason, I am watching two key areas:
1️⃣ The current bullish FVG as initial support.
2️⃣ The deeper bullish order block, should liquidity below be cleared.
In both cases, my bias remains bullish, but execution will depend on LTF confirmation at these zones.
💌It is my honor to share your comments with me💌
🔎 DYOR
💡Wait for the update!


EURUSD: Short Trade Explained
EURUSD
- Classic bearish formation
- Our team expects pullback
SUGGESTED TRADE:
Swing Trade
Short EURUSD
Entry - 1.1723
Sl - 1.1732
Tp - 1.1707
Our Risk - 1%
Start protection of your profits from lower levels
Disclosure: I am part of Trade Nation's Influencer program and receive a monthly fee for using their TradingView charts in my analysis.
❤️ Please, support our work with like & comment! ❤️

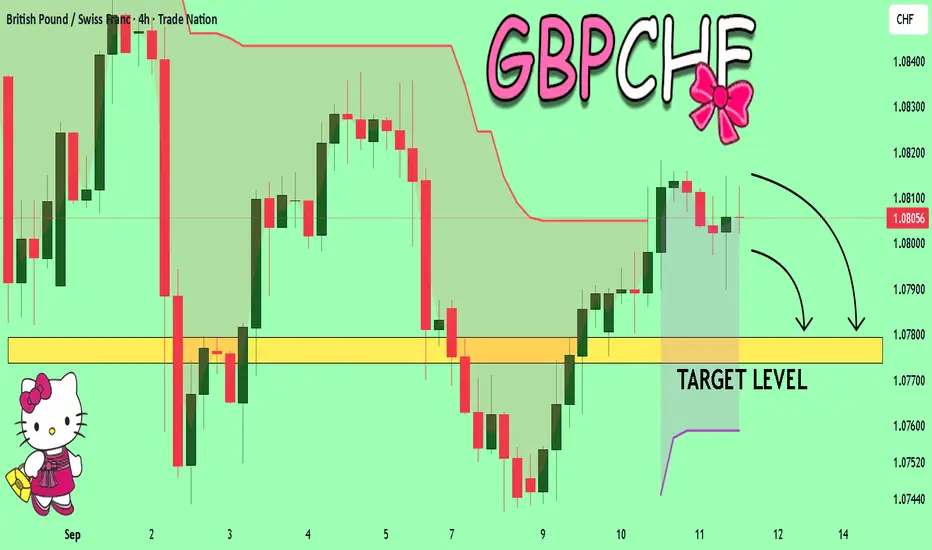
GBPCHF Set To Fall! SELL!
My dear friends,
My technical analysis for GBPCHF is below:
The market is trading on 1.0803 pivot level.
Bias - Bearish
Technical Indicators: Both Super Trend & Pivot HL indicate a highly probable Bearish continuation.
Target - 1.0779
About Used Indicators:
A pivot point is a technical analysis indicator, or calculations, used to determine the overall trend of the market over different time frames.
Disclosure: I am part of Trade Nation's Influencer program and receive a monthly fee for using their TradingView charts in my analysis.
———————————
WISH YOU ALL LUCK
GOLD Trading Opportunity! SELL!
My dear followers,
I analysed this chart on GOLD and concluded the following:
The market is trading on 3635.2 pivot level.
Bias - Bearish
Technical Indicators: Both Super Trend & Pivot HL indicate a highly probable Bearish continuation.
Target - 3624.7
Safe Stop Loss - 3641.7
About Used Indicators:
A super-trend indicator is plotted on either above or below the closing price to signal a buy or sell. The indicator changes color, based on whether or not you should be buying. If the super-trend indicator moves below the closing price, the indicator turns green, and it signals an entry point or points to buy.
Disclosure: I am part of Trade Nation's Influencer program and receive a monthly fee for using their TradingView charts in my analysis.
———————————
WISH YOU ALL LUCK

Gold Trading Strategy XAUUSD 11/9/2025Gold Trading Strategy XAUUSD 11/9/2025: Gold is stable, traders prepare ahead of important US CPI data, conditions and technical positions to watch.
Fundamental news: Spot gold prices were generally stable in today's Asian trading session, currently around $3630/ounce. Gold prices are in a wait-and-see mode, closely watching the all-time high before the release of US CPI data for August. Weak US PPI inflation data, fueling speculation that the Federal Reserve will continue its easing cycle at its upcoming meeting in September.
Technical analysis: After making the latest ATH at 3675, gold prices are correcting and forming a short-term downtrend channel in the H1 frame, however, the 3620 - 3625 area is still a good support zone for gold prices. Currently, there will be 2 scenarios with the highest probability of occurrence: Case 1: Gold price will form an upward price pattern around the 3620 - 3625 area and increase sharply, we will wait for the reaction when the price meets resistance at 3660 - 3665. Case 2: Gold price continues to follow the downtrend channel to the lower support area of 3595 - 3600 and then increase again. We will trade based on these 2 scenarios and still prioritize trading according to the main trend.
Important price zones today: 3620 - 3625, 3595 - 3600 and 3660 - 3665.
Today's trading trend: BUY.
Recommended orders:
Plan 1: BUY XAUUSD zone 3620 - 3622
SL 3617
TP 3625 - 3635 - 3645 - 3665 - OPEN.
Plan 2: BUY XAUUSD zone 3598 - 3600
SL 3595
TP 3603 - 3610 - 3630 - 3660 - OPEN.
Plan 3: SELL XAUUSD zone 3663 - 3665
SL 3668
TP 3660 - 3650 - 3640 - 3630 (small volume).
Wish you a safe, effective and profitable trading day.🌟🌟🌟🌟🌟

BNB Strong Resistance Meets Whales Sell Orders – A Good Short BNB Current Market Update
The coin is now trading at its All-Time High , facing a very strong resistance around $900 .
This presents a great short opportunity .
After carefully monitoring buy and sell orders on-chain, I noticed a strong confirmation for the short setup:
Whales and Market Makers sell orders are clustered heavily around the $888 – $890 resistance zone.
✅ My Personal Strategy:
Short Entry: Resistance zone between $888 – $890
🎯 Target 1: $876
🎯 Target 2: $873
Please note:
This is not financial advice – I’m only sharing my personal trades.
Always do your own research before taking action.
👍 Don’t forget to like if you found this useful, and feel free to follow me for more analysis of this kind.
Best of luck 🌹

BITCOIN Quick Buy Trade with the whalesBased on my analysis of on-chain data and liquidity flow, here is what I am seeing:
I've noticed a large buy order in the green zone between 110,600 and 110,500, which may push the price higher.
Additionally, there are large whale buy orders at the strong support of 110,000, with options contracts clustered there.
This will also contribute significantly to pushing the price up.
My Strategy:
✅ I will be taking a buy position if the price drops to the green zone between 110,600 and 110,500.
I will also take another buy position if the price drops to 110,000.
Targets
🎯 TP1: 112,600
🎯 TP2: 113,400
Disclaimer
This is not investment advice. I am only sharing my personal trade setups. Please always do your own research before trading.
Regards 🌹
