SPX500 at Key Pivot – Bearish Below 6365, Bullish AboveSPX500 – Market Overview
U.S. stock index futures rose on Friday after President Donald Trump’s temporary pick for a Federal Reserve governor boosted expectations for a more dovish central bank board.
Technical Outlook
Stability below 6365, we expect a move down toward 6341.
A 1H close below 6321 would likely extend the bearish trend toward 6301.
A 1H close above 6365 could trigger a push toward 6389.
A confirmed break above 6389 would shift the bias to bullish, targeting 6425 and 6453.
Pivot Line: 6365
Resistance: 6389 – 6425 – 6453
Support: 6341 – 6321 – 6301
Community ideas

ADA - Time to buy again! (Update)Be careful with ADA !!!
we can hope that the price will act like a Crab pattern and the price will grow well.
I expect that the price will grow very quickly...
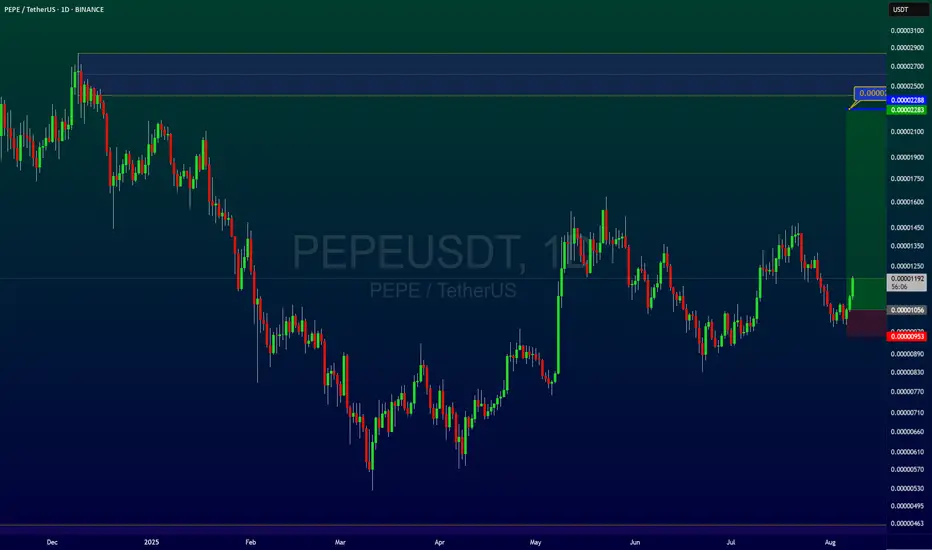
PEPEUSDT AND LONGPOSITIONAnd Pepe is a lovely and popular cryptocurrency and a great buy trading opportunity for the next three to six months with a great risk to reward.
Follow me and boost my analysis for timely and very low risk purchases and great signals.
Contact me in the comments section or private message
My #3,400.80 Medium-term Target deliveredAs discussed throughout my yesterday's (and many other analysis) commentary: If you have been Buying every dip as per my suggestion you would be in excellent Profits now. I have been Buying Gold from my #3,357.80, #3,367.80, #3,372.80 and #3,378.80 key entry points (last batch of Buying orders closed with Target late U.S. - early Asian session last night).
Technical analysis: Gold is under unprecedented Volatility (however with Bullish underlying trend) with Gold (Xau-Usd Spot) and the Futures price on a tight spread. This is of course the product of heavy speculation in the Metals market, fuelled by the expectation that the Fed’s new talks will be accepted. Needless to mention, this environment is Gold friendly. Technically I do see current aggressive decline in form of a correction as not sustainable however I cannot approach current configuration Technically since these are Fundamentally driven sessions but I do expect a slight pullback back towards #3,352.80 - #3,357.80 only for Gold to soar even more, as the main Support and Higher High’s High’s / Low’s cluster is nearby (#3,357.80 - #3,367.80). Despite Bond Yields stabilization, the continuous Low’s on DX on parabolic decline are adding Buying pressure on Gold and limiting all Selling advance which I am utilizing to it's maximum with my set of Buying orders.
Technical analysis: Gold is Trading on my predicted values as I really don’t mind current consolidation candles within newly formed Hourly 1 chart's Neutral Rectangle. Price-action has made marginal High's on Hourly 4 chart with #3,409.80 (local High's I mentioned earlier that can stall the uptrend) showcasing strong durability. If #3,400.80 benchmark however gets invalidated on High Volume (the last #3-session horizon had been really strong however ahead of local Resistance zone test very anemic) then I can call a test of the #3,427.80 Higher High's extension which represents my next Short-term Target. Gold is extremely Overbought however there are no signs of uptrend exhaustion as I don’t see any firm reason why #3,400.80 benchmark wouldn’t be re-tested within #2-session horizon. Remember, Weekly chart (#1W) still needs a slightly Lower Price (mentioned on previous remarks) before further uptrend as I mentioned that Gold dips only to rise more (Buying accumulation). DX is testing my Higher Low’s heavy Resistance zone as I haven’t got any reservations or doubts regarding its correlation to Gold.
My position: I have re-Bought Gold from #3,382.80 many times throughout yesterday's session and did final aggressive set of Buying orders on #3,388.80 calling for #3,400.80 benchmark late U.S. session which was delivered. I have closed all on #3,400.80 benchmark utilizing current upside push to it's maximum however Gold extended the rise towards #3,409.80 even. I stayed awake and re-Bought #3,395.80 few times since I knew Price-action will be circling #3,400.80 mark and consolidate. I will call it for this week and take early weekend break as I am more than satisfied with my Profits.

Litecoin: Major Expansion or Still Too Early?Price Action & Key Zones
Litecoin COINBASE:LTCUSD BINANCE:LTCUSDT continues to move within a multi-year consolidation range. The monthly chart clearly shows the range that has held since 2022. Key levels to watch:
Resistance at 145–150 USD — a key seller zone that has repeatedly acted as a reversal area.
Zone 150–180 USD — monthly imbalance, likely to serve as major resistance on breakout.
Range 195–270 USD — bearish order blocks, which will also act as overhead resistance.
On both monthly and weekly timeframes, LTC appears to be in a phase of accumulation or reaccumulation. A breakout from this structure will likely take time.
Wave Analysis: Two Scenarios
1. Base scenario : LTC is still forming a contracting triangle. Currently, it is developing wave D, which should test the monthly imbalance in the 150–180 range. After that, a correction in wave E (bearish phase) is expected, followed by a potential upward impulse.
2. Alternative scenario : the triangle is already complete, with wave E having formed at $62 in December 2024. A new upward expansion has begun. However, this version is not supported by the triangle’s geometry — none of its sides align with the 0.618 Fibonacci ratio. Also, proper distribution in such cases typically takes at least 6 months, and BTC might not have that much time left in its cycle.
Therefore, I stick with the base scenario: LTC is still in the accumulation phase.
Targets & Timing
Near-term targets: $107 → $128 → $147 (December high).
Maximum target for this cycle — $180, where a major reversal or distribution may occur.
On the 4H chart, a 5-wave impulse structure formed from April to May (likely wave A), followed by a sharp correction. Currently, wave C appears to be unfolding, and based on Fibonacci extensions, it could reach between $128 and $180.
Fundamental Drivers for Growth:
1. Litecoin remains a reliable payment network, offering fast transactions and low fees — often referred to as “digital silver.”
2. LTC mining is synchronized with BTC, making it a logical choice for certain miners.
3. In many regions, LTC is actively used for cross-border transfers and capital movement.
4. Undervalued compared to other altcoins, with no centralization concerns or SEC scrutiny — this could attract more institutional interest.
5. ETF Potential: after BTC and ETH, Litecoin could be the next natural candidate for a spot ETF. If approved, this could trigger a significant surge in interest and liquidity.

Gold holds its bullish momentum - Strategy 1000 pips ? Hello everyone, what do you think about gold prices?
Yesterday, gold ended the session near the key psychological level of 3,400 USD. Overall, the metal remains in a short-term uptrend.
Some immediate supporting factors include:
-Concerns about the US economy – The Fed may soon have to cut interest rates, weakening the USD and making gold more attractive.
-Geopolitical uncertainty – Trade tensions between the US and India over Russian oil imports are prompting investors to turn to gold.
-Financial market volatility – Global equities show signs of a pullback after a strong rally, driving defensive capital flows into gold to reduce portfolio risk.
From a technical perspective: XAUUSD is maintaining a steady upward trend after breaking out of its previous down channel and forming a Rising Wedge pattern. On the chart, prices are consistently creating higher highs and higher lows, with the range narrowing over time — a sign that the market is consolidating before a potential breakout.
Currently, the lower boundary of the wedge is acting as support. If prices hold above this level, the primary scenario remains a move higher toward the 3,433 to 3,450 USD resistance zone. Conversely, if the wedge’s support is broken, the price could retrace to 3,350 USD before the uptrend resumes.
And you — what’s your view on XAUUSD’s next move? Share your thoughts in the comments!

XAUUSD_1H_SellGold Analysis Short and Medium Timeframe Elliott Wave Analysis Style The gold market has completed five upward waves and is currently at the end of the upward wave. Given the formation of the corner market pattern, it could enter a reversal and decline towards $3,333.

GOLD (XAUUSD): Road to 3430
Quick update for my yesterday's analysis for Gold.
The price broke through the trend line with a local Break of Structre BoS,
updating an intraday-high.
The road to 3430 is now empty, and the market will most likely
continue rising steadily to that.
❤️Please, support my work with like, thank you!❤️
I am part of Trade Nation's Influencer program and receive a monthly fee for using their TradingView charts in my analysis.

NATGAS WILL FALL|SHORT|
✅NATGAS made a retest of the
Strong horizontal resistance level of 3.150$
And as you can see the price is already
Making a local pullback from
The level which sends a clear
Bearish signal to us therefore
We will be expecting a
Further bearish correction
SHORT🔥
✅Like and subscribe to never miss a new idea!✅

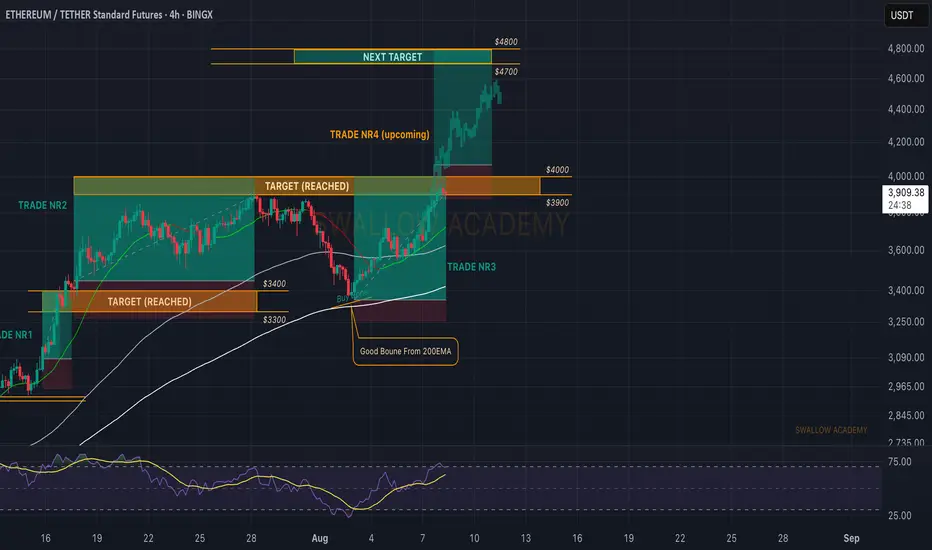
Ethereum (ETH): Caught 45% of Movement in Total | $4800 Is Next3 trades we had on ETH, in combined 45% of market price movement. Now that we are at the end of the current week, we are going to look for a proper breakout from $4000, where then we will be opening yet another long with the target being at $4800.
Swallow Academy
ETH Started Another Impulsive Wave!ETH Started Another Impulsive Wave!
Today ETH ended another bullish wave and is expected to rise further.
The price reaction looks good so far. The market is expecting a rate cut by the FED during the September meeting. According to Reuters, the chances of a rate cut by the FED increase to 85.5%.
It seems that the cryptocurrency market is also absorbing the news and ETH could benefit from this volume in the short term to rise to 3850.
You may find more details in the chart!
Thank you and Good Luck!
PS: Please support with a like or comment if you find this analysis useful for your trading day

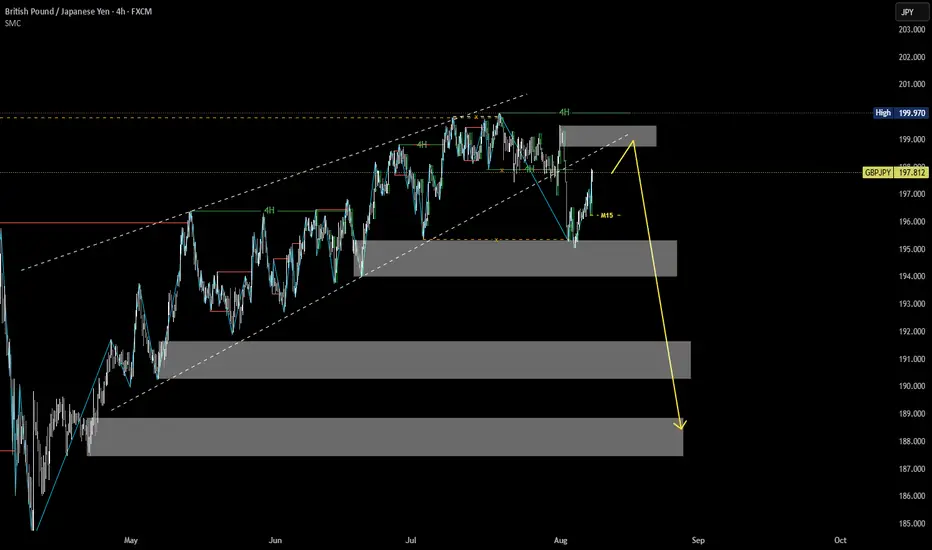
Market Structure Analysis of GBPJPY on the 4H TimeframeMulti-Timeframe Context (HTF: 4H, LTF: M15)
The main trend on the 4H chart is bearish.
Price is currently in a retracement phase (pullback).
On the M15, price is in a bullish short-term structure.
We monitor the M15 market structure closely to look for signs of weakness and identify high-probability short entries in alignment with the 4H downtrend.
Is It Time for Alts? | 8-8 Double Luck Live Update🤩🍀 Is It Time for Alts? | 8-8 Double Luck Live Update 🐉💫
8-8 -2025 — In Chinese culture, 88 means double fortune, and in numerology it’s the angel’s number for alignment and abundance.
Feels like the perfect day for a market check.
Ethereum (ETHUSD)
✅ Tagged $4,000 exactly as tracked in my Unicorn Breakout ideas (Part 1 & Part 2).
💨 First-touch rejection is normal — needs time to reload for any break above $4K.
Bitcoin (BTCUSD)
⚡ Holding above 115,800 — key structural support.
📈 As long as we stay here, bullish bias remains intact.
🎯 Next upside targets: 120k – 138k.
Bitcoin Dominance (BTC.D) — The Game-Changer
📉 Finally dropped under 60.80%, which is now major resistance.
💎 Staying below this favors altcoin strength, as long as BTC stays stable or climbs.
⚠ If BTC.D reclaims 60.80%, the edge shifts back to Bitcoin leadership.
Altcoins Outlook
✨ ETH’s $4K tag sets the stage for alt rotation.
🔑 Conditions look favorable when:
BTC > 115,800
BTC.D < 60.80%
💥 Weekend could be strong for selective alts.
S&P 500 (SPX)
📊 Still in the same range since rejection at resistance.
🚦 No breakout yet — waiting for a catalyst.
Summary:
ETH hit $4K, now consolidating.
BTC stable over support.
BTC.D under resistance = potential “Alts Window.”
SPX sideways.
Plan: Hunt for strong alts while BTC.D stays under 60.80%. Guard BTC’s 115,800 support like a hawk.
📊 Charts attached: BTCUSD, BTC.D, ETHUSD, SPX
One Love,
The FXPROFESSOR 💙
Disclosure: I am happy to be part of the Trade Nation's Influencer program and receive a monthly fee for using their TradingView charts in my analysis. Awesome broker, where the trader really comes first! 🌟🤝📈

Hedera (HBAR): Looks Good For Another 15% Upside MoveAnother BOS that caught our attention happened on HBAR coin, where recently after the local breakout we are seeing a smaller struggle, which might send the price back for a quick retest, where we will be sitting in one of our entry zones. forlong position.
The second one is the other green line, which would mean. we form another BOS (on top of the current BOS). Seems good so as long as we are above the 4 hr 200 EMA, we are bullish!
Swallow Academy

Keep buying a big piece of $CAKE!This chart is just beautiful. It has everything you want for a solid consolidation:
Bullish structure
Consistent tests of highs
Flipping support/resistance levels within the range
Holding above previous yearly swing lows
Monthly trend is active and aligned with time@mode — can’t ask for more.
If CRYPTOCAP:BNB is running strong and looking good, this one should follow — similar to what NASDAQ:RAY did when CRYPTOCAP:SOL had that impressive run.
BINANCE:CAKEUSDT

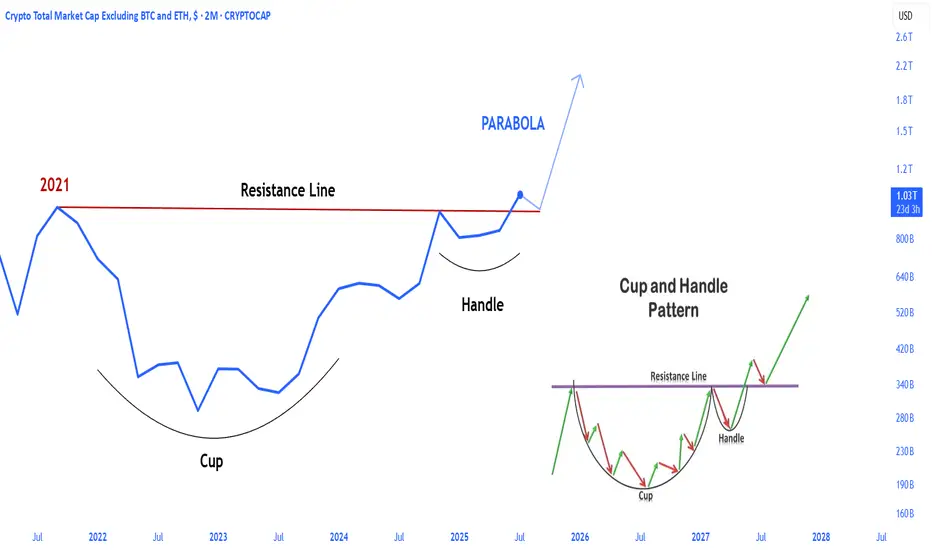
SOMETHING BIG IS COMING! ALTCOINSThe total3 index, an important metric for altcoins, broke out of the handle cup formation that began at the 2021 all-time high level. After the retest phase in the coming period, it will transition to a sharp rise phase.
BTC recovers, trying to get back to 120k💎 WEEKEND BTC PLAN UPDATE (08/08)
🔍 BTC Analysis (H4 timeframe):
1. Elliott Wave Structure:
• BTC is following an impulsive wave sequence 1–2–3–4–5.
• Currently in wave (4) and may bounce to complete wave (5) around the ~119,000–120,000 zone.
2. Key Support Levels:
• 116,000–116,200: Support area for wave (4) – can look for buying opportunities here if confirmation signals appear.
• Below that, strong support lies around 115,200–115,600 (confluence of 0.5–0.618 Fibonacci retracement + MA200).
3. Resistance Levels:
• Previous high around 117,500 (Fibo 1.0) is the nearest resistance.
• Wave (5) target: 119,400–120,000 (Fibo 1.618).
4. Trading Plan:
• Buy at 116,000–116,200, SL below 115,600.
• Expected TP: 117,500 – 119,400.”

US2000 Bearish Alert: Institutional Shorts Spike 300%, TechnicalInstitutional Sentiment Shift
Net short interest exploded from –30K in early July to –90K by early August—a 300% jump in bearish conviction.
Daily Chart:
On August 1, US2000 closed below key support, carving a lower low—the first technical indication of a bearish reversal.
Weekly Chart:
A clear bearish engulfing candlestick reinforces the likelihood of further downside.
Macro & Market Backdrop:
• The Fed remains hawkish, quashing near-term rate cut expectations.
Reuters
• Small-caps continue to underperform—Russell trades rich but offers less structural strength compared to large-caps.
MarketWatch
• With stagflation risks rising, small/mid-cap companies could face underperformance and tighter financing conditions.
MarketWatch
Bottom Line:
With institutional short positioning intensifying, market structure turning bearish, and macroeconomic challenges mounting, the US2000 is poised for further pressure. Traders—watch for follow-through declines.

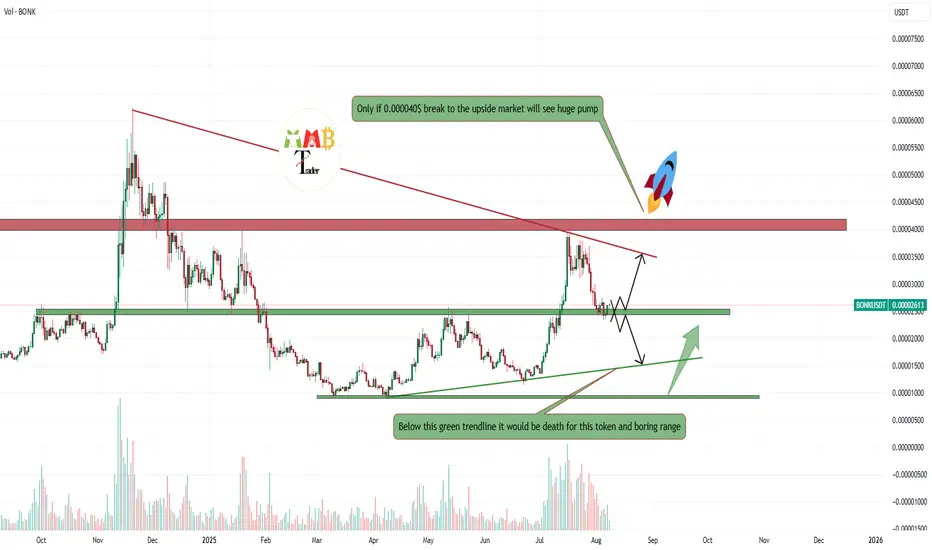
BONKUSDT stuck in a boring range breakout is needed Market here is not that much exciting now and it get stuck between two major Trendline and from breakout to the upside we are +50% far away and i think in this bull run that breakout may not happen even and we may only see that rise again to red trendline and after that more range and dump.
But only if 0.000040$ break to the upside then here we can expect more rise and gain like rocket.
DISCLAIMER: ((trade based on your own decision))
<<press like👍 if you enjoy💚
Grasp the trend accurately and have a crazy weekend!After testing the 3380 support level several times in a row today, gold maintained an oscillating upward trend. Today's layout of 3380 repeatedly went long, and 3400 shorts were all successfully closed with profits, with a total profit of 580pips. Currently, gold is oscillating at a high level in the 3404-3380 range. The possibility of a direction choice cannot be ruled out in the evening. If the market continues to be bullish in the evening, it is necessary to pay attention to whether the price will fall below 3380 when it tests the support level for the third time. If the support level is effectively broken, it is expected to fall to the key support level of 3370. If the price firmly stands above the 3400 mark, it may continue to test 3410. If there is no breakthrough either above or below, it will still maintain a range of oscillations, and the idea of selling high and buying low will be the main focus.

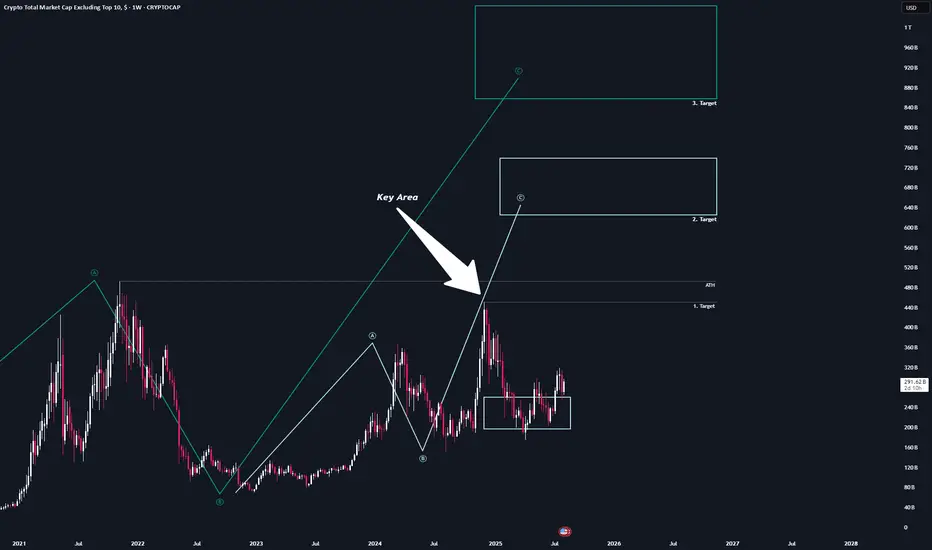
Once it breaks, there are no rulesWhat’s good Chambs 👑
In my eyes, the November high is one of the most important levels to keep an eye on.
If we manage to break above that high — and then the all-time high — with one or two strong green weekly candles, we'll likely reach the first major target zones of this bull run.
FOMO will kick in hard.
No one knows when the next 2021-style bubble will come. Maybe in a year, maybe in five—I don’t know. But when it comes, it will be massive. People underestimate how fast information spreads in today’s world. 998 out of 1000 people scroll three hours a day through TikTok and Instagram.
The classic guy who jerks off twice a day and blasts himself with 14 different dopamine hits in 10 minutes on a Monday morning—he’s gonna get fucked as hard as never before.
Sorry, but that’s just how it is.
There’s no other outcome.
How could there?
Most people enter the market when most people enter the market - And that’s right at the top.
Once it starts running, it’s so easy to pull everyone in.
Everyone is a free-kill.
It will rise, and everyone will feel like a genius during that time. Because guess what? Everyone will be right—price is going up, so how could you be wrong?
Egos will explode.
Even Max, 16 years old, who’s never even said the word “crypto” in his life, will turn his $1,000 into maybe $5K or $10K. He’ll feel like the smartest person alive, his 10 friends will believe him, and they’ll act just as incompetent like him.
Until one day—it’s all over. A sudden –40% portfolio drop. That’s if they don’t blow up their accounts earlier with futures gambles or chasing meme pumps.
It will explode up and disappear just as fast.
The worst part? Everyone will watch every single YouTube analysis video. At first, you won’t know what to do with the information, so you just absorb it. The guy might be right, but you forget that the he lives in a completely different position and perspective than you. For him, it’s daily analysis—he says what he thinks might happen but doesn’t change his plan based on that.
You, on the other hand, treat that one video as an all-or-nothing signal.
You need a plan—one that tells you exactly what to do no matter what happens. If you don’t have that plan, you’re done.
100%.
There’s no way around it.
And you won’t find this plan in a YouTube video—
Not in one, not in two, not even from your favorite crypto influencer.
Turn your own brain on.
Create a plan that fits you.
Be dependent on no one.
Control everything yourself—otherwise, you’re done.
I’m excited.
maybe not.
How can I protect my friends? How can i protect myselfe?
Can I even protect them?
Or is it something everyone has to go through once?
I don’t know.
Can i protect myselfe? - Yes.
I’m excited.
Amen🙏 - praying for all the people who will read this post when i repost it. Maybe it won’t even take that long😉😘
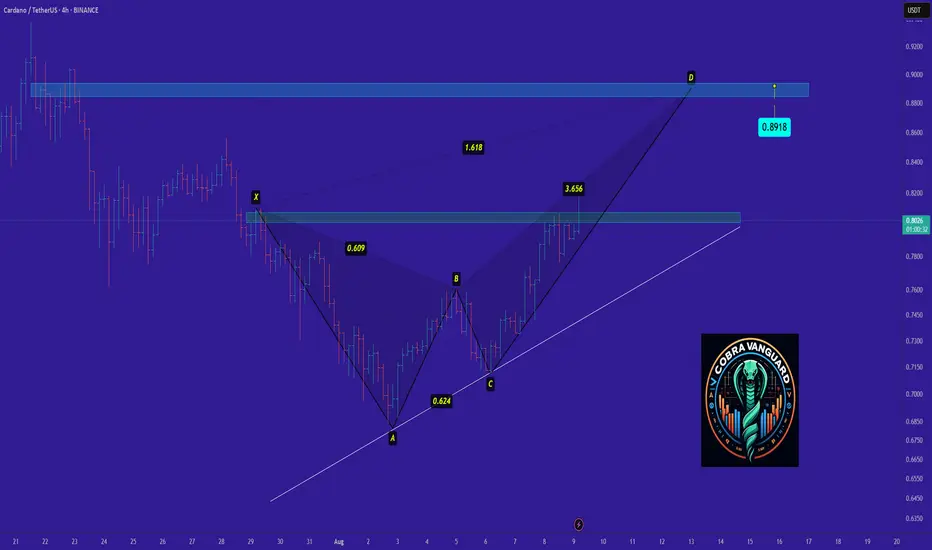
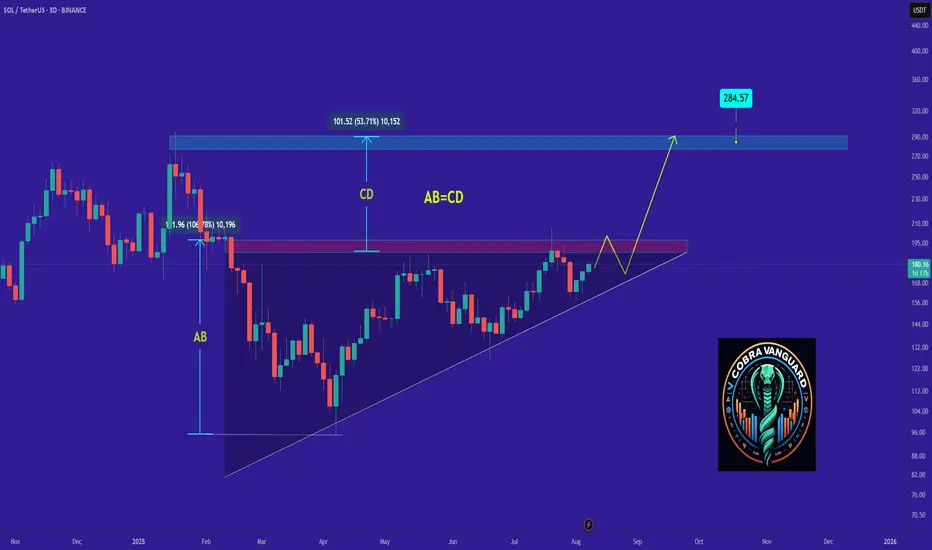
SOL's Situation, A Comprehensive Analysis !!!The price on the 3d timeframe is within an ascending triangle, which can be promising. If the price breaks this pattern with bullish candles, it could easily rise by the distance of AB=CD .
Best regards CobraVanguard.💚
MYX/USDT - Short setup exactly that was plan but i was not online any way order filled and short setup is active toward major correction , but the larger structure still points toward further downside potential. Price action remains in a corrective phase, and momentum favors sellers for a deeper retracement toward the major psychological and technical zone at $1.00. This level aligns with historical support and could serve as the next significant test before any sustainable reversal.
