SP500 Bullish Divergence Detected (SPY)Bullish divergence of the SP500 and NYSE Advance Decline Line (ADL) is one of the most powerful and reliable "leading" indicators available. Here we see the ADL make a new high (a higher high) while the SP500 does not make a new high. This divergence indicates that market breadth is markly improving, which will ultimately drive the SP500 up to new all time highs in the coming weeks or months.
I am well aware of discussions about bubble fears and valuation concerns. It's important to note that the market can continue to increase for some time even with these concerns, so it would be a mistake to get out of or short the market at this time. Also, the technicals are pointing higher, not lower.
As long as this train keeps chugging, we should stay on this ride! Go long on SPY, VOO, QQQ!!!
Community ideas

Ethereum - Another -30% correction!🥊Ethereum ( CRYPTO:ETHUSD ) continues the bearmarket:
🔎Analysis summary:
Just over the past couple of weeks, Ethereum has already been correcting about -40%. This happened due to another failed all time high breakout sending prices lower. And Ethereum can drop another -30% before it will then retest a major confluence of support.
📝Levels to watch:
$2,500 and $ 2,000
SwingTraderPhil
SwingTrading.Simplified. | Investing.Simplified. | #LONGTERMVISION

Review and plan for 28th November 2025 Nifty future and banknifty future analysis and intraday plan.
This video is for information/education purpose only. you are 100% responsible for any actions you take by reading/viewing this post.
please consult your financial advisor before taking any action.
----Vinaykumar hiremath, CMT

Gold Extends Rally Toward New Highs as Fed Cut Bets IncreaseGold Extends Rally Toward New Highs as Fed Cut Bets Increase
We are following gold from 4030 to the current price and the price has already reached our first major target at 4150.
Currently, gold came out of a strong area near 4130. We can also see that Gold wanted to fall again but stopped near 4110.
After the weaker-than-expected US PPI data, the market is expecting a possible rate cut from the FED meeting in December, thus increasing the chances of gold rising further.
Volume is still low but it may increase during the coming days. Gold appears poised to reach 4,230 and 4,290.
Our analysis did not change because there is nothing to change :)
You may find more details in the chart!
Thank you and Good Luck!
❤️PS: Please support with a like or comment if you find this analysis useful for your trading day❤️

Gold Bears Strengthen Below 4175 With Target at 4050Gold (XAUUSD) is currently showing signs of exhaustion near the 4176 resistance zone, where sellers have consistently reacted in recent sessions. This level aligns with a strong supply area and a psychological barrier, making it a favorable point for short positions.
A sell entry from 4176 aligns with the ongoing corrective pressure and the potential for a deeper pullback as buyers struggle to maintain momentum.
Key Levels
Entry 4176
stop Lose 4210
Target 4050

BITF | WeeklyNASDAQ:BITF — Quantum Model Projection
As outlined in prior analyses, NASDAQ:BITF surged 35.7% directly from the apex of the convergent support-equivalence lines✨ — the standout rally of the week, that aligns perfectly with the upside momentum highlighted by the Q-model.
Wave | Trend Analysis
As noted earlier, the Leading Expanding Diagonal in Primary Wave ⓵, which originated in December 2022, outlines a potentially bullish early-cycle structure, signalling an emerging transition into an accumulation phase. Within my framework, such motive patterns often precede strong impulsive advances, reinforcing the broader bullish narrative as the Cycle-degree uptrend continues to unfold.
Following the deep retracement of Primary Wave ⓶, the impulsive extensions anticipated within Primary Wave ⓷ project toward Q-targets of $8.08 🎯 in the near term and $28.88 🎯 in the medium term.
🔖 In my Quantum Models methodology, Q-targets are defined as high-probability possibilities generated by the confluence of equivalence lines. Additionally, these equivalence lines serve as structural anchors, shaping the internal geometry of the model and guiding the evolution of alternative paths as the price progresses.
#StocksToWatch #MarketAnalysis #TechnicalAnalysis #ElliottWave #WaveAnalysis #TrendAnalysis #FibLevels #FinTwit #TradingView #Investing #BITF
#BitfarmsLtd #Canada #DataCenters #BitcoinMining #CryptoMining #AIStocks #HPC #AI #BTC #Bitcoin #BTCUSD CRYPTOCAP:BTC NYSE:AI

Gold H1 – Will 4212 Hold and Drop to 4160 Today?🟡 XAUUSD – Intraday Smart Money Plan | by Ryan_TitanTrader (27/11)
📈 Market Context
Gold is currently trading within a rising institutional channel after strong H1 displacement. The market is compressing into a liquidity-rich consolidation phase — a classic Smart Money trap environment before engineered expansion.
What Smart Money desks are targeting today:
• Expectation of USD strength shaping bearish bias
• Liquidity sweeps above internal range highs
• Consolidation fakeouts to induce retail mis-positioning
• CHoCH/BOS confirmation required before real directional move
The chart shows equal liquidity zones positioned at premium (sell opportunity) and discount (re-entry buy region).
🔎 Technical Framework – Smart Money Structure (H1)
Current state = Accumulation / Redistribution phase
Liquidity map highlighted zones:
• Premium liquidity zone: 4212 – 4214 (target for short trap)
• Discount liquidity origin zone: 4165 – 4163 (higher timeframe demand re-entry)
• Equilibrium / Chop zone: 4180 – 4195 (no trade unless displaced)
• Trendline support: ~4173 region (must break for downside continuation)
Expected sequence:
Sweep → CHoCH/MSS → BOS → Displacement → Retest (FVG/OB) → Expansion
🎯 Trade Plans for Today
🔴 SELL GOLD 4212 – 4214 | SL 4222
Thesis: Liquidity sweep at premium highs before bearish displacement
Entry activation rules (must wait):
• Price taps 4214 liquidity pocket
• Bearish CHoCH/MSS + BOS down on M5–M15
• Entry taken at FVG fill or order block retest after BOS
Targets:
1. 4200 (first reaction)
2. 4187 – 4185 (BOS retest zone)
3. 4170 (channel mid-equilibrium)
4. 4165 – 4163 (H1 demand retest / profit core)
🟢 BUY GOLD 4165 – 4163 | SL 4143
Thesis: Discount origin tap for impulse continuation buy
Entry activation rules (must wait):
• Price sweeps into 4163 pool
• Bullish CHoCH/MSS + BOS up on M5–M15
• Strong bullish rejection wick + FVG fill confirmation
Targets:
1. 4185 – 4187 reclaim zone
2. 4200+ institutional expansion target
3. 4212+ premium revisit
⚠️ Risk Management
• Avoid trading inside 4180 – 4195 unless displaced
• Do NOT interpret sweeps as trend entries — they are traps
• SL = structure invalidation, no averaging in consolidation
• Reduce size during monetary headlines unless MSS confirms
📝 Summary
Gold is currently in engineered liquidity mode. Expect either:
• Sweep 4214 → MSS/BOS down → drop into 4163 discount retest,
or
• Tap 4163 → bullish MSS/BOS up → expand toward 4200 – 4212+
Today = confirmation-based execution only, not trend chasing.
📍 Follow @Ryan_TitanTrader for daily Smart Money updates.


SOL/USDT: Strong Uptrend – Short-Term Buy Opportunity!We are witnessing an excellent opportunity on the SOL/USDT chart, as Solana (SOL) continues to maintain a strong upward trend. In the context of a gradually stabilizing cryptocurrency market and positive news about Solana's ecosystem development, SOL is entering a significant price increase phase.
Currently, SOL/USDT is trading within an ascending channel and has broken out of the 140.00 support zone . The price is fluctuating around 143.66, close to the 140.00 support, which could see a slight pullback before continuing the upward momentum.
The next target for SOL/USDT in the short term is 155.00, where it might encounter some resistance. However, if the price maintains above 140.00, there is a high probability that SOL could continue its strong upward momentum towards 156.00 and even beyond.
Trading Strategy:
Buy SOL around the 140.00–143.00 range, with a short-term target of 155.00 and 156.00.
Set stop-loss if the price breaks below 139.00, as this is a crucial support level within the current uptrend channel.
In conclusion, SOL/USDT is maintaining a solid uptrend, and with positive signals from both technical indicators and fundamental factors, buying around the support zone is a reasonable strategy to capitalize on the upward movement.

XRP short term bullish setupPrice pushed strongly upward, then formed a small descending trendline as it corrected.
That correction held above support, creating a tight consolidation range.
We now have:
Break of the trendline
Retest of the broken structure
Bullish continuation setup forming above 2.18 support
As long as price stays above 2.18, buyers remain in control, and continuation toward 2.3169 is likely.
Invalidation:
Below 2.1374, the bullish idea fails.

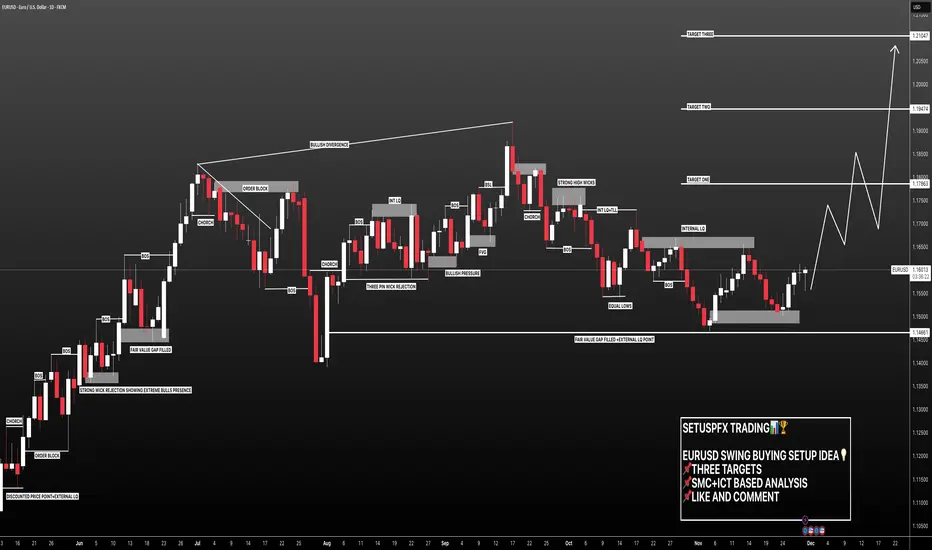
EURUSD: Reversal Almost Confirmed +1500 Pips In Making! FX:EURUSD
As outlined in our previous analysis, the price fell further than anticipated. Given this region, we believe the price has reversed from a crucial level. Consequently, we anticipate a significant price increase. A swing bullish move is possible, potentially gaining around +1500 pips if successful. Please like and comment if you enjoy our work.
Good luck and trade safely!
Team Setupsfx_
pippinusdtSupport and press the rocket to cheer me up
Observe the ten percent loss limit
Stay away from Bitcoins
Feel free to buy and sell and post your comments

Decent Profits on re-Buy ordersAs discussed throughout my yesterday’s session commentary: “ My position: After Profiting on multiple Medium-term Buying orders, I have turned now to more Intra-day calls as announced and am Buying Gold literally from #4,138.80 on multiple occasions and will continue to do so, and will Buy Big if #4,130.80 is delivered. I will not Sell Gold and my practical suggestion is to not Sell Gold at all costs.”
My position : I have engaged multiple Buying orders throughout yesterday’s session on #4,151.80 test and even though Volume was almost non-existent, I was well aware that Gold is Trading within Ascending Triangle and ready to deliver upside break-out. I have kept my order and on market opening Gold delivered slow but steady break1-out of #4,167.80 Resistance and I closed my set of aggressive Buying orders on #4,172.80 extension. I have re-Bought Gold this morning with #4,167.80 entry point and will continue Buying Gold from my key entry points. Congratulations on Profits and have a great weekend!

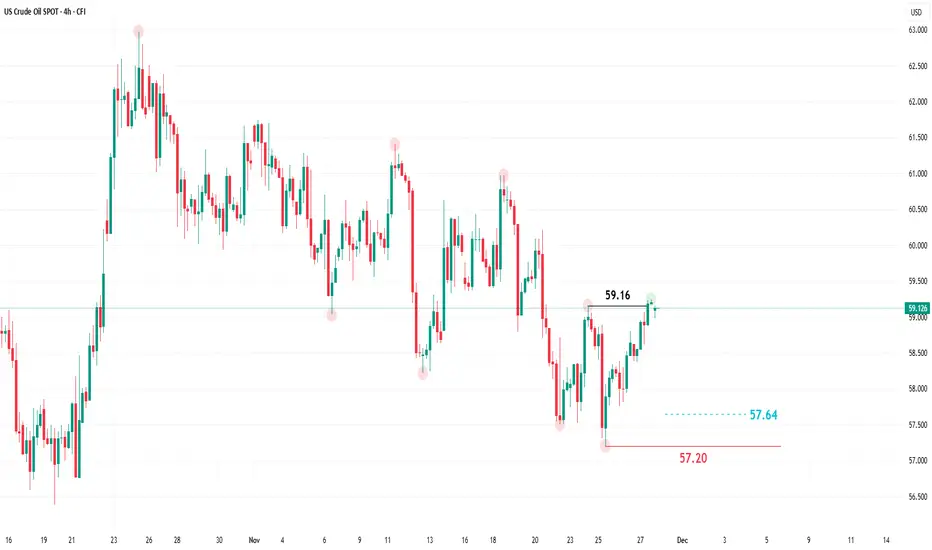
Oil Prices Record Their Worst Monthly Performance Since 2023!Oil prices are heading toward their worst monthly performance since 2023, with Brent crude down about 15% this year due to expectations of a significant global supply surplus. The OPEC+ alliance is expected to maintain its decision to freeze production increases in early 2026, while long-term reviews of members’ production capacities are underway. Forecasts also point to a daily surplus reaching 2.8 million barrels in 2026 and 2.7 million barrels in 2027, adding further selling pressure.
Additionally, geopolitical developments may impact the market, as Russia has expressed readiness to discuss proposals to end the war in Ukraine. This could eventually lead to easing sanctions and the return of Russian oil flows to global markets, which would increase supply and weigh on prices.
On the technical side, the price on the 4-hour timeframe has risen and formed a higher high above the 59.16 level, shifting the trend from bearish to bullish in the short to medium term.
The price may rise directly from the current levels near 59.126, or it may retrace toward 57.64 before rebounding again to target the 59 level.
The opposite scenario to the current bullish outlook would be a decline below 57.20 and the formation of a lower low on the 4-hour timeframe.
Arb important level! Will we hold it? For HTX:ARBUSDT so important hold a level around 0.20 cents!
If we will not hold, the road will be open to invalidation under listing price, in this case we can see unfortunately the price discovery mode!
On weekly timeframe so important, if we want to see uptrend continuation, we should go higher than August high and break the local structure!
After sweep of buy side liquidity the final zone marked block fixation swing trade!
When, and if we will reach this targets, only after that we can check the new updates depends of market conditions of that time!
Even at the bottom and low price volume from sellers looks strong. Trade carefully

GOLD (XAUUSD): Another BoS
A quick follow-up for the yesterday's post for Gold.
The price successfully bounced and broke another intraday resistance,
setting one more local higher high on a 4H.
The market will most likely continue rising following the plan
and reach 4205 soon.
❤️Please, support my work with like, thank you!❤️
I am part of Trade Nation's Influencer program and receive a monthly fee for using their TradingView charts in my analysis.

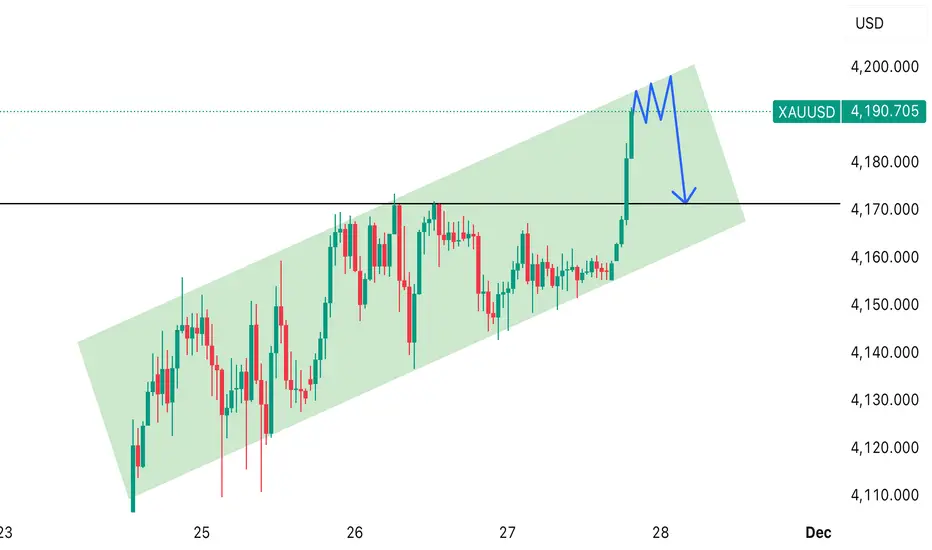
Gold is at the top of the channel and showing rejection, indicatGold (XAUUSD) is moving inside an upward channel. The price has reached the top of the channel and is showing rejection. The blue M-pattern suggests a possible pullback downward, targeting around the 4,170 zone
BCH/USDT Long Set-up— Multiple approaches to the resistance level, reclaim of the 50/200 MA on the daily timeframe, strong and prolonged accumulation that formed after the previous rally. High probability of breaking through the $560 resistance area.
— Entry: $533 (Market buy)
— Stop: $510 — 4.5% price movement from entry to stop (NOT percentage loss)
— Target: $580
Risk per trade: 1% of total account — this is the percentage of potential loss.
Position size: 10% of total account, 10x leverage
RR: 1:2


Elliott Wave Analysis XAUUSD – 28/11/2025Hello my friends, let’s update the Elliott Wave analysis on Gold together to see how the wave development may unfold today.
1. Momentum
Momentum D1
D1 momentum is currently contracting. We need to wait for a strong bearish daily close to confirm a momentum reversal. Once confirmed, the market may enter a downward phase lasting 4–5 days.
Momentum H4
H4 momentum is also narrowing, suggesting a potential short-term downside reversal. However, note the following:
• Price highs and momentum highs are forming higher highs and higher lows, which still supports the bullish structure.
• If H4 momentum truly reverses and moves into the oversold zone, price must break below 4142 to confirm a structural break and signal a genuine trend reversal.
Momentum H1
H1 momentum is turning downward and is aligned with H4. I expect the current price area to be the potential wave top.
________________________________________
2. Wave Structure
Wave Structure D1
The D1 wave structure remains unchanged. With D1 momentum still converging, price action continues to show slow upward movement.
• If price breaks above 4243, the 5-wave structure of the purple Y wave is invalidated.
• In that case, a different wave structure will be triggered (as mentioned in the previous plan), and I will update you when it occurs.
Wave Structure H4
We continue to follow the green ABC corrective structure, with price currently in wave C (green).
• As H4 momentum is in the overbought zone, I expect the current region to be the top of wave C.
• If H4 momentum dips into the oversold zone and price breaks below 4142, this will confirm a structural breakdown.
• However, if momentum enters oversold while price stays above 4142, we must be prepared for a continued bullish move.
Wave Structure H1
Yesterday, the RSI on H1 showed divergence, suggesting a possible completion of wave C. However, with the additional push during the Asian session, wave C likely extended further. Price is now at the target zone calculated earlier.
• With D1, H4, and H1 momentum all preparing to reverse, I expect the current price zone to be the top of wave C.
________________________________________
3. Trading Plan
The current price region remains our preferred SELL zone.
During the next H4 momentum cycle:
• If momentum enters the oversold zone but price fails to break below 4142, we should consider exiting early to protect capital.
Trade Setup
• Sell Zone: 4187 – 4190
• Stop Loss (SL): 4210
• TP1: 4158
• TP2: 4112
• TP3: 4081


Be carefulEverything seems bullish. MACD crossed up, smi and rsi looks like it has some room to run. However, if you look closely we've had a 4 wave down move so far, I believe this was a dead cat bounce and we will have a final 5th wave down to the 630s. We're currently at some resistance, if we continue up than I was wrong, but if we start going down from here get ready to potentially meet the 630s.

SHIB - Shooting Stars That Signal Market CorrectionsSHIB
Before every correction, there always seems to be at least one or sometimes quite a few coin charts that print a whipsawing candle.
And here SHIB has printed a whipsawing Shooting Star - signalling it has reached a key resistance point.
In the short term anything can happen, but that star has fairly high odds to be signalling downside in the pipeline at some point.
Also it is a somewhat choppy ascending line - which could be building cause for downside action.
This is also in tandem with stock indexes potentially reaching bearish inflection point ~ see linked threads 🧐.
This analysis is shared for educational purposes only and does not constitute financial advice. Please conduct your own research before making any trading decisions.
