Bitcoin on the Rise — But the Bat Hasn't Flown Yet
---
🚀 **!** 🦇
We're anticipating a continued bullish move in Bitcoin until it completes the **Bat Pattern** at the key level of **$118,469**. 📈
From there, we expect a reversal — a drop toward **$113,800**. 📉
Stay tuned, drop your thoughts below, and let’s decode the market together.
#Bitcoin #CryptoAnalysis #BatPattern #TechnicalAnalysis #LearnThenTrade
---
Community ideas

DOGE: Golden Cross Incoming After 33% Pullback
This is DOGE on the Daily
This chart is screaming upside potential.
The move began with two higher lows off the 0.786 Fib level at \$0.15924. From there, price blasted through both the 50MA and 200MA straight into the 0.618 Fib at \$0.28336 — an 80% rally.
What followed was a healthy 33% correction, briefly pausing at the 0.5 Fib level (\$0.22135), which sits midway between the long-term 0.786 and 0.618 levels.
The dip stopped right at the 50MA, which once again acted as a springboard — sending price back above the 200MA, the BB center, and reclaiming the 0.5 Fib, which today is holding as support.
A golden cross is now imminent. The last time DOGE saw this setup was in early November 2024, which led to a 200% move.
In my opinion, today could offer a strong long opportunity — with a stop loss below the 0.5 Fib or even the 200MA, depending on your risk profile.
Always take profits and manage risk.
Interaction is welcome.

NATURALGAS TRENDLINE BREAKOUT OR FAKEOUT?Timeframe: 1H Breakout Watch 🚀
Technical Overview:
Natural Gas is testing key horizontal resistance around 272 after multiple rejections. Price is holding above 25 EMA and 55 EMA, showing short-term bullish momentum.
Key Levels to Watch:
• Resistance: 272 – 274
• Breakout Target: 278 – 280 (if sustained above 274)
• Support: 266 – 264 zone
Trade Idea:
• Bullish Scenario: Break and hold above 274 → Upside potential toward 278 – 280.
• Bearish Scenario: Rejection at resistance → Pullback toward 266.
Bias: Bullish if 272 holds as support post-breakout.
📊 Pattern: Range breakout attempt with potential 2.7% upside.
#NaturalGas #MCX #Commodities #PriceAction #Breakout #PowerCommodityTrading

$ADA lookin' goodBottom Line Up Front (B.L.U.F)
CRYPTOCAP:ADA looking strong
If you have followed my thesis, we are still on track and on time
Beware of the FUD, FUD always presents itself when haters are hating. Recently there have been articles slamming the lack of pump as ADA price has not "skyrocketed" after IOG being awarded 70M from treasuries to conduct system upgrades. This is plain non sense, it takes time to correctly liquidate the tokens ( which is underway ) and to complete the upgrades ) this is pure manipulation by authors and publishers
There have been glitches if the Glacier program: as expected, most glitches and frustrations are due to cold wallet manufactures NOT upgrading their software to allow for the larger sizes of data required for the Glacier, this is not a native problem but isolated issues with cold wallet products who have not done their duties to support their customers.
Cardano has never played into the Manipulators game and has always acted transparently and fair, that makes a bit of an uphill battle as the masters of the market prefer guaranteed positions for quick and huge gains. follow the narratives and see the MOTIVES.
The positives
if you are a y o r o i user they had by far the most seamless integration ALL IN WALLET, compliments to Cardano for that, which displays the quality reliability and ease of use native to Cardano.
Cardano CRYPTOCAP:ADA holders will receive CRYPTOCAP:ADA and $NIGHT for staking ( once the Midnight Network is live and the thaw has happened.
ETF approval nears.
Fundamentals are strong, Nothing significant to report (NSTR) there.
I am sitting back and enjoying the ride.
all of this is my opinion, NFA, DYOR, let me know what you think?
see you at the top, Liminal OUT

Ethereum Outperforms Majors as Crypto Sentiment Shifts Again 🌐 Ethereum Outperforms Majors as Crypto Sentiment Shifts Again 🔄📊
Trump talks 401(k) crypto 🗞️, BTC reclaims the key $115,800 level 💪, but today we zoom into what the charts are screaming — and Ethereum is leading.
While headlines fly, structure never lies. Let’s compare ETH against other majors 👇
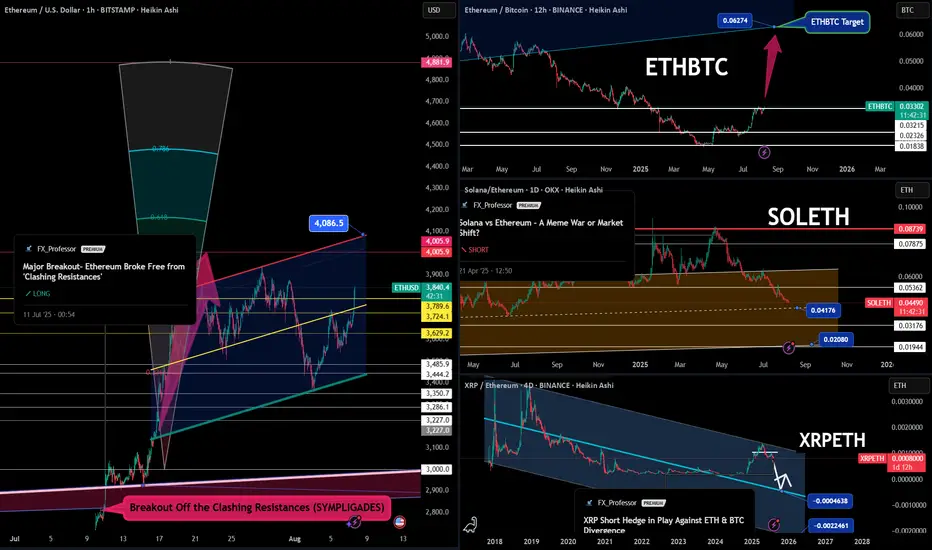
🔷 ETHUSD – The Breakout That Sparked It All
📈 ETH broke free from the "Clashing Resistances" zone (SYMPLIGADES).
It’s now targeting $4,086.5, with potential expansion toward $4,881.9 if momentum holds.
🟨 Key zones:
$3,744 = retest zone
$3,830 = resistance-turned-support
$4,005 = psychological milestone
The 1-2-3 model is alive and well.
And ETF news + BTC support is the fuel ETH needed. 🔥
📊 ETHBTC – The Hidden Strength Ratio
This is what most traders miss:
➡️ ETHBTC has been in stealth accumulation mode.
Now aiming for 0.06274 — a huge reclaim zone not seen since mid-2022.
This ratio matters because it signals altcoin rotation, not just price action.
💀 SOLETH – The Bleed Continues
We called it months ago:
Solana may have great tech (Rust, speed), but it’s paying the price for memecoin mania and diluted narrative.
SOLETH is in freefall — currently below 0.045, with support at 0.04176 and 0.02080 next if weakness continues.
ETH is eating market share back.
📉 XRPETH – Short Hedge in Play
XRPETH structure remains bearish.
Even after multiple divergence plays, XRP continues to underperform against both BTC and ETH.
Target zones:
🧊 0.00004638
🧊 0.00002246
XRP fans — this is not personal. This is chart-based reality.
🗞️ Don’t Forget the Macro Backdrop:
SEC just greenlit direct BTC/ETH usage in ETF flows
Trump hints at crypto-friendly 401(k) policies
China is brewing something (rumor or tumor — still unclear 😅)
BTC just reclaimed $115,800, setting sights on $122,795 → $132,595
This market isn’t waiting for confirmation — it’s moving based on structure.
🚫 What I Avoid in This Cycle:
❌ Memecoins (low trust, no ETF tailwind)
❌ GameFi (zero relevance right now)
❌ Ghost L1s (no users = no bids)
🧠 Final Take:
Ethereum is clearly leading the pack.
BTC is reclaiming its throne.
Solana is bleeding relative to ETH.
XRP is stuck in divergence hell.
So we trade the structure, not the hopium.
📈 Alt season won’t be a meme — it will be rotation-driven, narrative-backed, and ETF-aligned.
📽️ Full explanation in my previous video post — check it out if you want full breakdown on ETFs, ETH’s structural strength, and the geopolitical backdrop with China.
One Love,
The FXPROFESSOR 💙
Disclosure: I am happy to be part of the Trade Nation's Influencer program and receive a monthly fee for using their TradingView charts in my analysis. Awesome broker, where the trader really comes first! 🌟🤝📈
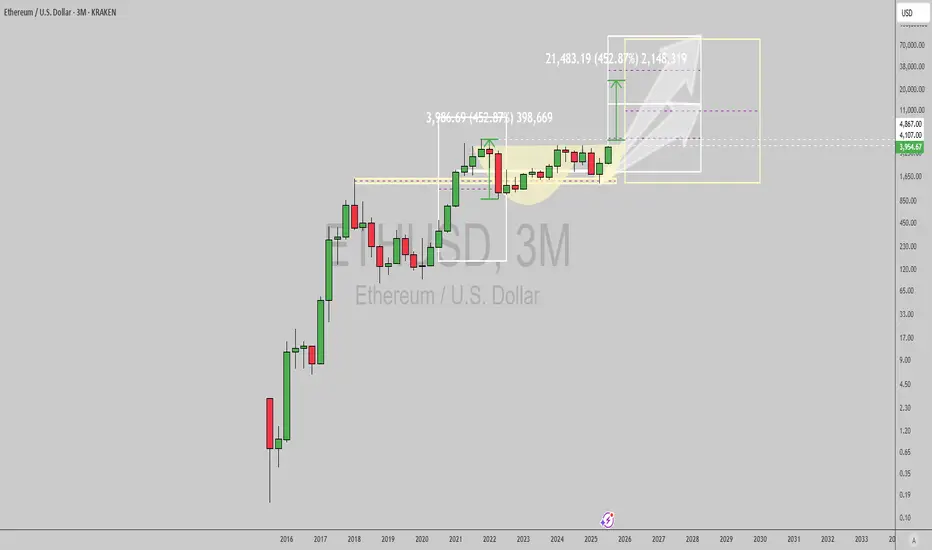
$ETHUSD: Long term trend and cup and handle pattern...Ethereum is finally very close to breaking out into a new 52wk high following a long term basing pattern that looks like a classic cup and handle. Timemode signals warned us of its bullishness earlier, as the daily, weekly, monthly and now quarterly trends turned bullish one after the other since April this year.
If you're sidelined or short, join the bulls and go long ASAP. Risk is a drop under $1715 for the long term patterns at play here, projected targets range from 10k to 95k long term. Fundamentals as you probably know favor a massive bullish trend as ETH transaction count breaks ATH, institutions race to acquire more ETH day to day, ETF flows are steadily bullish and regulations have become favorable for the growth of defi via stablecoin and RWA adoption, as well as potential for new defi primitives and existing ones to gain traction with widespread use.
Ethereum defi now is secure and solid enough, and can handle the required throughput, and the wheels are in motion for a spectacular move from here.
Best of luck!
Cheers,
Ivan Labrie.
GBPJPY SELLEIGHTCAP:GBPJPY , Expectation that GBPJ will resume the bearish moves from the indicated sell zone is very high due to the recent price actions at these level. sell GBPJ

pretty cut and dry set upNot much explanation needed here, looking for a bearish move, 2:1 risk. Price failed to make a new high, impulsed down and is in a classic correction pattern, enter on break or wherever you feel comfortable. Good luck!

US500 Short Setup: Bearish Momentum Toward 6205Currently holding a short position on the US500 from the 6358 level, based on Smart Money Concepts. Price has tapped into a premium zone within a higher time frame supply area, showing clear signs of distribution. Liquidity has been swept above recent highs, and a shift in market structure confirms bearish intent. I’m targeting the 6205 level, expecting a rapid downside move in the very short term as smart money drives price toward discounted levels.


How to Use AI for Crypto Trading (The Right Way)lemme answer real quick: YOU DON’T.
Most traders using AI in crypto are straight up doing it wrong.
Here’s the usual story:
They open ChatGPT and ask,
“Hey… uhm… tell me which altcoin will 100x… Bruh, I heard you know everything, bet you know the next 10x coin!”
ChatGPT confidently replies,
“Sure, buy this coin right now…”
And the trader’s like,
“Ok, thanks.”
Then they jump on Binance, smash that buy button, and lose money faster than you can say ‘left trading’.
Don’t be that guy. Tools like ChatGPT weren’t made for this wild crypto jungle. Crypto’s a messy, super risky market, and ChatGPT’s language models mostly have old info anyway. They can’t give you solid, grounded analysis of what’s really going on — on-chain or across exchanges.
BUT, if you wanna cut through the hype and dodge the FOMO, this quick guide is for you. I’ll show you how to use AI the right way — with real on-chain and off-chain data, and special AI agents built specifically for crypto research.
Wanna keep going? Cool, let’s dive in. If not, peace out and don’t waste your time.
1. Use AI That Actually Processes On-Chain and Off-Chain Data
Real AI power kicks in when you talk about scale — thousands of tokens, millions of wallet moves, shifting stories everywhere. Humans can’t keep up, but AI can process it all instantly, in real time.
Look for AI tools that analyze stuff like:
Wallet behavior and how smart money moves.
Token velocity and decentralized exchange volumes.
Social sentiment from Twitter, Reddit, Discord, Telegram.
Developer activity, governance updates, protocol changes.
How market narratives pop up and spread.
2. Use AI Agents Made Just for Crypto Research
Crypto’s not like stocks or forex. It’s faster, fragmented, and shaped by both on-chain wallet moves and off-chain communities.
That’s where specialized AI agents shine. They understand stuff like:
How wallets behave during airdrops.
How Telegram groups hype early projects.
How dev activity correlates with price moves.
Instead of raw data dumps, these crypto-native AI agents spot patterns that’d take humans days to find. Like spotting when big wallet clusters start accumulating in a new ecosystem, or when a protocol suddenly blows up on social media.
3. Combine Research & Automation for Full-Spectrum Edge
I’m personally pumped about this part. Imagine an AI agent tracking low-cap funds moving into Telegram channels, running sentiment analysis, then tracking smart wallets accumulating tokens (even mixing in technical analysis).
Finally, it finds your risk management , sets triggers, and helps you enter trades with clear stop-loss and target levels.
Quick heads-up: Because of TradingView’s house rules, I can’t drop any links here — you gotta search and find your best AI tools on your own.
Remember : The only way to survive this market is to stay skeptical , watch risk management like a hawk, and keep your head cool. So if you feel FOMO creeping in or money management slipping — close your laptop, hit a coffee shop, and order a espresso. Trust me, it’s worth it.
Thanks for sticking with me till the end of this lesson. Im Skeptic from Skeptic Lab & If this helped, smash that boost button and I’ll catch you in the next one! :)
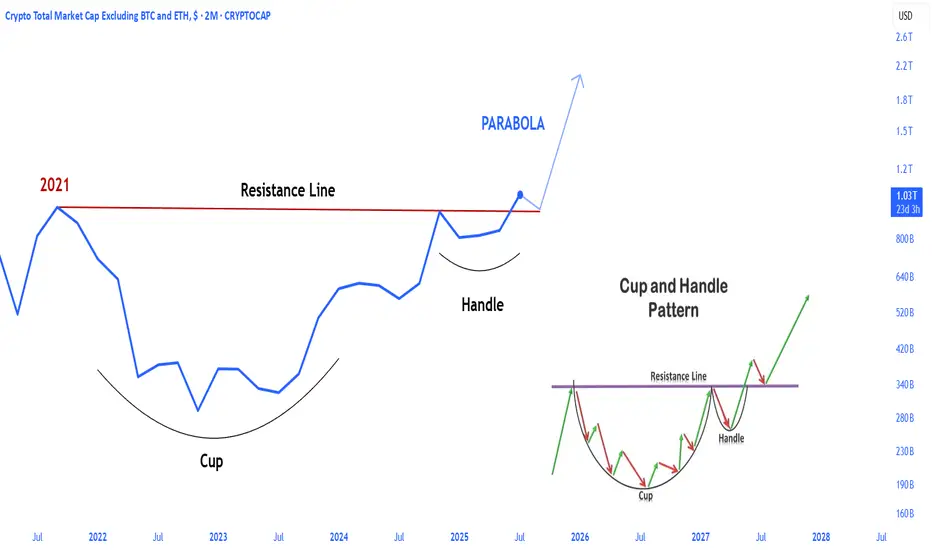
SOMETHING BIG IS COMING! ALTCOINSThe total3 index, an important metric for altcoins, broke out of the handle cup formation that began at the 2021 all-time high level. After the retest phase in the coming period, it will transition to a sharp rise phase.
Gold is set for a major crash!Are you ready for bearish trend of Gold?
After touching upper line of channel, Gold is ready for starting bearish trend.

EURUSD: Market of Sellers
The price of EURUSD will most likely collapse soon enough, due to the supply beginning to exceed demand which we can see by looking at the chart of the pair.
Disclosure: I am part of Trade Nation's Influencer program and receive a monthly fee for using their TradingView charts in my analysis.
❤️ Please, support our work with like & comment! ❤️


SOLUSDTSOL reclaiming the 200 EMA with the 50–61.8% Fib zone as confluence — watching $181 for the breakout or rejection. 🚀📊

DXY Dollar Index Review: The US Dollar flexes its muscles again.
Chart analysis suggests a medium-term uptrend in the dollar index, signaling growing strength in the U.S. dollar. The current price range between 96 and 97 has effectively prevented further declines and has acted as a strong support and demand zone.
For any further downward move to occur, the price would first need to retest and break this zone—but only after a temporary rise and corrective upward movement, which may take some time to unfold.
Further analysis points to price stabilization in the medium term, with a potential for a sideways to upward trend developing within the 97 to 110 range.
In this scenario, three potential price targets can be outlined:
First and most probable target: 100.30 – 101.70
Second, possible target: 103.20 – 104.30
Third and final target: 107.10 – 110.10
Current price: 98.31
Stop loss: Below 95.90

ELLIOTT WAVE EURUSD Daily update
EW Trade Set Up daily
minute ((i)) seems finished
H4 scenario 210725:
the price upward movement from 1.1557 area on 17/07/25 has broken decisively 1.1684-1.1705 area but it had not the
strenght to go further so that the lagging span (green line) could break upward the leading span B (red line).
A decrescent high has been registered at 1.1800 area on 24/07/25.
In this new scenario it looks like that the impulsive movement that started from 1.0180 on 13/01/25
finisced at 1.1834 on 010725 in the minute wave (i). (EWO divergence, break down of the upward (ii)/(iv) channel).
So i have to register that a correction to minute wave ((ii) has started
key levels VP area
1.1800
1.1370 POC
1.0850
note :
monitor the price reaction at any supports level: VP area and LVN

USDCAD drop to order block?Hello traders, this is a complete multiple timeframe analysis of this pair. We see could find significant trading opportunities as per analysis upon price action confirmation we may take this trade. Smash the like button if you find value in this analysis and drop a comment if you have any questions or let me know which pair to cover in my next analysis.

$BTC Eliot Wave last step + Golden cross.The entire crypto market is on fire — Golden Crosses everywhere across altcoins. 🔥
BTC looks to be in the 5th wave of an Elliott Wave pattern and has just printed its own Golden Cross. Bullish momentum is clear in the price action.
But how long can this run last?
We may be in a parabolic phase, yet there’s heavy liquidity sitting around $115k.
The logical play: a drop to grab that liquidity, then a push to $120k+.
In the end… only the market makers know. 🎯
DYOR

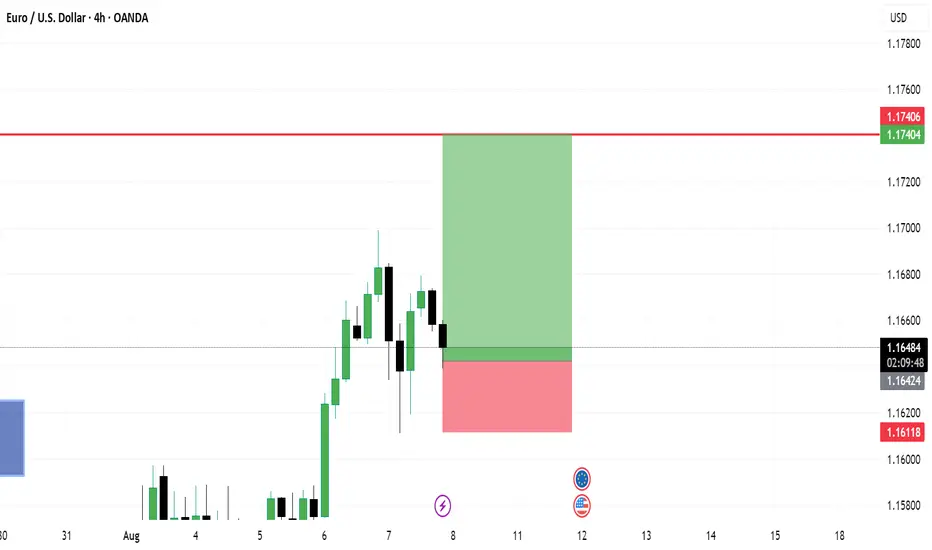
EUR USD LONGHi guys, this pullback its a perfect time to entry and get the last operation for this week, good luck everyone.

Bitcoin Cash Update · Good NewsBitcoin Cash has been facing the upper resistance of a long-term and wide bullish flag continuation pattern.
Overall, the chart is extremely bullish. Bitcoin Cash has been growing for 119 days. The action is very controlled with no large drawdowns. It is the perfect build-up pattern for a major advance.
It is good that the action this week is back above the upper flag trendline, as this confirms the market turning bullish. A red close last week and another red close this week would be bad and can point to lower prices. Instead, we have green this week and many altcoins are starting to recover, Bitcoin looks great.
Ethereum and XRP are trading much higher compared to Bitcoin Cash. We know Bitcoin Cash will not stay behind, so it is only a matter of time before we see higher prices. Maybe there will be some stability above $850.
There is still a long road to travel. Everything will continue to get better with each passing day. The market has been growing for months, four months to be exact, but this is only the start. Everything will be much better in the weeks ahead.
Namaste.
