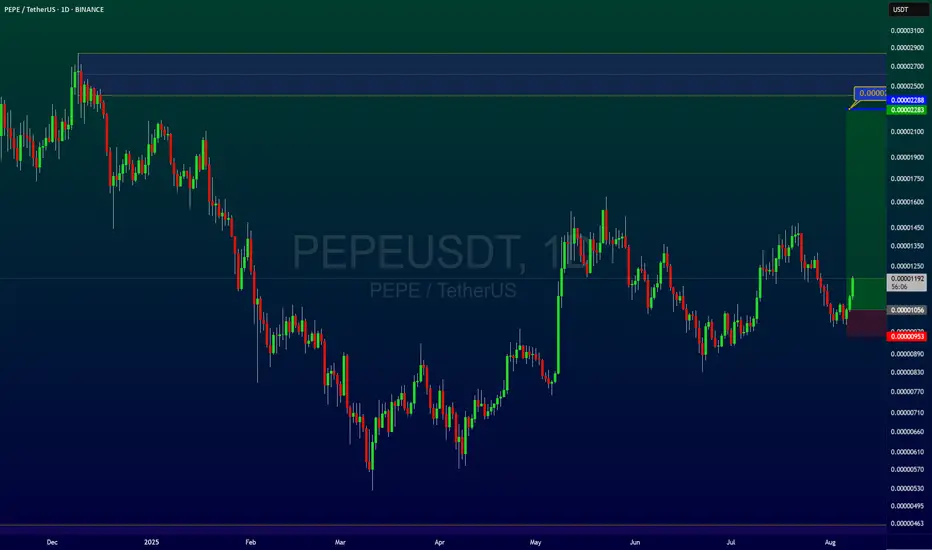
PEPEUSDT AND LONGPOSITIONAnd Pepe is a lovely and popular cryptocurrency and a great buy trading opportunity for the next three to six months with a great risk to reward.
Follow me and boost my analysis for timely and very low risk purchases and great signals.
Contact me in the comments section or private message
Community ideas
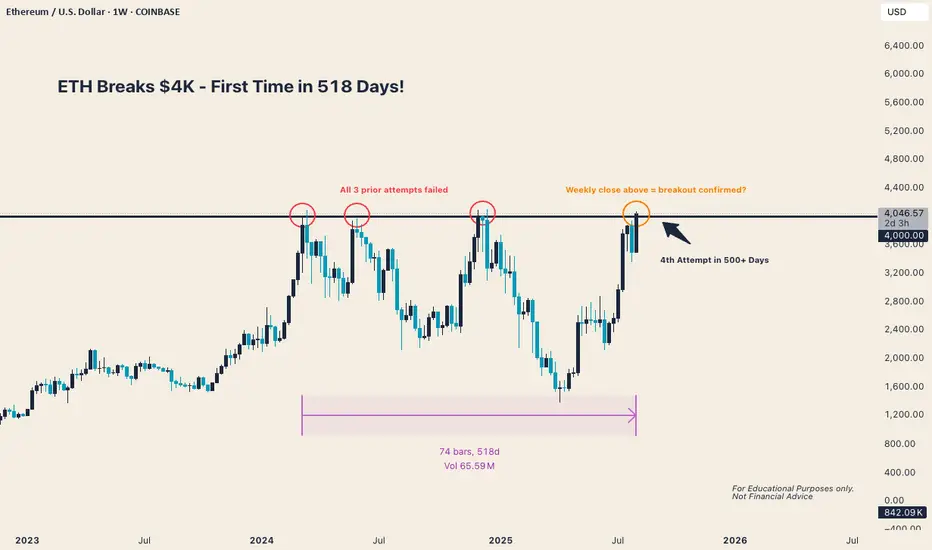
Ethereum Breaks $4,000 - First Time Since 2024After 3 failed breakout attempts over the past 518 days, ETH is once again testing a key macro resistance level.
Historically, when a level like this is broken and held on the weekly close, we see strong follow-through in trend continuation.
Will this be a breakout with legs or another rejection?
trump/usdt=Trump/USDT Analysis.
= The analysis is based on trend analysis, support and resistance levels, and price action.
= We need a breakout of the trend to begin the upward movement toward the targets.

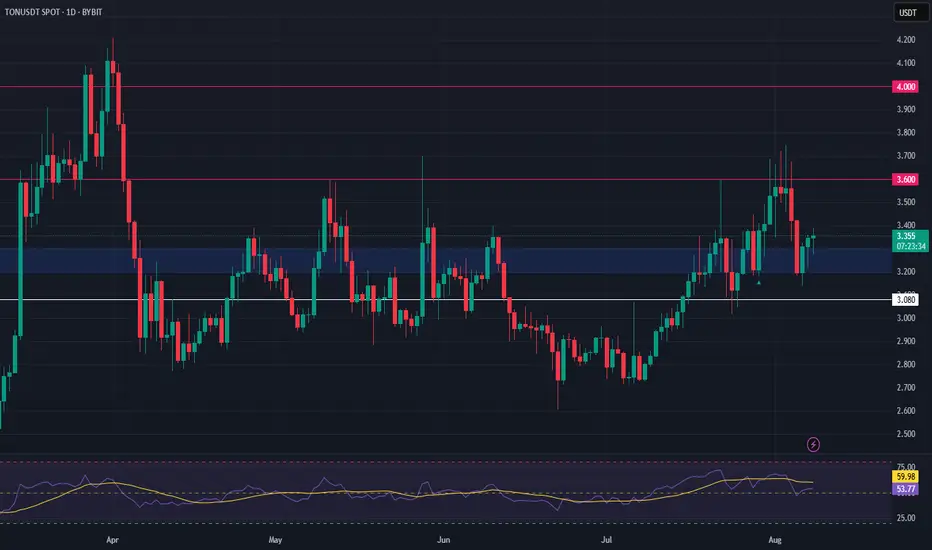
TON Setup – Pullback to Support After 15% SurgeToncoin (TON) has climbed over 15% since our last trade. Price is now pulling back into a key support zone, potentially forming a base for the next upward leg.
📌 Trade Setup:
• Entry Zone: $3.20 – $3.30
• Take Profit Targets:
o 🥇 $3.60
o 🥈 $4.00
• Stop Loss: $3.08
USD-JPY Local Short! Sell!
Hello,Traders!
USD-JPY made a retest
Of the horizontal resistance
Of 148.101 from where we
Are already seeing a bearish
Reaction so we will be
Expecting a further
Bearish move down
Sell!
Comment and subscribe to help us grow!
Check out other forecasts below too!
Disclosure: I am part of Trade Nation's Influencer program and receive a monthly fee for using their TradingView charts in my analysis.

US30 Bleeding.Greetings Family. I'm seeing a very clear selling opportunities on EIGHTCAP:US30 , so i brought the case to the attention of team TradingView community so that we can look into the situation together.

Ethereum Outperforms Majors as Crypto Sentiment Shifts Again 🌐 Ethereum Outperforms Majors as Crypto Sentiment Shifts Again 🔄📊
Trump talks 401(k) crypto 🗞️, BTC reclaims the key $115,800 level 💪, but today we zoom into what the charts are screaming — and Ethereum is leading.
While headlines fly, structure never lies. Let’s compare ETH against other majors 👇
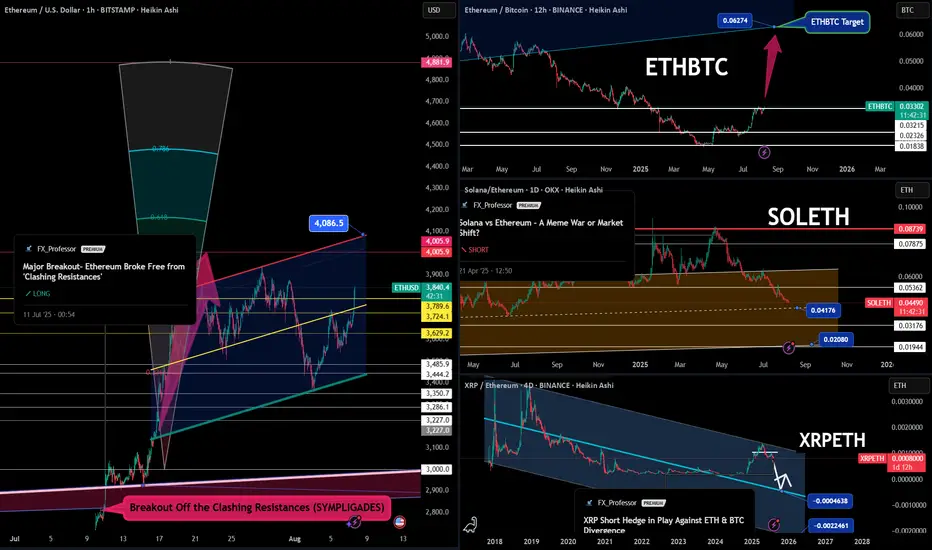
🔷 ETHUSD – The Breakout That Sparked It All
📈 ETH broke free from the "Clashing Resistances" zone (SYMPLIGADES).
It’s now targeting $4,086.5, with potential expansion toward $4,881.9 if momentum holds.
🟨 Key zones:
$3,744 = retest zone
$3,830 = resistance-turned-support
$4,005 = psychological milestone
The 1-2-3 model is alive and well.
And ETF news + BTC support is the fuel ETH needed. 🔥
📊 ETHBTC – The Hidden Strength Ratio
This is what most traders miss:
➡️ ETHBTC has been in stealth accumulation mode.
Now aiming for 0.06274 — a huge reclaim zone not seen since mid-2022.
This ratio matters because it signals altcoin rotation, not just price action.
💀 SOLETH – The Bleed Continues
We called it months ago:
Solana may have great tech (Rust, speed), but it’s paying the price for memecoin mania and diluted narrative.
SOLETH is in freefall — currently below 0.045, with support at 0.04176 and 0.02080 next if weakness continues.
ETH is eating market share back.
📉 XRPETH – Short Hedge in Play
XRPETH structure remains bearish.
Even after multiple divergence plays, XRP continues to underperform against both BTC and ETH.
Target zones:
🧊 0.00004638
🧊 0.00002246
XRP fans — this is not personal. This is chart-based reality.
🗞️ Don’t Forget the Macro Backdrop:
SEC just greenlit direct BTC/ETH usage in ETF flows
Trump hints at crypto-friendly 401(k) policies
China is brewing something (rumor or tumor — still unclear 😅)
BTC just reclaimed $115,800, setting sights on $122,795 → $132,595
This market isn’t waiting for confirmation — it’s moving based on structure.
🚫 What I Avoid in This Cycle:
❌ Memecoins (low trust, no ETF tailwind)
❌ GameFi (zero relevance right now)
❌ Ghost L1s (no users = no bids)
🧠 Final Take:
Ethereum is clearly leading the pack.
BTC is reclaiming its throne.
Solana is bleeding relative to ETH.
XRP is stuck in divergence hell.
So we trade the structure, not the hopium.
📈 Alt season won’t be a meme — it will be rotation-driven, narrative-backed, and ETF-aligned.
📽️ Full explanation in my previous video post — check it out if you want full breakdown on ETFs, ETH’s structural strength, and the geopolitical backdrop with China.
One Love,
The FXPROFESSOR 💙
Disclosure: I am happy to be part of the Trade Nation's Influencer program and receive a monthly fee for using their TradingView charts in my analysis. Awesome broker, where the trader really comes first! 🌟🤝📈
CAD/JPY Entry Uncapped – Loonie Robbery in Motion🔐CAD/JPY Heist Activated: Thief Breaks Into the Bullish Vault📈💰💥
📌 Asset: CAD/JPY "Loonie-Yen" Forex Bank
📌 Plan: Bullish
📌 Entry: Any price level
📌 Stop Loss: 106.600
📌 Target: 109.200
📌 Method: Multi-limit orders using Layering / DCA Strategy
👋🏼 Hello Money Movers & Market Robbers!
Welcome back to the battlefield — this time we’re breaching the vault of the CAD/JPY Loonie-Yen Forex Bank with a bullish masterplan. This isn't just a trade, it’s a planned heist using Thief Trader Strategy. Precision entries, layered orders, and sharp exits — that’s how we roll! 🏦💣
🔓 ENTRY — The Vault Is Open!
💸 Swipe the loot at any price — but the real pros place Buy Limits near recent swing lows (15min/30min TF) to catch price pullbacks.
⚠️ Only Long — Short is off-limits unless you’re surrendering your loot.
🛑 STOP LOSS — Lock Before They Catch You!
📍 Place SL at 106.600, or below your last entry layer if you stack orders.
Let your lot size, risk %, and DCA levels guide the SL placement. Safety first, profit always.
🎯 TARGET — The Exit Door: 109.200
📈 That’s where the loot gets stashed! Trail it smart if the price gets hot. Escape early if market mood shifts.
🧠 STRATEGY BREAKDOWN:
☑️ Style: Layered Grid / DCA Method
☑️ Trade Type: Scalping 🔹 Day Trade 🔹 Swing
☑️ Market Condition: Bullish momentum pushing through resistance — fundamental & sentiment align.
📚 MARKET INTEL:
📰 Stay ahead — read the COT reports, scan the macros, dive into quant flows & sentiment indexes.
Want the full picture? Click the 🔗 in proo file for the research vault.
⚠️ Avoid entries during high-volatility news. Set trailing SLs to protect your robbery bag. 🎒
🚨 THIEF TIPS:
🔹 Don’t panic — layer in, scale smart.
🔹 Use M15/H1 TF to plan sniper entries.
🔹 Let profits run, but never let them bleed.
💥 BOOST THIS IDEA if you support the Thief’s mission 💥
Every like powers up the next robbery!
Your support lets me share more free trade ideas with real planning & real money in mind.
🔐 Catch you on the next break-in… Stay funded, stay dangerous. 🤑🚁💼

EUR/USD Analysis:The pair is moving sideways between the 1.169 resistance zone and the 1.162 support zone.
A break and hold above 1.169 could push the price to test 1.177.
A break below 1.161 and stability beneath it may lead to a retest of 1.157, followed by 1.153, which is a potential bounce area.
⚠️ Disclaimer:
This analysis is not financial advice. It is recommended to monitor the markets and analyze the data carefully before making any investment decisions.

XRY to 4.50 next weekthe case with the sec lines up with the cup and handle formation. it will pop after news gets out next Friday.

AUDJPY & CADJPY Trade Recaps 08.08.25A long position on AUDJPY taken Monday for a -1%, the trade had great potential but one of those ones that didn't have enough steam to commit. Followed by a CADJPY short taken yesterday for a +2% manual close.
Full explanation as to why I executed on these positions and the management plan with both.
Any questions you have just drop them below 👇

USDJPY drop evidentMulti-dimensional reasoning on market data shows that the current multi-party confidence continues to weaken, and the willingness to participate on the long side is insufficient. In the high-frequency trading trajectory, the system captures the typical weak market structure of "failed tentative rebound - active selling pressure intensifies - short-side active attack".
At the public opinion level, keywords such as "weak rebound", "overreaction to bearishness" and "emotional imbalance" appear frequently, and users and analysts are generally inclined to judge short-term weakness in their discussions. In conjunction with real-time capital flow monitoring, we found that small and medium-sized investors are accelerating their exodus behavior, and the short game structure is forming an advantage.
In the current market environment, the rebound is mostly technical or short-term liquidity replenishment triggered by weak sustainability, the strong pressure structure has not yet been destroyed. We suggests focusing on the "rebound - pressure - fall" short-term game window.

#ENAUSDT In a simple weekly view,
it is quite clear that a break of the red arrow resistance line will pave the way for a touch of the ceiling,
so watch and wait.

EURUSD – DAILY FORECAST Q3 | W32 | D8 | Y25📊 EURUSD – DAILY FORECAST
Q3 | W32 | D8 | Y25
Daily Forecast 🔍📅
Here’s a short diagnosis of the current chart setup 🧠📈
Higher time frame order blocks have been identified — these are our patient points of interest 🎯🧭.
It’s crucial to wait for a confirmed break of structure 🧱✅ before forming a directional bias.
This keeps us disciplined and aligned with what price action is truly telling us.
📈 Risk Management Protocols
🔑 Core principles:
Max 1% risk per trade
Only execute at pre-identified levels
Use alerts, not emotion
Stick to your RR plan — minimum 1:2
🧠 You’re not paid for how many trades you take, you’re paid for how well you manage risk.
🧠 Weekly FRGNT Insight
"Trade what the market gives, not what your ego wants."
Stay mechanical. Stay focused. Let the probabilities work.
FX:EURUSD

EUR/USD Holds Steady Ahead of US DataHello everyone, what are your thoughts on FX:EURUSD ?
Today, the pair is trading in a narrow range around 1.1650 on Friday. While the US dollar is struggling to regain strength, a slight pullback in EUR/GBP following the Bank of England’s policy announcement has limited the upside for EUR/USD. The market now awaits upcoming US economic data.
From a technical perspective, EUR/USD remains anchored above newly established support levels. If these levels hold, this pullback could be an excellent accumulation phase before a breakout move.
What do you think? How will EUR/USD move by the end of the session and in the coming days?

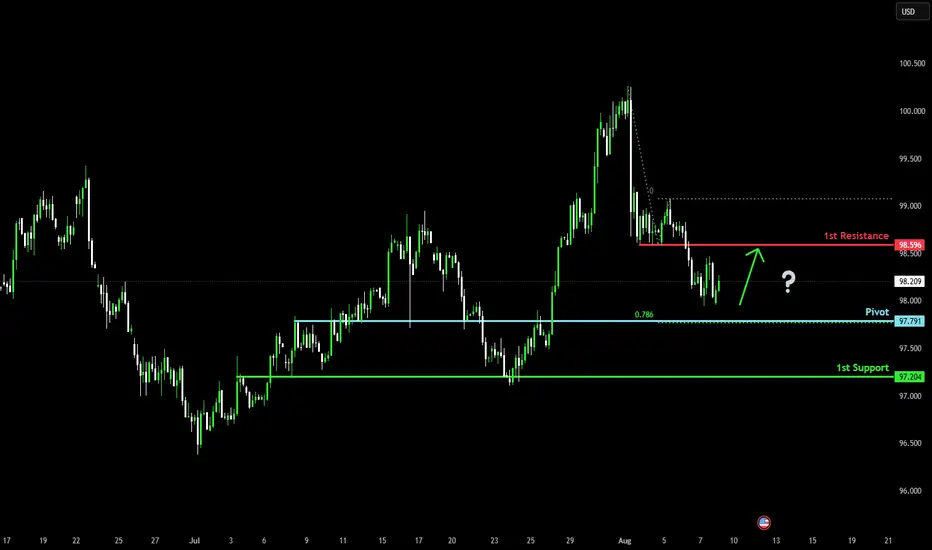
Bullish bounce off?The US Dollar Index (DXY) is falling towards the pivot which is an overlap support and could bounce to the pullback resistance.
Pivot: 97.79
1st Support: 97.20
1st Resistance: 98.59
Risk Warning:
Trading Forex and CFDs carries a high level of risk to your capital and you should only trade with money you can afford to lose. Trading Forex and CFDs may not be suitable for all investors, so please ensure that you fully understand the risks involved and seek independent advice if necessary.
Disclaimer:
The above opinions given constitute general market commentary, and do not constitute the opinion or advice of IC Markets or any form of personal or investment advice.
Any opinions, news, research, analyses, prices, other information, or links to third-party sites contained on this website are provided on an "as-is" basis, are intended only to be informative, is not an advice nor a recommendation, nor research, or a record of our trading prices, or an offer of, or solicitation for a transaction in any financial instrument and thus should not be treated as such. The information provided does not involve any specific investment objectives, financial situation and needs of any specific person who may receive it. Please be aware, that past performance is not a reliable indicator of future performance and/or results. Past Performance or Forward-looking scenarios based upon the reasonable beliefs of the third-party provider are not a guarantee of future performance. Actual results may differ materially from those anticipated in forward-looking or past performance statements. IC Markets makes no representation or warranty and assumes no liability as to the accuracy or completeness of the information provided, nor any loss arising from any investment based on a recommendation, forecast or any information supplied by any third-party.
LINK SHORT It seems like a lower high has now formed. Following the trend positioning into a short position makes sense here.

Still Bullish!TOMCL (08-08-2025)
Touched 36 - 37 🙂
It is Still Bullish! However, 36.60 is Important to Sustain now; otherwise we may witness slight selling as it needs to print HL.

ETHUSDTBearish RSI divergence at $4,280 suggests weakening momentum. Possible correction toward $3,981 → $3,786 → $3,373. Liquidity around $3,000 could attract price before the next leg. I expect a pullback before any strong bullish continuation.
BINANCE:ETHUSDT.P

Watching July 31 High and August 1 Low - Key LevelsUS Inflation Next Week (CPI and PPI)
Will August re-test highs with momentum? Or test and fade?
MAGS back to highs.
AAPL has one of the best weeks since 2020's post covid crash recovery (WILD).
I still like long assets, but playing the game with discipline and patience.
Enjoy the weekend. Looking forward to the grind next week.
Thanks for watching!!!
-Chris

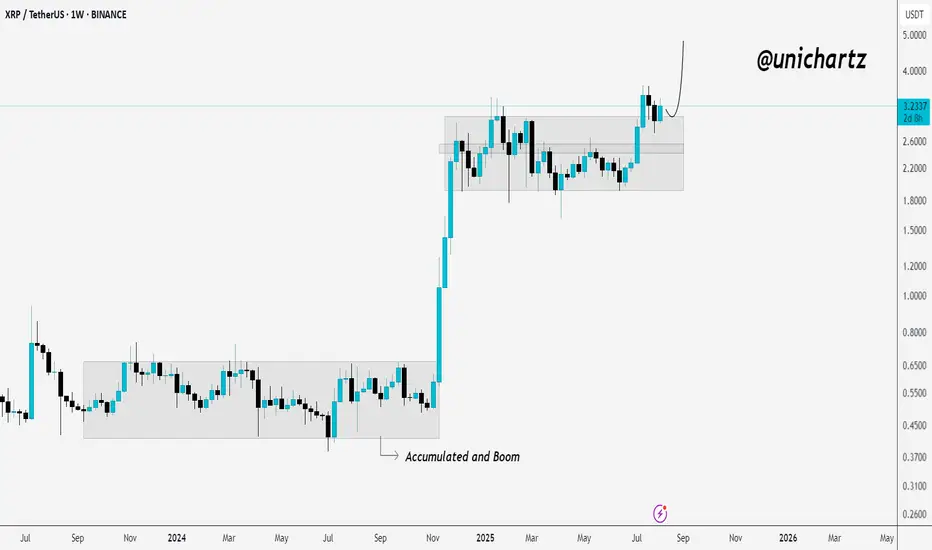
From Accumulation to Acceleration – XRP Ready to RunCRYPTOCAP:XRP has successfully retested the breakout level from its previous accumulation zone, showing strong bullish momentum.
After spending months consolidating in a tight range, price finally broke out with a sharp rally. The recent pullback found support right at the top of the old range, a classic breakout retest, and buyers stepped back in.
This retest confirms the breakout’s strength and could set the stage for the next leg up, with bulls now eyeing higher targets as long as price holds above the former resistance zone.
DYOR, NFA
DXY Trend AnalysisTechnicals:
The DXY is sitting near its pivot, with technical momentum remaining mildly bearish, but oversold conditions suggest a potential for a bullish bounce. If the 97.55 support is broken decisively, further downside is likely. Upside is capped by resistance at 98.64; a break above this may confirm a short-term reversal to the upside.
Key Levels to Watch
Pivot Level: 98.12
Key Support: 97.55
Key Resistance: 98.64
Fundamentals:
- Persistent US twin deficits, reduced safe-haven flows, and a global trend of diversifying away from dollar assets all present headwinds.
- The spread between US yields and foreign peers is at historic highs, but with the Fed expected to ease and global growth forecasts improving, the dollar's advantage is eroding.
- Safe-haven demand could temporarily support the dollar in response to global shocks, but is not expected to reverse the broader downtrend this year.
Analysis by Terence Hove Senior Financial Markets Strategist at Exness

BTCUSDT 1H Supply Zone Rejection – Bearish Setup in PlayIf price fails to reclaim the supply zone, we expect a rejection and drop toward lower demand areas
Price broke market structure previously at 115,201, which now acts as the first major support
🎯 Trade Plan (Sell Idea):
text
Copy
Edit
Entry: Near 116,800–117,000 (within supply zone)
SL: Above 117,300
TP1: 115,201 (support zone)
TP2: 113,600 (high-probability demand zone)
TP3: 113,000 (orange demand base)
Risk:Reward ~ 2:1 to 3:1
🧠 Key Zones:
🔵 Resistance/Supply Zone: 116,800 – 117,300
🔵 Support Zone 1: 115,201
🟠 Strong Demand: 113,000 – 113,600
📌 Notes:
This is a clean reaction setup from a well-defined supply zone using volume profile and price action. Look for confirmation like bearish engulfing or M-pattern on lower TF before shorting.
⚠️ Disclaimer:
This is not financial advice. For educational purposes only. Always do your own analysis and manage risk.
