ES1 - Tame Black Friday or Dump IncomingUS Black Friday is known as quite a tame day with shorter hours...
But its worth noting that S&P Futures has reached the retracement Golden Window - an area where corrective action often peaks.
And its slightly above a significant resistance - in the higher liquidity zone.
So this is setting up for a potential Head & Shoulders Pattern.
When I refer to an H&S I do not at all consider that we can use it to judge downside - that theory is a nonsense in my opinion.
But it is a pattern that may lead to a pull back.
For now there is no price action to suggest a slump, but lets watch out for it because this is an ideal area for one if this move up proves to be exhausted.
If it does slump then high octane positions may be affected and there may be dips buys, but very deep buys may have relative buoyancy and hold.
This is a neutral post for now - we'll see how it develops 🧐.
This analysis is shared for educational purposes only and does not constitute financial advice. Please conduct your own research before making any trading decisions.
Community ideas

Nifty Analysis EOD – November 28, 2025 – Friday🟢 Nifty Analysis EOD – November 28, 2025 – Friday 🔴
Consolidation Continues: Inside Bar Setup Forms
🗞 Nifty Summary
The Nifty opened with a 30-point Gap Up, followed by a sharp 80-point jump and an immediate recovery, which established the Initial Balance (IB) range. The index quickly found support at the highly contested 26200 ~ 26220 zone.
A key event was the fakeout above the IBH, trapping intraday buyers before slipping back to 26220. The 26220 level proved its importance, acting as both support and resistance throughout the session. Nifty spent the day hovering between 26250 (resistance) and 26200 (support), a tight 50-60 point range defined by high volatility.
The day closed flat at 26,202.95, with a minor 12-point loss (-0.05%). The entire day’s range (108 points) was inside the previous day’s range, forming a classic Inside Bar setup. This confirms another day of consolidation.
🛡 5 Min Intraday Chart with Levels
🛡 Intraday Walk
The overall day was range-bound with high volatility, but the crucial working range was tightly squeezed to only 30-50 points. The action was centered on the 26220 pivot, reflecting deep indecision after the successful breach of the ATH.
The fakeout above the IBH was a clear liquidity trap, ensuring that both long and short attempts within the range were punished.
This Inside Bar setup is a powerful technical signal: the market is currently “coiling,” suggesting that when the breakout occurs (either above today’s high or below today’s low), the resulting move will be aggressive.
📉 Daily Time Frame Chart with Intraday Levels
🕯 Daily Candle Breakdown
Open: 26,237.45
High: 26,280.75
Low: 26,172.40
Close: 26,202.95
Change: −12.60 (−0.05%)
🏗️ Structure Breakdown
Type: Bearish candle (close slightly below open) — Inside Bar.
Range (High–Low): ≈ 108 points — controlled, low range (relative to prior day).
Body: ≈ very small body indicating hesitation and perfect balance near the pivot.
Upper Wick: ≈ 43 points — buyers attempted to push higher but failed to sustain.
Lower Wick: ≈ 31 points — buying attempts from lower levels but limited recovery.
📚 Interpretation
The narrow candle body and minimal net change confirm the market is in a deep consolidation phase following the ATH test.
The Inside Bar formation is the key takeaway, signaling a high probability of a strong directional move once the high or low of today’s candle is decisively breached. There is no strong conviction from either side; the market is waiting for a trigger.
🕯 Candle Type
Neutral / Indecision Candle (Inside Bar) — Indicates maximum balance and a high-probability setup for an explosive directional trade.
🛡 5 Min Intraday Chart
⚔️ Gladiator Strategy Update
ATR: 196.83
IB Range: 83.75 → Medium
Market Structure: Balanced
Trade Highlights:
10:05 Long Trade - SL Hit
11:36 Short Trade - Trailing SL Hit
13:30 Long Trade - SL Hit
Trade Summary: The volatile, tight range produced a challenging environment, leading to multiple stop-loss hits as the market trapped traders on both sides. This is a typical result during an Inside Bar consolidation, where directional strategies struggle until the breakout occurs.
🧱 Support & Resistance Levels
Resistance Zones:
26220 (Immediate Resistance)
26277 (Old ATH, Now Immediate Resistance)
26310 (New ATH)
Support Zones:
26104 (Previous Strong Resistance, now first support)
26030
25985
25930 ~ 25920
🧠 Final Thoughts
“Patience is the only trade when the market is setting an Inside Bar.”
The setup for the next session is now crystal clear. The market is compressed, ready to move sharply. Intraday traders must focus solely on the breakout: A sustained move above 26280 will target 26400, while a decisive break below 26170 will target 26104 quickly. Avoid trading inside the range!
✏️ Disclaimer
This is just my personal viewpoint. Always consult your financial advisor before taking any action.

Silver loves a cup and handle!Another month, another silver cup and handle. If you are waiting for a pull back you may miss out on another rally.

A Storm Is Coming?Core Thesis: The market is colossally underestimating the risk of a deliberate US dollar devaluation. Contrary to popular belief, a weaker dollar in this specific context will not boost risk assets but will instead be the source of massive volatility, potentially exceeding 2008. The collapse will come from the unwinding of a global dollar-centric carry trade.
The Pillars of the Storm:
The Structural Imbalance (The Fuel):
The US, as the world's largest importer, sends dollars abroad. To maintain their export-oriented economies, foreigners reinvest these dollars into US assets (especially the top 7 S&P 500 stocks).
This has created a structural "carry trade": global investors are overexposed to US assets and, trusting that the dollar rallies in crises (like 2008), do not hedge their currency risk.
This continuous flow is a primary reason for extreme US equity market valuations. Global liquidity, not just fundamentals, has inflated prices.
The Trump Agenda (The Trigger):
The Trump administration is actively pursuing a weaker dollar to gain an upper hand in the economic conflict with China, using tariffs as leverage.
Since Trump took office, we have already seen episodes where the dollar and stocks sell off simultaneously – a warning sign that the traditional correlation is breaking.
The Federal Reserve (The Accelerator):
Trump needs a dovish Fed to weaken the dollar. The appointment of Steven Miran to the Fed, with his interest rate projections 100bps below other members, is a clear signal of this direction.
A new Fed Chair, more aligned with Trump, will likely take over in 2026 to implement a more aggressively accommodative monetary policy.
The Crisis Mechanism:
The trap is set in the following scenario:
The Fed cuts rates aggressively to weaken the dollar, following Trump's agenda.
The dollar devalues significantly.
For a foreign investor, the return is: (S&P 500 Return) + (FX Change). With the dollar falling, their gains are eroded or turn into losses.
This triggers a mass exodus of these foreign investors, who start selling US assets to protect their returns.
The selling is amplified by the structural fragility: everyone is positioned the same way. Liquidity evaporates.
Panic sets in when the typical "Fed put" (intervention to save the market) fails, because more liquidity injected by the Fed would depress the dollar even further, amplifying the equity selloff instead of containing it.
Warning Signals to Monitor:
Primary Signal: Equity selling occurring simultaneously with a depreciating dollar.
Confirmation Signal: A rise in implied volatility (skew) in the currency market.
Market Signal: Underperformance of high-beta and low-quality stocks, indicating that risk capital flows are drying up.
Critical Signal: Any Fed intervention that, instead of calming the market, causes an even larger selloff in the dollar and stocks.
Current Positioning & Conclusion:
In the short term, the author maintains long positions in equities, gold, and silver, as liquidity tailwinds are still favorable. However, the storm is forming. The market is as complacent about a weak dollar as it was about mortgages in 2007. When the signals above flash, indicating that cross-border flow risk is materializing, it will be time to position defensively: short equities, long volatility, and short the US dollar.
The crisis is not a matter of "if," but "when" these structural flows begin to reverse. Awareness of this mechanism is the single greatest edge an investor can have today.

GBPUSD Will Go Up From Support! Long!
Please, check our technical outlook for GBPUSD.
Time Frame: 9h
Current Trend: Bullish
Sentiment: Oversold (based on 7-period RSI)
Forecast: Bullish
The market is trading around a solid horizontal structure 1.321.
The above observations make me that the market will inevitably achieve 1.333 level.
P.S
The term oversold refers to a condition where an asset has traded lower in price and has the potential for a price bounce.
Overbought refers to market scenarios where the instrument is traded considerably higher than its fair value. Overvaluation is caused by market sentiments when there is positive news.
Like and subscribe and comment my ideas if you enjoy them!

Ethereum OUTCOME!ETH gained strength this week. Waiting to see if it will Break the TrendLine and Cross the Moving Average.

ETH — Scaling Mastery Trendlines: Strat!This ETH setup combines three Scaling Mastery setups—the 1/10, 1/4, and 1/3 structures—stacked inside the same region. That alone makes this a high-value educational chart, because seeing all three appear together is rare.
1️⃣ Scaling Mastery Trendlines (1/10 • 1/4 • 1/3 Sets)
This chart uses the official Scaling Mastery Trendline System, where each trendline ratio tells you a different part of market behavior:
🟧 1/10 Trendline
Shows micro-reaction structure
Helps detect early shifts in momentum
Usually breaks first and gives the initial signal
ETH already broke this one cleanly.
🟦 1/4 Trendline
Shows medium-level structure
Confirms trend bias and filters false moves
ETH is currently retesting/reclaiming this region.
🟩 1/3 Trendline
The strongest diagonal structure
When this breaks, major HTF direction usually follows
ETH is attempting to push into this breakout zone now.
Having all three ratios interacting inside the same price zone is extremely valuable because:
➡️ It shows a stacked confluence of momentum
➡️ It forms a “ladder” of breakout confirmations
➡️ It gives a clean model for trend reversal and expansion
2️⃣ Bullish + Bearish Trendlines Forming a Hidden Channel
When you overlay:
The bearish red channel (recent downtrend)
The bullish turquoise macro expansion trendlines
…you actually get a dual-channel structure.
This means ETH is breaking both:
✔ The bearish downtrend channel
✔ Into the bullish expansion channel
At the same time.
This is a classic Scaling Mastery visual where bearish and bullish diagonals overlap and create a “channel breakout zone.” ETH is currently reacting inside that zone.
3️⃣ Expected Behavior if Breakout Holds
If ETH continues to hold above the 1/10 → 1/4 → 1/3 progression:
🎯 Target 1: $3,941
Mid-channel expansion target.
🎯 Target 2: $4,729 – $4,800
Full expansion to the upper turquoise trendline.
This aligns with standard Scaling Mastery expansion rules.
4️⃣ Structure Summary
1/10 broken ✔
1/4 reclaim attempt ✔
1/3 test incoming ✔
Bearish + Bullish diagonal confluence ✔
Dual-channel breakout structure ✔
Clear expansion targets to the upside ✔
This is a clean educational example of multi-trendline alignment, a signature technique of the Scaling Mastery system.
⚠️ Educational Disclaimer
This idea is for educational purposes only. It is not financial advice or a trade signal. Always analyze your own charts and manage your own risk.

Zcash (ZEC) — Major Trendline Breakdown Confirmed | Retest ?I was charting this setup expecting ZEC to approach the trendline soon, and it actually broke down while I was analyzing it. The rising yellow trendline has held this entire upswing for weeks, but the 8H, 12H, and even the daily candle all closed cleanly below it.
That officially flips this structure from bullish to bearish.
Why This Break Matters
Daily close under the trendline = confirmed breakdown
Price already tapped the underside once and got rejected
EMA ribbon starting to flip bearish on mid-timeframes
RSI locked in a lower range
MACD showing increasing downside momentum
Classic structure shift: break → retest → continuation.
Retest Still on the Table
We might still see a retest of the yellow trendline from below.
These broken structures often get revisited — especially if momentum pauses or stalls around the $440 area.
As long as ZEC stays below the trendline, the structure remains bearish.
Levels Below
$440 – first significant support
$392 – major demand zone
$320 – deep liquidity zone if selling accelerates
My View
I was preparing to post this before the breakdown, but ZEC moved early. Now I’m watching to see if it wants to retest that trendline before heading toward deeper levels.
Not financial advice — just sharing the read.
P.S. What About Bitcoin?
BTC is still holding its short-term channel, but it's hovering near resistance with weakening momentum on lower timeframes. If BTC pulls back or sweeps liquidity lower, it could accelerate ZEC's downside move. If BTC instead pushes upward, ZEC may still get a retest of the broken trendline — but the structural break on ZEC remains valid either way.

Sell GBP/USD at 200 Daily MA.The GBP/USD I believe is now in a relief rally stage. The 200 Daily MA is around 1.3304, 50 Daily MA at 1.3291 and 38.2% Fib retracement level is 1.3284 so within 30 pips there are many congested resistance levels. Seems like a great place to sell back down to the 50% Daily Fib level of 1.2944. Once in profit with a clear reversal pattern, adding to this position might be very profitable.
Sell Limit : 1.3280 38.2% Fib retracement level
Stop : 1.3390 above 100 Daily MA
Profit : 1.2950 before 50% Fib Daily retracement
Risk 1 : 3 / Stop is 110 pips.


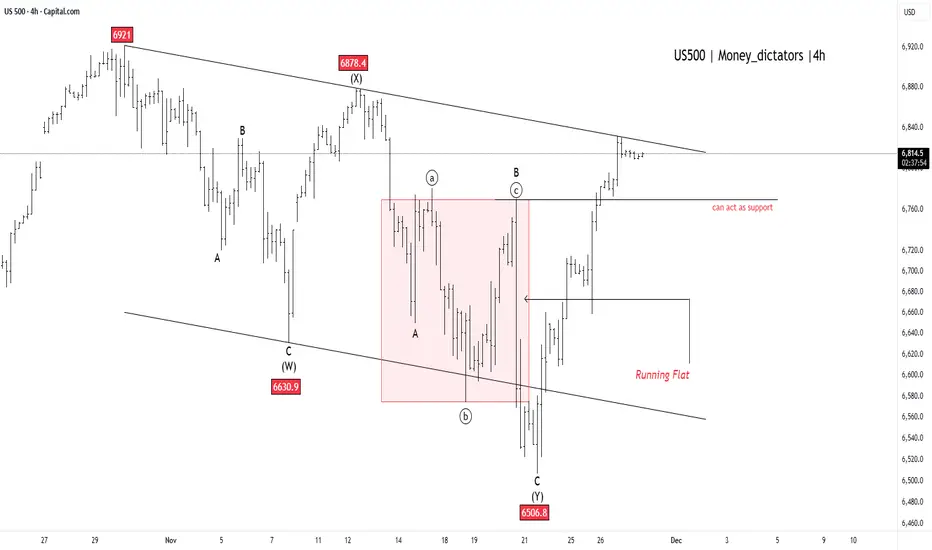
US500 - Breakout to New All-Time Highs!US500 suggests the market has put a definitive end to its recent downward movement, signaling that a major bullish trend is set to continue. This complex correction, which the chart labels as complete at the 6506.8 low, looks resolved. The index has since staged a powerful rebound and is currently pressing right up against the major upper trendline resistance, which defined the limits of the entire corrective phase.
A clear and sustained move above this key trendline will provide final confirmation that the correction is over and that a significant new upward wave has begun. The previous area of congestion around 6760 is now expected to act as strong support for the index, preventing any minor pullbacks from turning into a deeper decline. With the current price around 6,812.61 and the all-time high at 6,920.34 , the index is technically well-positioned to challenge and surpass this record high soon.
Two great trades that would be good for beginners11 28 25 the exchanges are having some problems and some of the exchanges are at least temporarily closed so be aware. A few weeks ago I asked Bobby to find me some easier trades to take because he's starting to trade and he's not going to be able to trade the large contract on gold or silver he has to go to more realistic setups. We found two of them and you should take some time on a silver tray set up and one other trade that we haven't really talked about introducing it a few weeks earlier

SP500, Bitcoin, Dollar & Euro Daily Trade SetupsIn this update we review the recent price action the SP500, Bitcoin, Dollar Index and the Euro and identify the high-probability trading opportunities and price objectives to target. To review today's video analysis, click here!

EURUSD SHORT Market structure bearish on HTFs 3
Entry at both Weekly and Daily AOi
Weekly Rejection at AOi
Daily Rejection At AOi
Daily EMA retest
Previous Structure point Daily
Around Psychological Level 1.16000
H4 Candlestick rejection
TP: WHO KNOWS!
Entry 100%
REMEMBER : Trading is a Game Of Probability
: Manage Your Risk
: Be Patient
: Every Moment Is Unique
: Rinse, Wash, Repeat!
: Christ is King.

ETH/USD 1D chart review1️⃣ Trend and general context
• ETH is trading after a sharp decline from its local high of ~4,000+.
• The price rebounded from a quite strong support zone around ~2,750–2,800.
• Current price: ~USD 3,034 → the market is testing the first local resistance.
Short-term trend: down, but a rebound and the first signs of reversal are visible.
Long-term trend: still upwards (HL/HH on large intervals).
⸻
2️⃣ Key Levels (from your chart)
🟩 Resistances
• USD 3,475 – key resistance + SMA (blue)
👉 if ETH breaks this level and closes 1D above → strong bullish signal.
• USD 4,061 – major resistance from previous highs.
🟥 Support
• USD 2,757 – the nearest strong support after breaking the trendline.
• USD 2,126 – very key macro support (bottom of consolidation).
⸻
3️⃣ Medium SMA
From your chart:
• Red SMA #1 – price is just above it → first positive signal.
• Blue SMA #5 – Acts as resistance and is currently being tested from below.
• Green SMA #2 – higher, acts as resistance at ~USD 3.475.
➡ The price must return above the blue and green SMA to confirm the return of the upward trend.
⸻
4️⃣ MACD
• The MACD at the bottom of the chart begins to curl upwards.
• The histogram decreases towards zero → the downward momentum weakens.
• Bullish cross is still missing, but it's getting closer.
Conclusion: Early signal of trend reversal, but not confirmed.
⸻
5️⃣ RSI
• RSI is in the zone around 40 → quite low, but not extremely.
• Slight divergence: the price made a lower low, the RSI made a higher one.
👉 This is a bullish signal, but only in combination with a resistance breakout.
⸻
6️⃣ Price Action
You can see:
• A long rising candle after a bounce from below.
• We are approaching the first important resistance at ~3.100–3.150.
To confirm continuation, you need:
✔ Closing of the 1D candle above ~3.150–3.200.
⸻
🎯 What might happen next?
Bull scenario (more likely if BTC also increases)
1. Breakout 3,150–3,200 → retest → move to:
• USD 3,475 (major resistance + SMA)
• then 3,800+
2. MACD makes a bullish cross → momentum is growing.
Probability: ~60%, but confirmation only after the breakout.
⸻
The Bears Scenario
1. Rejection from SMA (blue) and return below 3,000
2. Down to 2,750-2,800 again
3. If this breaks → move towards $2.126
Probability: ~40% at this point.

FTSE100 post-Budget rally: Inverse Head & Shoulders eyes 9800Chancellor Reeves unveiled tax rises worth £26 billion annually by 2029-30 but showed fiscal discipline by committing to reduce government spending as a share of GDP each year and more than doubling the fiscal headroom buffer to £21.7 billion, reassuring bond markets still scarred by the Liz Truss mini-budget crisis.
With gilt yields falling, sterling at its best level since October, and a Bank of England rate cut expected in December, the macro backdrop supports further upside for Footsie, though sticky inflation and OBR growth downgrades remain headwinds.
Key drivers:
UK Budget introduces tax rises totalling £26bn annually by 2029-30 via threshold freezes, mansion tax, and dividend levies, but spending will decline as a share of GDP each year, calming government borrowing concerns and sending gilt yields lower.
Fiscal headroom buffer more than doubled to £21.7bn (from £9.9bn last year), giving bond vigilantes confidence that the debt trajectory is sustainable.
Sterling rallied above 1.32 towards 1.33 on lower borrowing risks, while FTSE 100 gained, led by financials.
Bank of England expected to cut rates 25bp in December, supporting equities, though sticky inflation and OBR growth downgrades are headwinds.
Technical setup : inverse head and shoulders with neckline/support at 9,630 (38.2% Fib), measured move and Fib confluence target 9,800 (between 61.8% and 78.6% retracement).
Trade idea : Entry on pullback to 38.2% Fib (9,630), stop below previous low (9,434), target 9,800, for 2:1+ risk-to-reward.
Trading the FTSE bounce? Drop your setups in the comments and follow for more high-action technical and macro trade ideas.
This content is not directed to residents of the EU or UK. Any opinions, news, research, analyses, prices or other information contained on this website is provided as general market commentary and does not constitute investment advice. ThinkMarkets will not accept liability for any loss or damage including, without limitation, to any loss of profit which may arise directly or indirectly from use of or reliance on such information.

Coca-Cola Is Attacking All-Time HighsCoca-Cola is basically one of the most famous drink brands in the world. It started in the late 1800s in the U.S., and over time it turned into a huge global company. They’re known for their classic Coke, but they also make tons of other drinks—juices, waters, teas, and even energy drinks.
After that gap up, Coca-Cola filled that gap as expected and then turned higher and broke above 71.77 resistance. So the wave structure remains bullish, and we could still see a push to new highs, as wave C — possibly the final leg of an ending diagonal — may target the 76–78 area. So latest retracement toward 68 might have been just temporary setback ideally wave two and bulls are now ready for new highs. We remain bullish as long as price stays above 66.
Highlights:
Trend: Bullish (wave C continuation in w. 5)
Support: 71, 68, 66
Resistance: 74, 78
Note: Bullish above 66, watching for wave C resumption towards new highs.

LINKUSD - ChainLink | Biggest Oracle In CryptoHi,
Chainlink is the biggest blockchain platform that bridges blockchain-based smart contracts and real-time external data.
This is not a trading advice.
Thanks
Gex

GME Character LoopIn my other post I’m tracking GME’s big harmonic roadmap – here I’m zooming in on the story 'how price keeps acting along the way'.
On this chart I’ve marked the recurring “character loop”:
red double tops → red strong zigzag dumps → purple rounding tops inside demand zones → big upside legs.
You can see that script play out more than once: top out, dump hard into demand, carve a rounded base, then bang.
Right now we’ve just had another double top and sharp dump, and price is sitting in the upper green demand zone around the macro 0.618 support. I’ve marked a new potential purple rounding zone here, with a lower green box + “Rounding Top ????” as the next possible stage if this one fails.
I’m basically combining two views:
the harmonics as a possible macro roadmap
this repeating behaviour as the way GME often travels between those zones.
If buyers step in and we see that familiar rounding + push, it fits both stories. If this 0.618 cluster gives way, the script changes and the lower box comes into play.
Just mapping GME story behaviour and seeing if it stays in character.

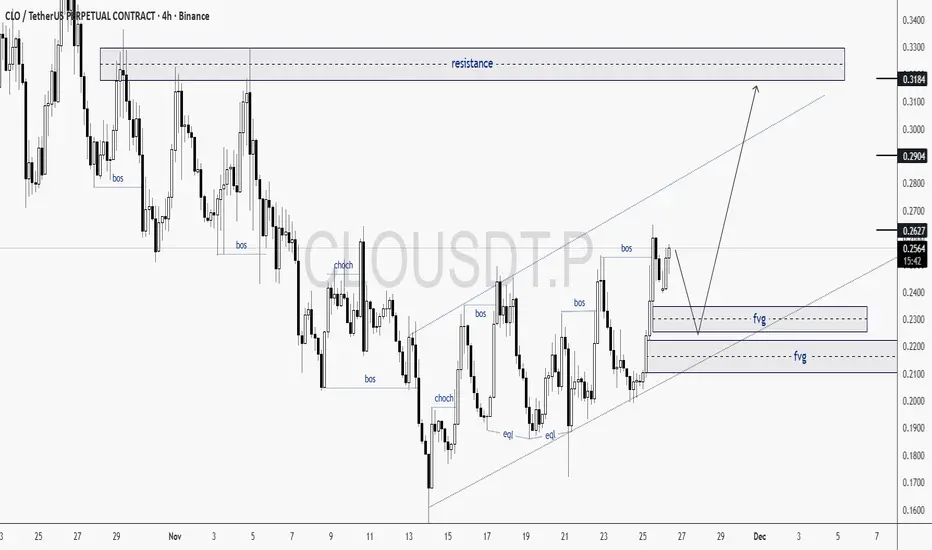
CLOUSDT Bullish Structure. Watching the FVG RetracementCLOUSDT.P on the 4H timeframe is maintaining a bullish structure after multiple BOS events and a clear CHoCH. These signals combined can have a bullish emphasis.
📌Expected Scenario
A dip into the nearest FVG (0.235–0.240 zone) or FVG (0.210–0.220) can be a high-probability long entry. After collecting liquidity, price is expected to expand upward toward 0.290 → 0.318 major resistance.
🎯Targets
TP1: 0.2627
TP2: 0.2904
TP3: 0.3184
SL: Close below 0.1990
Good Luck!
XAUUSD LONG 28/11Greetings,
Hello traders, this is the XAU-USD 15m important support zone.
Based on market trend and previous day movement.(white line)
Key levels;
Entry: 4163.21
Target: 4173.21
Stop loss: 4153.21
Risk Reward Ratio 1:1
Your likes and boosts motivate us to keep learning and sharing ideas!

AUD/CHF BEARS WILL DOMINATE THE MARKET|SHORT
Hello, Friends!
AUD/CHF is trending down which is clear from the red colour of the previous weekly candle. However, the price has locally surged into the overbought territory. Which can be told from its proximity to the BB upper band. Which presents a classical trend following opportunity for a short trade from the resistance line above towards the demand level of 0.520.
Disclosure: I am part of Trade Nation's Influencer program and receive a monthly fee for using their TradingView charts in my analysis.
✅LIKE AND COMMENT MY IDEAS✅

