Entry Timing: Wait for Catalysts, Find Optimal PositionsEntry Timing: Wait for Catalysts, Find Optimal Positions
The Federal Reserve's latest report states that interest rates will remain on hold, but future rate cuts will proceed at a slower pace—originally projected to reduce rates by 50 basis points this year, but now possibly only 25 basis points annually, akin to pressing the brake pedal gently without fully stopping. Powell also noted that while inflation has shown signs of rebounding, the impact of geopolitical conflicts on prices may be temporary. This has left the market confused: on one hand, it suggests the U.S. economy may not be as weak as feared, reducing the urgency for rate cuts; on the other, concerns persist that high rates could suppress consumption and investment.
Next week, the U.S. will release GDP data. If the data comes in better than expected, indicating robust consumer spending, the Fed may be less inclined to cut rates promptly, strengthening the U.S. dollar and potentially exerting downward pressure on gold prices. Conversely, if the data disappoints, market expectations for earlier rate cuts could intensify, allowing gold to rebound. Currently, the market is waiting for clear signals from the Fed, and this hesitant sentiment will also keep gold prices volatile.
If there is positive news from Iran-Europe talks or the U.S. GDP data exceeds expectations, gold prices may decline. Consider initiating light short positions when prices fall near $3,350 or rebound to around $3,390.
Analysis of gold trend next week, hope it helps you
XAUUSD sell@3380~3390
SL:3410
TP:3370~3360
Community ideas
Wait for ETHETH faced rejection at the weekly resistance near $2,700.
Price is likely to retest the current weekly support around the $2,100 zone.
Patience is key—wait for ETH to reach this support area before considering entry.
Disclaimer:
This analysis is based on my personnal views and is not a financial advice. Risk is under your control.

Bitcoin – Ritual Latency & Tactical Tension.⊢
⟁ BTC/USD – Binance – (CHART: 1H) – (June 21, 2025).
⟐ Analysis Price: $103,909.52.
⊢
⨀ I. Temporal Axis – Strategic Interval – (H1):
▦ EMA9 – ($103,783.82):
∴ The price oscillates around EMA9 with marginal bullish slope;
∴ Two candle rejections confirmed the EMA9 as a reactive short-term axis;
∴ Current close is above, but lacking directional follow-through.
✴️ Conclusion: Momentum attempt, yet unsupported – fragility persists.
⊢
▦ EMA21 – ($103,869.74):
∴ Flattened trajectory overlapping EMA9;
∴ Indicates tactical compression – a latency band rather than trendline;
∴ No breakout confirmation.
✴️ Conclusion: Equilibrium zone – direction undecided.
⊢
▦ EMA50 – ($104,212.18):
∴ Serves as immediate dynamic resistance;
∴ Price has not closed above since June 20, 13:00 UTC;
∴ Requires sustained move to invalidate micro-downtrend.
✴️ Conclusion: Key reversal barrier – price remains below structural trigger.
⊢
▦ SMA100 – ($104,552.65):
∴ Downsloping, acting as mid-term ceiling;
∴ No candle engagement in recent sessions;
∴ Confluence zone with EMA50 adds density.
✴️ Conclusion: Inertial resistance zone – trend continuity until breach.
⊢
▦ SMA200 – ($105,197.18):
∴ Highest structural ceiling on H1;
∴ Remains untouched, reinforcing broader tactical bearish bias.
✴️ Conclusion: SMA200 maintains bearish structure – trend remains capped.
⊢
▦ Bollinger Bands - (20,2):
∴ Bands tightened – low volatility configuration;
∴ Upper band slightly expands – minor opening signal;
∴ Price contacts upper range without strength.
✴️ Conclusion: Potential breakout pattern – requires volume ignition.
⊢
▦ RSI (14, smoothed by EMA9) – (11.00 | Avg: 13.85):
∴ RSI at historical low – indicative of exhaustion rather than momentum;
∴ EMA of RSI confirms suppressed structure;
∴ Hidden divergence plausible but not confirmed.
✴️ Conclusion: Latent reversal conditions – needs confirmation from RSI reclaim.
⊢
▦ MACD (12,26,9) – (MACD: 88.35 | Signal: -159.25 | Histogram: -247.60):
∴ Histogram remains negative but is narrowing;
∴ MACD line curling upward, approaching signal;
∴ No crossover yet – early recovery signal under surveillance.
✴️ Conclusion: Bullish divergence forming – reversal not validated.
⊢
▦ ATR (14, RMA) – (372.44):
∴ Volatility decreasing after a local spike;
∴ Range-bound structure indicates compression, not impulse.
✴️ Conclusion: Tactical latency – volatility may reawaken post-volume.
⊢
▦ Volume (21):
∴ Faint increase in last bullish candle – still below strategic threshold;
∴ Lacks institutional confirmation.
✴️ Conclusion: Spot activity insufficient – neutral, vulnerable structure.
⊢
🜎 Strategic Insight – Technical Oracle:
∴ H1 presents structural compression between EMA9/21/50, confirming tactical latency;
∴ RSI at deep oversold – signal of exhaustion, not yet momentum;
∴ Bollinger and MACD show early signs of kinetic preparation;
∴ The market is postured, not reactive – awaiting a directional event.
✴️ Tactical View: Structurally Neutral – Momentum Suspended, entry only upon RSI/Volume confirmation and MACD validation.
⊢
∫ II. On-Chain Intelligence – (Source: CryptoQuant):
∴ Update as of June 21, 2025 – Synchronized to H1 Structural Reading.
▦ Exchange Netflow Total – (All Exchanges) – (+692 BTC):
∴ Positive net inflow detected over 24h;
∴ Suggests moderate sell-side liquidity entering exchanges;
∴ Reflects defensive posturing, not panic-driven behavior.
✴️ Conclusion: Mild bearish pressure – not sufficient to invalidate structural base.
⊢
▦ Spot Taker CVD - (Cumulative Volume Delta, 90-day):
∴ Dominance of Taker Sell Volume confirmed – aggressive sellers remain in control;
∴ Pattern consistent over the last 6 sessions;
∴ No divergence between volume behavior and price structure.
✴️ Conclusion: Market remains tactically sell-biased – momentum driven by taker aggression.
⊢
▦ Spent Output Profit Ratio (SOPR) – (1.009):
∴ Marginally above 1.00 – coins being spent in mild profit;
∴ Absence of capitulation, but also no sign of deep conviction among holders;
∴ Stable rotation, not breakout-driven.
✴️ Conclusion: Structural neutrality – market is churning without direction.
⊢
▦ Adjusted SOPR (aSOPR) – (≈1.00):
∴ Flat – confirms lack of distribution or panic;
∴ Historically aligns with consolidation regimes.
✴️ Conclusion: Supply behavior is balanced – trend-neutral reading.
⊢
▦ Open Interest – All Exchanges – ($34.01B):
∴ Remains elevated – indicative of speculative leverage;
∴ Elevated risk of liquidation cascade on directional volatility;
∴ OI rising faster than spot volume = synthetic exposure dominating.
✴️ Conclusion: Market structurally exposed – fragile to external triggers.
⊢
▦ Funding Rate – All Exchanges – (-0.003):
∴ Slightly negative – shorts funding longs;
∴ Suggests bearish bias among leveraged participants;
∴ Conditions ripe for short squeeze if spot demand increases.
✴️ Conclusion: Contrarian setup building – tactical upside risk exists.
⊢
🜎 Strategic Insight – On-Chain Oracle:
∴ Metrics reflect a market under cautious speculative tension;
∴ No broad liquidation, no long-term holder exit – base intact;
∴ Taker dominance and leverage build-up suggest reactive positioning;
∴ System is neutral-leaning fragile – vulnerable to both triggers and traps.
✴️ Tactical Note: "Structurally Stable – Tactically Unsettled"
⊢
⧉ III. Contextvs Macro–Geopoliticvs – Interflux Economicus:
∴ Macro Landscape Reference – June 21, 2025.
▦ United States – Federal Policy & Risk Layer:
∴ Treasury Yield Curve remains slightly positive (+0.44%), removing short-term recession signal;
∴ 10Y yield elevated at 4.42% – reflects sustained inflation resistance and risk demand;
∴ Fed maintains QT stance – no rate cuts expected before September;
∴ Tension with Iran intensifying – military rhetoric entering fiscal discourse.
✴️ Conclusion: U.S. macro acts as compression catalyst – neutral on surface, volatile underneath.
⊢
▦ Strategic Bitcoin Reserve – (Executive Order – Trump):
∴ Recent Executive Order establishes BTC as sovereign asset class;
∴ Adds policy-level legitimacy to institutional accumulation;
∴ Reflects shift from “hedge” to “strategic reserve logic”.
✴️ Conclusion: Structural bull signal – narrative transition confirmed.
⊢
▦ China – Internal Stimulus & Soft Deflation:
∴ PPI negative at -3.3%, Retail Sales up 6.4% – stimulus-driven divergence;
∴ Fiscal revenue declining YTD – systemic drag despite easing;
∴ Not a current volatility driver.
✴️ Conclusion: China is neutral to crypto – reactive, not directive.
⊢
▦ European Union – Disinflation & Monetary Drift:
∴ HICP falls to 1.9%, ECB cuts deposit rate to 2.00%;
∴ PMI Composite < 50 – economic contraction quietly progressing;
∴ Forward guidance hesitant.
✴️ Conclusion: EU remains marginal – supportive for risk, but not catalytic.
⊢
▦ Global Fragmentation & SWIFT Erosion:
∴ Geopolitical blocs continue diverging – dollar-reliant systems weakening;
∴ Bitcoin seen increasingly as transactional hedge in sanctioned environments;
∴ De-dollarization dynamic accelerating.
✴️ Conclusion: Bitcoin positioned as neutral monetary rail – volatility shield and escape valve.
⊢
🜎 Strategic Insight – Interflux Macro Oracle:
∴ U.S. remains the dominant macro variable – its monetary and geopolitical stance defines volatility posture;
∴ Bitcoin structurally benefits from institutional legitimacy, but tactically suspended by risk-off layers;
∴ The system is internally calm, externally tense – volatility is downstream of Powell and geopolitical shock.
⊢
⌘ Codicillus Silentii – Strategic Note:
∴ Temporal structure remains compressed, yet technically reactive;
∴ On-chain behavior supports latent structural integrity, but reveals synthetic tension;
∴ Macro axis introduces dual asymmetry – stability in policy, instability in conflict;
∴ The system is in latency – not due to certainty, but due to mutual hesitation.
⊢
𓂀 Stoic-Structural Interpretation:
▦ Structurally Bullish.
∴ The underlying structure - long-term moving averages, exchange reserves, macro narrative, and holder behavior - remains intact and upward-biased;
∴ There is no technical breakdown or structural disassembly;
∴ It is the silent foundation - the “floor” of the chart remains elevated.
⊢
▦ Tactically Suspended.
∴ Although the structure points to strength, the present moment neither demands nor validates action;
∴ There is no volume, no ignition signal, no confirmation flow;
∴ Thus, the tactic is suspended - the trader (or observer) is in a disciplined state of observation, not execution.
⊢
⧉
⚜️ Magister Arcanvm (𝟙⟠) – Vox Primordialis!
𓂀 Wisdom begins in silence. Precision unfolds in strategy.
⧉
⊢

MRC: 0.99 | a Mining Telco jack of all stories SuperStock a cyclical issue with a great story backed up by solid funding
and experts across sectors
it is a survivor
and it rewards early speculators
even strong hands who can average down before the facts news and disclosures
whatever the TREND is
this stock is a facility for heavy hitters to bankroll
and make a windfall for those who got VOLUME at cost of HANDLER
Strategy: the usual Cost Average
Tactic: Buy High Price go Up
dna: DiGiPLUS ACEN DiTO

GOLD Bearish Breakout!
HI,Traders !
#GOLD is trading in a
UPtrend and Broke our of the bearish
Wedge pattern then made
A retest and is going down
Now so we are bearish
Biased and we will be
Expecting a further move down !
Comment and subscribe to help us grow !

What Happens Next? Has the up move started !?In line with my previous analysis, the price rose back above the lower trend line. Now looking at the detail of the bearish waves, it is possible that an up move could take the price to at least around 3440. That is my expectation. Keep in mind that this is a forecast as a result of an analysis.

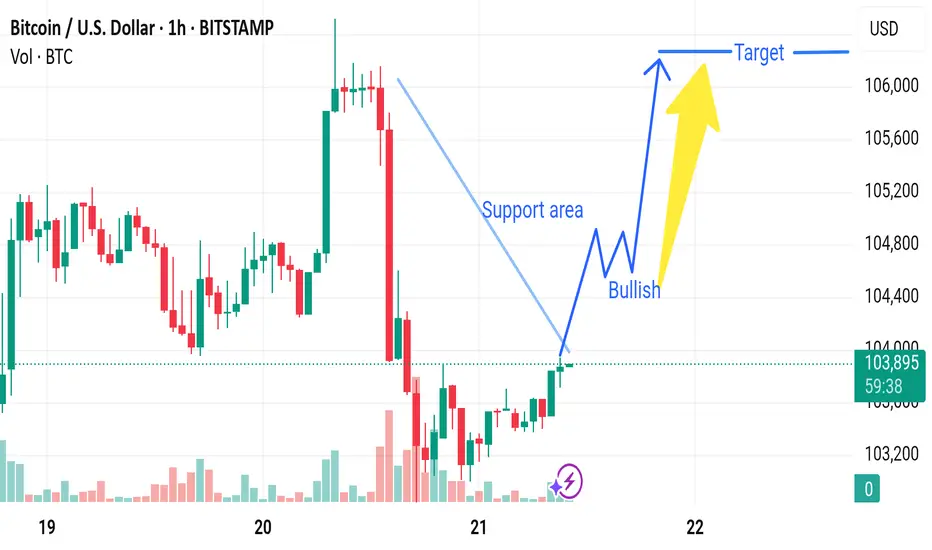
Market next target 🔄 Disruption Analysis:
1. Weak Support Confirmation
The chart marks a "Support area," but there is no strong confirmation (e.g., a hammer or engulfing bullish candle with high volume).
Support zones are more reliable with multiple prior bounces; here, it seems newly identified and not yet validated.
2. Bearish Volume Signature
During the recent decline (before the support), the red volume bars are significantly larger, indicating strong selling pressure.
The recovery candles near support have low volume, which may signal lack of conviction from bulls.
3. Lower Highs Formation
Prior to the drop, we see a series of lower highs, hinting at weakening bullish momentum.
This could suggest a potential bearish continuation, especially if price fails to break above the last local high (~106,000).
4. Possible Bearish Retest
Instead of a bullish breakout, the current price might just be retesting the broken support-turned-resistance.
This is a common bull trap scenario where prices bounce slightly before resuming downward.
AAPL LONG TRADE (1H) – JUNE 21,2025 (NASDAQ|S&P 500 |NASDAQ 100)AAPL LONG TRADE (1H) - U.S STOCK
AAPL, despite remaining in a downtrend on higher timeframes, has shown signs of a limited upward move on the 1-hour chart. The stock has completed a V-shaped pullback and is now consolidating around a bullish Fair Value Gap (FVG) and a defined demand zone, signaling potential for a short-term bullish phase.
We anticipate this upward move to continue in the short term, targeting multiple key levels based on historical reaction zones and quantified projections.
🚨 TECHNICAL BUY CALL – AAPL 🚨
Buy Levels:
Buy 1: $200.92 (current price)
Buy 2: $198.50
Buy 3: $195.80
Buy 4: $193.50
Target Prices:
TP 1: $205.90
TP 2: $213.20
TP 3: $218.00
TP 4: $223.00
Stop Loss (Closing Basis): Below $188.00 | Risk Reward Ratio: 1:5.7
Caution:
Please buy in 3 parts within the buying range. Close at least 50% of your position at TP1 and trail the stop loss to protect profits in case of unforeseen market conditions.

TOTAL3 - Reversal incoming?!We just hit the trend reversal area on CRYPTOCAP:TOTAL3 , which immediately led to a bounce.
A reversal from this level is very likely —
even though the recent drop formed a bearish structure that could potentially bring us back down to the April 7th lows.
Still, in my view, the more likely direction is to the upside.
The coming days and weeks will show how this plays out.

Short on GOLD for the first min of the dayJust a small idea of what could happen at the begging of the market on Mon
ETH READY TO GO 3000$ ???🔍 ETH/USDT Analysis – Daily Timeframe
ETH is currently trading at $2,427, holding above the key support zone around $2,370 - $2,390, which is aligned with the 100 EMA. This zone has acted as a strong accumulation area.
📈 Market Structure:
Price is consolidating inside a horizontal range. A confirmed breakout above the resistance zone ($2,650 - $2,700) could lead to a bullish continuation towards the major resistance at $2,861.
📊 Technical Outlook:
Trend: Sideways range (accumulation phase)
100 EMA: Acting as dynamic support
Breakout Potential: Bullish continuation expected on breakout and retest
📌 Trade Plan (Not Financial Advice):
Entry Idea: Break and close above $2,700 zone
Target: $2,861 and higher
Invalidation: Daily candle close below $2,370
ETH is building strength above its 100 EMA. A breakout from this range can trigger a fresh bullish leg.
🔁 Like & share your opinion! Always DYOR before trading.

THE KOG REPORT - FOMCTHE KOG REPORT – FOMC
This is our view for FOMC, please do your own research and analysis to make an informed decision on the markets. It is not recommended you try to trade the event if you have less than 6 months trading experience and have a trusted risk strategy in place. The markets are extremely volatile, and these events can cause aggressive swings in price.
A you can see traders the pre-event price action started yesterday with the hourly now playing between the MA’s and waiting for FOMC for a potential breakout. As usual, we have highlighted the key levels and added the red boxes for all of you to help navigate the movement should this not be priced in.
Also remember, there is a press conference after the release, this is usually the time the market will react to anything Powell says about future plans for the economy.
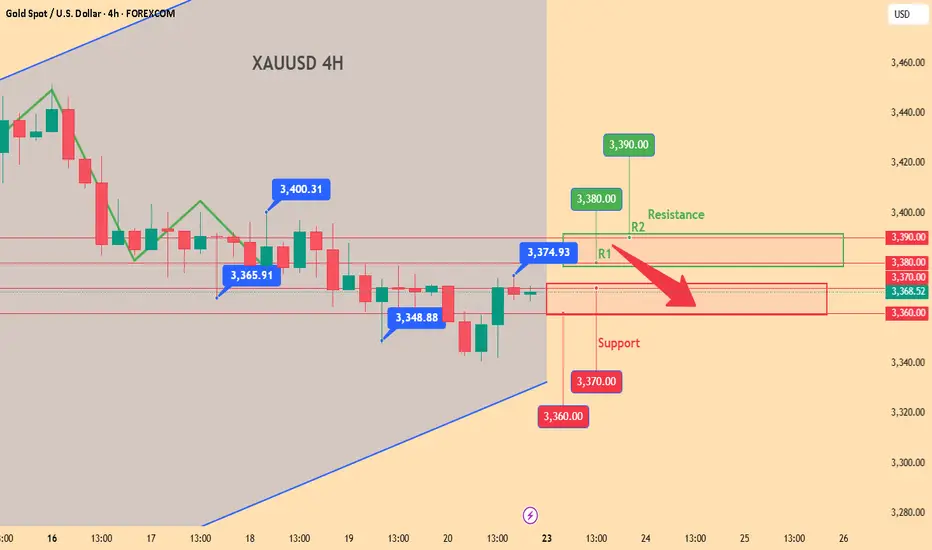
Now, looking at the 4H, we have support at the 3370-65 level and below that 3355. If these are attacked and give a RIP, opportunity for the long trade may be available into the 3395 red box which price will need to break to go higher. If we can break above this red box, we can then look to attempt higher price with the levels 3430, 3445 and above that 3455-60 on the horizon. It’s that red box sitting higher up around the 3470-75 region which needs to be watched if we do get up there as an opportunity to attempt the reverse trade may present itself from there depending on the volume.
So in summary, we have 3 key levels in play, ideally a move upside and rejection from the 3400-6 level giving a further dip would suit buyers to get better pricing.
KOG’s RED BOX TARGETS:
BREAK ABOVE 3395 for 3404, 3406, 3410, 3420, 3430, 3435 and 3459 in extension of the move
BREAK BELOW 3380 FOR 3375, 3364, 3351, 3342, 3333 AND 3327 IN EXTENSION OF THE MOVE
LEARN AND GENERATE YOUR OWN SIGNALS. You don't need any of us to guide you.
Please do support us by hitting the like button, leaving a comment, and giving us a follow. We’ve been doing this for a long time now providing traders with in-depth free analysis on Gold, so your likes and comments are very much appreciated.
As always, trade safe.
KOG

Bitcoin and the descending channel it consistently followsAccording to the UTC+3 time zone, there is a Bitcoin channel between the 23:00 and 03:00 candles on May 21, which uses the width of the channel (the yellow channel). If we copy the same channel and place it at the upper wick of the 15:00 candle on May 27, we get the green channel. Similarly, by copying the yellow channel and aligning it with the lower wick of the 03:00 candle on May 22, which is one of the first two white candles at the start of the channel, we get the orange channel. The blue channel, on the other hand, is my prediction. In addition, not only the 0 and 1 points (solid line) of the channels but also the 0.5 (short line), 0.25, and 0.75 (dotted lines) levels act as support and resistance.

We need to hold the line! I’m not too bearish just yet
Definitely looking for this line to hold.
Still above 100k
Think we will be just fine
One more week left in the month

uraniumThe 10-year Treasury bond yield plays a significant role in the energy markets, including uranium, by influencing financing costs, investment decisions, and broader economic sentiment, which in turn affect uranium demand and pricing dynamics.
Significance of the 10-Year Bond Yield in Uranium and Energy Markets:
Benchmark for Financing Costs
The 10-year Treasury yield serves as a benchmark for long-term borrowing costs for utilities and mining companies involved in uranium production and nuclear energy infrastructure.
Higher yields increase the cost of capital, potentially delaying or raising the cost of new uranium mine developments and nuclear plant investments. Conversely, lower yields reduce financing costs, supporting expansion and production.
Indicator of Economic and Inflation Expectations
Rising 10-year yields often signal expectations of stronger economic growth and inflation, which can boost energy demand, including uranium for nuclear power generation.
Declining yields typically reflect economic caution or slowdown, which may temper energy demand growth.
Impact on Utility Procurement Behavior
As uranium accounts for only about 5–10% of nuclear power generation costs, utilities prioritize securing supply to avoid operational disruptions, even at higher prices.
When bond yields are stable or falling (indicating lower financing costs and economic uncertainty), utilities are more likely to lock in long-term uranium contracts aggressively, driving prices higher.
Recent market conditions with the 10-year yield around 4.5% have coincided with utilities purchasing uranium in record quantities, pushing prices to 15-year highs.
Geopolitical and Supply Risk Amplification
The uranium market is sensitive to geopolitical risks, especially given that over half of global uranium supply and processing is controlled by countries within Russia’s sphere of influence.
Rising bond yields amid geopolitical tensions can increase risk premiums on uranium prices as investors and utilities seek supply security.
Investor Confidence and Capital Flows
The 10-year Treasury yield reflects investor confidence and risk appetite. Higher yields can attract capital away from commodities toward fixed income, potentially dampening speculative interest in uranium.
Conversely, lower yields can boost commodity investment appeal as investors seek higher returns, supporting uranium prices.
In essence, the 10-year Treasury yield is a crucial macro-financial gauge that indirectly shapes uranium market dynamics by affecting financing, demand expectations, and risk perceptions, thereby influencing uranium prices and investment decisions in the energy sector.
Key Use Cases of Uranium
Uranium serves critical functions across multiple sectors:
Nuclear Energy Fuel for commercial reactors generating electricity which Provides 10% of global electricity with low carbon emissions
Medical Isotopes ,the Production of radioisotopes (e.g., Technetium-99m) Enables cancer diagnostics and treatment through PET scans
the Military/Defense use uranium for Nuclear weapons , naval propulsion systems and the Powering of submarines and aircraft carriers
Space Exploration using Nuclear thermal propulsion with Potential fuel for long-duration space missions.
Scientific Research and Geological dating and particle physics which Studies earth's age and fundamental particles all apply uranium .
Demand drivers:
72 new nuclear reactors under construction globally (as of 2025)
Medical isotope market growth (7.2% CAGR projected)
Space agency investments in nuclear propulsion
Investment Considerations
Price volatility: Uranium spot prices impact producer profitability but long-term contracts provide stability
Sector-specific risks: Regulatory constraints, waste management challenges, and geopolitical factors affect uranium investments
Growth areas: Small modular reactors (SMRs) and radioisotope production represent emerging opportunities
Conclusion: Uranium's value stems from its diverse applications in energy, medicine, defense, and science. While no dedicated "uranium bond" exists, the sector's performance is reflected in mining stocks and long-term contracts. The metal's fundamental importance in clean energy and advanced technology underpins its long-term market position.

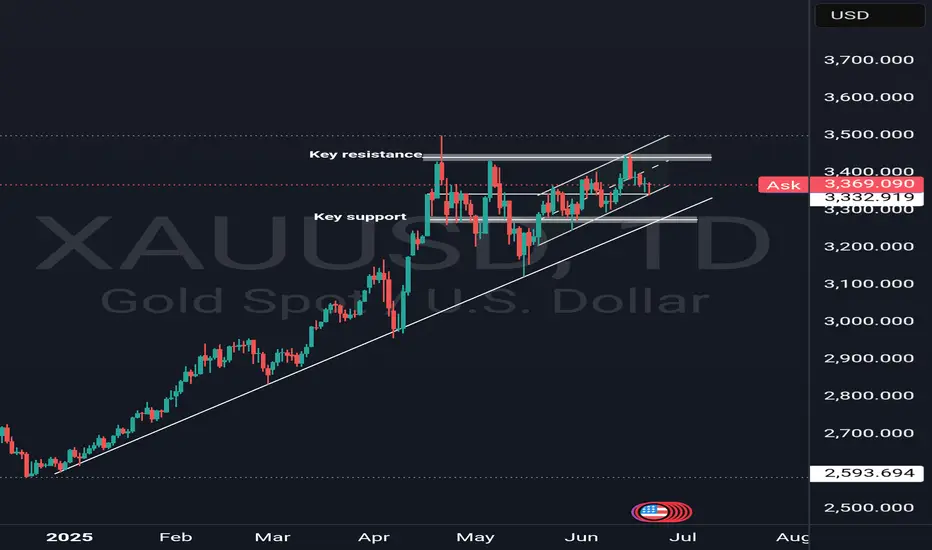
Gold out look Daily Timeframe Analysis
Gold continues to respect its medium to long-term bullish structure on the daily timeframe. Despite the ongoing geopolitical tensions and war-driven headlines, price action has experienced a corrective pullback from the key resistance area near 3430.
Importantly, gold appears to be forming a minor bullish channel within a broader consolidation zone suggesting that price is currently in a range-bound correction phase nested inside a higher-timeframe uptrend. The channel structure reflects healthy consolidation, not a trend reversal.
Chart Reference: Daily Chart
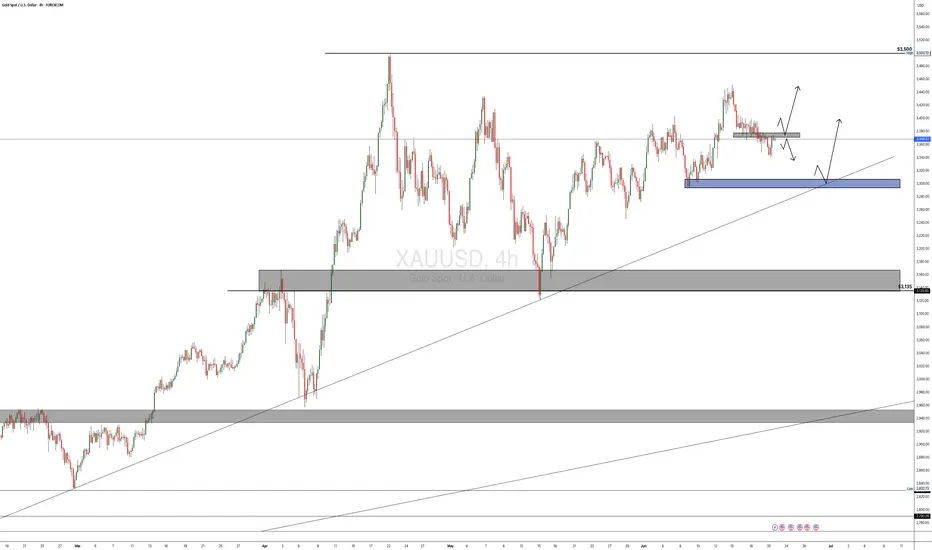
3-Hour Timeframe (Intraday Structure)
The 3H chart shows price recently reacting from the bullish channel support, confluenced with a demand zone and the Fibonacci golden zone indicating a strong technical base. A new fresh demand zone has been created as a result of this reaction.
Price is currently holding above the minor intraday structure at 3365.
If this level holds, short-term targets are 3377 – 3380.
A confirmed break and retest above 3380 opens up the next leg toward 3400 – 3404 resistance.
Chart References:
Fundamental Backdrop
A combination of macroeconomic and sentiment-based indicators support the bullish bias:
COT (Commitment of Traders) data shows institutional positioning remains net long on gold.
Retail sentiment is skewed towards short, which historically supports upside moves.
Seasonal bias for gold typically favors strength during mid-to-late Q2.
US economic indicators show signs of cooling:
Manufacturing PMI & Services PMI have slowed.
Retail sales remain soft.
Inflation readings suggest disinflationary pressure.
These factors collectively weaken the US dollar, adding upside pressure to gold.
Downside Risk / Bearish Scenario
If price fails to hold above 3365 and decisively breaks below the current channel, we could see a deeper correction toward the 3300–3280 area of interest which aligns with a major support, daily bullish trendline, and longer-term reaccumulation zone.
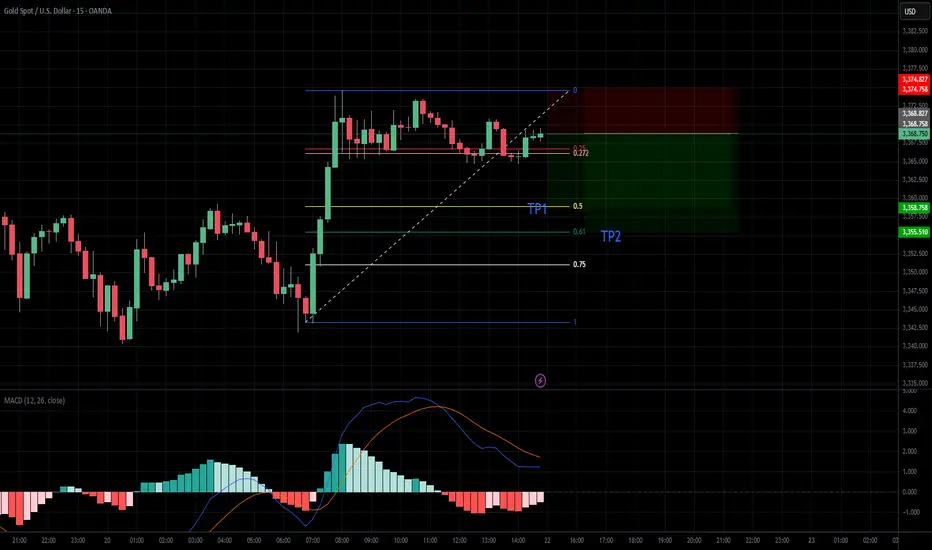
15-Minute Timeframe (Microstructure Insight)
On the 15M chart, gold rallied from the channel base and demand zone, but has since entered a consolidation phase between 3365 and 3372. A Fair Value Gap (FVG) lies just beneath the 3365 pivot — suggesting the potential for a liquidity sweep before any continued move to the upside.
This setup is often a precursor to an aggressive expansion move, particularly during high-volume sessions (London/New York overlap).
Summary
Bias: Bullish (while above 3365)
Immediate Support: 3365
Short-Term Targets: 3377 → 3380 → 3404
Key Resistance: 3430
Bearish Invalidations: Below 3365
NG1!: Bulls Are Winning! Long!
My dear friends,
Today we will analyse NG1! together☺️
The market is at an inflection zone and price has now reached an area around 3.894 where previous reversals or breakouts have occurred.And a price reaction that we are seeing on multiple timeframes here could signal the next move up so we can enter on confirmation, and target the next key level of 3.993.Stop-loss is recommended beyond the inflection zone.
❤️Sending you lots of Love and Hugs❤️

XAUUSD POSSIBLE TRADE SETUPPotential Trade Setup on XAUUSD
Overview:
Gold (XAUUSD) has shown consistent bullish momentum for over 16 months. Recently, we’ve seen a continuation of that strength, especially after breaking above the key $2,320 resistance zone. While there has been some temporary consolidation, the overall bullish structure remains intact, supported by ongoing geopolitical tensions and inflation hedging.
That said, I am still anticipating a possible continuation of the bullish momentum that has been in play for quite some time. Moving forward, I will be looking for a clear break above the 3380 region — followed by a successful retest of the breakout zone — before entering a long position.
Alternatively, a short opportunity may arise if the 3350 intraday resistance holds and the price fails to break above it. In that case, I will look for signs of further downward momentum toward the 3300 region.
🧭 Trading Plan:
✅ BUY:
Look for a break and retest of the 3355 region on the 4H timeframe.
🔻 SELL: Bias (Alternative Scenario):
If the price stays below the 3350 zone, then look for a potential short opportunity moving forward.
🎯 Targets & Risk Management: Targeting 1:2 R:R on both setups.
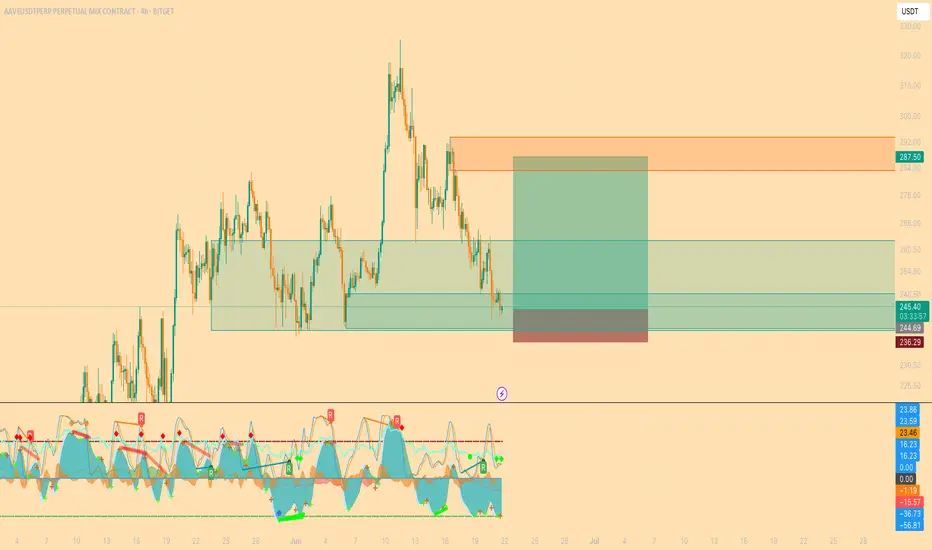
AAVEUSDT | Long Setup – Order Block + MARKET CIPHER BAAVE is currently presenting a compelling long opportunity supported by multiple technical factors:
📦 Order Block Reaction:
Price has tapped into a previously defined demand zone (order block) where strong buying interest was seen before. This level often acts as a magnet for liquidity and offers a solid risk-managed entry.
📉 Price Action Structure:
After sweeping the previous local low (liquidity grab), price has started to show signs of a higher low and higher high formation on lower timeframes — a classic reversal signal.
📊 Market Cipher B Confirmation:
Momentum shift with a green dot
Strengthening momentum waves
Money flow gradually turning positive
Oversold bounce indication
🎯 Target: 287.50 USDT
🛡️ Stop Loss: 236.29 USDT
📈 Risk/Reward Ratio: Favorable and supported by multi-layered confluence
This setup gains strength from the combination of smart money concepts, clean price action, and reliable indicator signals.
⚠️ Not financial advice. Always do your own risk management.
#AAVE #CryptoTrading #PriceAction #MarketCipher #Altcoins #SmartMoney #TradingView #AAVEUSDT
MAGIC/USDTKey Level Zone: 0.1520 - 0.1550
LMT v2.0 detected.
The setup looks promising—price previously trended upward with rising volume and momentum, then retested this zone cleanly. This presents an excellent reward-to-risk opportunity if momentum continues to align.
Introducing LMT (Levels & Momentum Trading)
- Over the past 3 years, I’ve refined my approach to focus more sharply on the single most important element in any trade: the KEY LEVEL.
- While HMT (High Momentum Trading) served me well—combining trend, momentum, volume, and structure across multiple timeframes—I realized that consistently identifying and respecting these critical price zones is what truly separates good trades from great ones.
- That insight led to the evolution of HMT into LMT – Levels & Momentum Trading.
Why the Change? (From HMT to LMT)
Switching from High Momentum Trading (HMT) to Levels & Momentum Trading (LMT) improves precision, risk control, and confidence by:
- Clearer Entries & Stops: Defined key levels make it easier to plan entries, stop-losses, and position sizing—no more guesswork.
- Better Signal Quality: Momentum is now always checked against a support or resistance zone—if it aligns, it's a stronger setup.
- Improved Reward-to-Risk: All trades are anchored to key levels, making it easier to calculate and manage risk effectively.
- Stronger Confidence: With clear invalidation points beyond key levels, it's easier to trust the plan and stay disciplined—even in tough markets.
Whenever I share a signal, it’s because:
- A high‐probability key level has been identified on a higher timeframe.
- Lower‐timeframe momentum, market structure and volume suggest continuation or reversal is imminent.
- The reward‐to‐risk (based on that key level) meets my criteria for a disciplined entry.
***Please note that conducting a comprehensive analysis on a single timeframe chart can be quite challenging and sometimes confusing. I appreciate your understanding of the effort involved.
Important Note: The Role of Key Levels
- Holding a key level zone: If price respects the key level zone, momentum often carries the trend in the expected direction. That’s when we look to enter, with stop-loss placed just beyond the zone with some buffer.
- Breaking a key level zone: A definitive break signals a potential stop‐out for trend traders. For reversal traders, it’s a cue to consider switching direction—price often retests broken zones as new support or resistance.
My Trading Rules (Unchanged)
Risk Management
- Maximum risk per trade: 2.5%
- Leverage: 5x
Exit Strategy / Profit Taking
- Sell at least 70% on the 3rd wave up (LTF Wave 5).
- Typically sell 50% during a high‐volume spike.
- Move stop‐loss to breakeven once the trade achieves a 1.5:1 R:R.
- Exit at breakeven if momentum fades or divergence appears.
The market is highly dynamic and constantly changing. LMT signals and target profit (TP) levels are based on the current price and movement, but market conditions can shift instantly, so it is crucial to remain adaptable and follow the market's movement.
If you find this signal/analysis meaningful, kindly like and share it.
Thank you for your support~
Sharing this with love!
From HMT to LMT: A Brief Version History
HM Signal :
Date: 17/08/2023
- Early concept identifying high momentum pullbacks within strong uptrends
- Triggered after a prior wave up with rising volume and momentum
- Focused on healthy retracements into support for optimal reward-to-risk setups
HMT v1.0:
Date: 18/10/2024
- Initial release of the High Momentum Trading framework
- Combined multi-timeframe trend, volume, and momentum analysis.
- Focused on identifying strong trending moves high momentum
HMT v2.0:
Date: 17/12/2024
- Major update to the Momentum indicator
- Reduced false signals from inaccurate momentum detection
- New screener with improved accuracy and fewer signals
HMT v3.0:
Date: 23/12/2024
- Added liquidity factor to enhance trend continuation
- Improved potential for momentum-based plays
- Increased winning probability by reducing entries during peaks
HMT v3.1:
Date: 31/12/2024
- Enhanced entry confirmation for improved reward-to-risk ratios
HMT v4.0:
Date: 05/01/2025
- Incorporated buying and selling pressure in lower timeframes to enhance the probability of trending moves while optimizing entry timing and scaling
HMT v4.1:
Date: 06/01/2025
- Enhanced take-profit (TP) target by incorporating market structure analysis
HMT v5 :
Date: 23/01/2025
- Refined wave analysis for trending conditions
- Incorporated lower timeframe (LTF) momentum to strengthen trend reliability
- Re-aligned and re-balanced entry conditions for improved accuracy
HMT v6 :
Date : 15/02/2025
- Integrated strong accumulation activity into in-depth wave analysis
HMT v7 :
Date : 20/03/2025
- Refined wave analysis along with accumulation and market sentiment
HMT v8 :
Date : 16/04/2025
- Fully restructured strategy logic
HMT v8.1 :
Date : 18/04/2025
- Refined Take Profit (TP) logic to be more conservative for improved win consistency
LMT v1.0 :
Date : 06/06/2025
- Rebranded to emphasize key levels + momentum as the core framework
LMT v2.0
Date: 11/06/2025

Altseason AnalysisTo determine whether we're approaching a true Altseason, we're analyzing the macro relationship between Bitcoin Dominance (BTC.D) and Total 2 (the total crypto market cap excluding Bitcoin). This comparison has consistently revealed where capital is flowing and helps signal shifts in market cycles.
Current Market Structure
BTC Dominance: Currently at 64% and testing resistance zone.
A breakdown below 57% could trigger fresh capital rotation into alts.
Total 2: Hovering near 1.2T ; watching for breakout confirmation.
What Triggers an Altseason?
BTC stability or slow upward grind: Altcoins thrive when Bitcoin is stable not crashing, not parabolic.
BTC.D Breakdown: Often the first real signal. Look for confluence with Total 2 breakout.
Capital Rotation: Watch Ethereum and majors big cap — they usually lead before microcaps follow.
BTC.D Breakdown: Often the first real signal. Look for confluence with Total 2 breakout.
$5 Trillion??
Breakout above $1.7T ATH in Total 2 opens the door for exponential price discovery.
Key resistance zones: $2T → $3.5T → $5T
Watch for volume surge + BTC.D breakdown for strong confirmation.
Caution:
Not every BTC.D dip leads to an Altseason fakeouts happen. Confirm with Total 2 strength and sector rotation.

Cycle Last LegThis present cycle is near its end. Pico top will arrive soon, probably by the end of November. BTC is currently ranging (103-109) forming a new base at 106, which is the current point of control. The start of the next and final up leg should start early July, so we have less than 2 weeks to remain patient.
Stand fast. Keep faith. Remain vigilant.

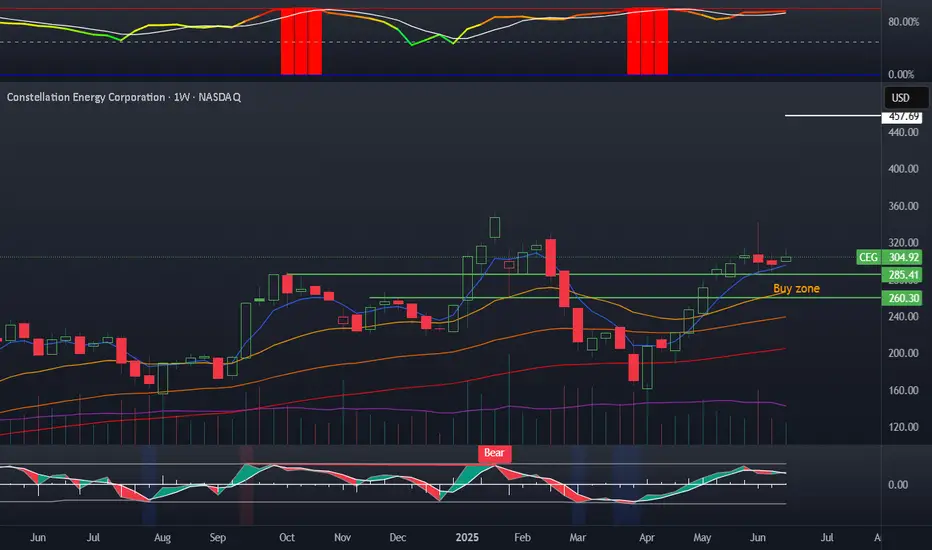
CEG on the watch listI have been following CEG for a while and am looking to obtain more energy expansion in my portfolio. I would LOVE to buy this stock closer to 275, but this might now happen. There have been weekly wicks into the top of the buy zone, so far I have missed the opportunity as I am in other plays. We note a ranging stochastic, and very elevated volatility. This is because energy growth stocks are associated with Ai expansion. CEG recently partnered with microsoft to restart the 3 mile island nuclear plant but with upgraded technology and safety features. The market might still be soured on nuclear, but it remains a very effective energy source.