"GOLD Bandit Strategy: Loot Pips Like a Pro!🏆 GOLD HEIST ALERT! 🏆 XAU/USD Bandit Strategy (Swing/Day Trade)
Steal Pips Like a Pro! 💰🔓 Bull vs. Bear Raid Plan
🌟 Greetings, Market Pirates! 🌟
"The trend is your accomplice—time to loot!"
🔮 Thief’s Technical & Fundamental Intel:
XAU/USD (The Gold Vault) is flashing BEARISH signals, but we’re ready to raid both sides! Follow the heist blueprint below 👇
🎯 ENRY POINTS (Where to Strike!)
🏴☠️ LONG RAID (Bullish Thieves):
Break & Grab: Enter above 3450.00 (Pullback Zone)
"Wait for the breakout, then ambush!"
🐻 SHORT RAID (Bearish Bandits):
Sneak Attack 1: Sell below 3300.00
Sneak Attack 2: Sell below 3260.00 (Support Wall Cracked!)
🛑 STOP-LOSS (Escape Routes)
Bullish Trade: SL at 3230.00 (Guard your loot!)
Bearish Trade 1: SL at 3360.00 (Don’t get caught!)
Bearish Trade 2: SL at 3280.00 (Risk = Reward!)
(Adjust SL based on your risk appetite & lot size!)
💰 TAKE-PROFIT (Cash Out & Flee!)
Bullish Thieves: TP at 3270.00 (Or escape early!)
Bearish Bandits (1): TP at 3270.00
Bearish Bandits (2): TP at 3210.00 (Big score!)
⚠️ WARNING: Market Traps Ahead!
News = Danger Zone! 📢 Avoid new trades during high-impact news.
Trailing SL = Your Getaway Car! Lock profits & evade reversals.
📰 FUNDAMENTAL BACKUP (Why This Heist Works)
Bearish momentum fueled by macro trends, COT data, & sentiment.
Stay sharp—markets shift fast!
💥 BOOST THIS HEIST! 💥
Like & Share to strengthen our pirate crew! 🚀 More alerts = More profits!
🚨 Next Heist Coming Soon… Stay Tuned! 🚨
Community ideas

My plan for GoldShould we plan for a 600 pip profit on gold this week? I suggest you check the chart after withdrawing the liquidity shown.

UNIUSDT.P – LONG SETUPCandle Craft fam — here’s a clean long opportunity shaping up on UNIUSDT.P (2D) that aligns with our strategy: momentum continuation backed by structure, not hype.
UNI just broke out of a multi-month range and is now consolidating right below resistance, printing a textbook bullish continuation flag on the 2D chart. The trend is strong, volume confirms, and the structure is respecting higher lows.
This is the kind of move that builds legs if BTC remains stable. Here’s how I’m positioning:
⸻
🟢 LONG ENTRY PLAN (2 Options):
1. Breakout Entry
• ✅ Entry Trigger: Above 11.10
• ⛑️ SL: 9.95 (below structure low)
• 🎯 Targets:
• TP1: 13.00
• TP2: 15.50
• TP3: 18.00+
2. Retest Entry (More Conservative)
• Entry Zone: 9.60 – 10.00
• SL: 8.80
• Targets: same as above ☝️
⸻
📊 Why This Setup Matters:
• Broke major range on strong volume
• Consolidating in a controlled pullback — bullish sign
• 2D structure showing strength (HH + HL)
• No divergence, no breakdown — just accumulation and compression
⸻
🧩 Candle Craft Note:
We favor structured breakouts, not emotional pumps. This setup gives us both entry flexibility and clean invalidation levels. Perfect R/R, perfect structure — we’re executing with discipline.
Let’s stay sharp, team. The market rewards patience and precision.
— Candle Craft

XAUUSD Gold closed bearish and I’ll continue looking for sells. I’d prefer gold to retrace and create a LH and continue selling towards 3310. Last time price was around 3310, it had a massive bullish run so that’ll be the only area I’d sell to unless price breaks that support.

USDCHF Outlook: Further Downside Expected Next WeekUSDCHF is likely to continue its bearish momentum in the coming week. Technical signals suggest that the pair could drop further, potentially heading toward the 0.779 support zone. Traders should monitor for confirmation signals before entering short positions.

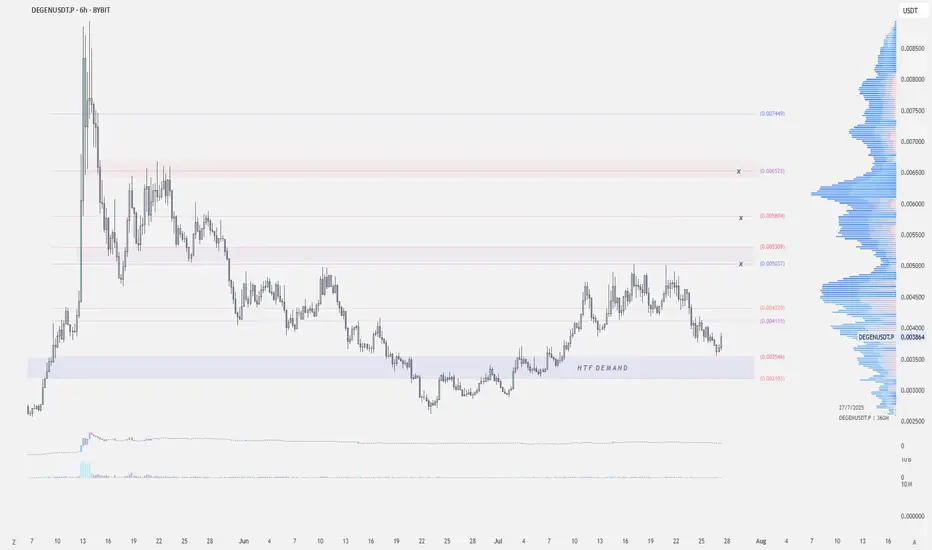
$DEGEN - Long SetupBYBIT:DEGENUSDT | 6h
Price is holding this HTF demand
Taking some long here .0038
DCA/Conservative Entry .0036-.0034
Stoploss: .0030
TPs:
.0043-.0045
.0050-.0053
.0054-.0058
Stock Market Forecast | TSLA NVDA AAPL AMZN META MSFTStock Market Forecast | CME_MINI:NQ1! CME_MINI:ES1! SPY QQQ
Mag 7 forecast NASDAQ:TSLA NASDAQ:NVDA AAPL AMZN META MSFT GOOG

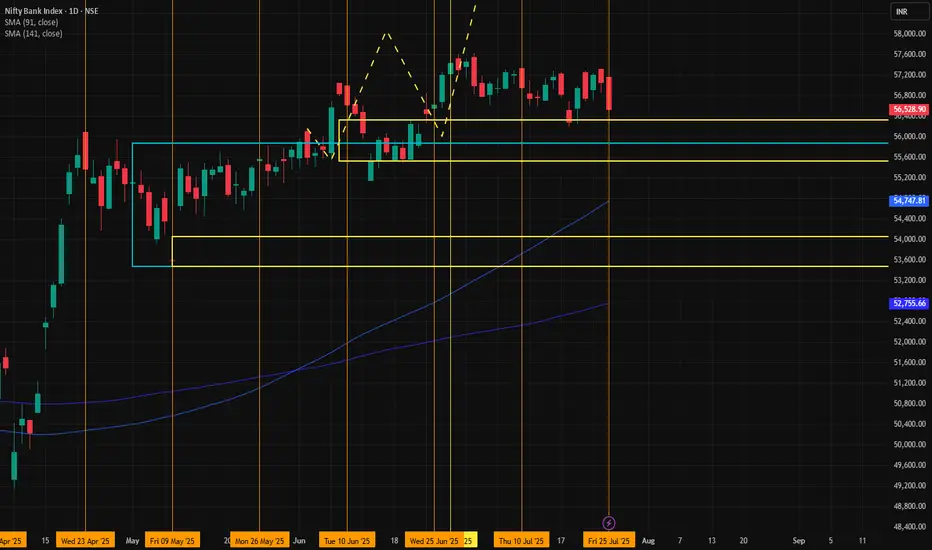
BANK NIFTY📈 Trade Setup Details
🔹 Trade Plan 1 (MTF-Based Entry)
Metric Value
Entry 56,223
Stop Loss 55,475
Risk 748 pts
Target 63,232
Reward 7,009 pts
Risk:Reward 1:9.4
🔸 Comment:
A high RR setup using the Daily DMIP zone. Ideal for trend continuation if price respects 55,780–56,223 range.
🔹 Trade Plan 2 (Deep Pullback Entry - ITF Zone)
Metric Value
Entry 54,054
Stop Loss 53,483
Risk 571 pts
Target 61,819
Reward 7,765 pts
Risk:Reward 1:13.6
🔸 Comment:
An aggressive RR trade if price retraces. Very favorable for swing traders anticipating bounce from deeper ITF demand zone.
🧭 Technical Landmarks
Key Level Value
Last High 55,467
Last Low 47,702
Point Range 7,765
🧠 Strategic Notes
Bias: Strong Bullish.
Preferred Entry: If price reacts bullishly at 56,223, can trigger first trade. If market dips, watch 54,054 for second trade.
Stop Loss Discipline: Clearly placed with low drawdown.
Trend Confirmation: All HTF zones are bullish, adding confidence to long entries.
🔍 Multi-Timeframe (MTF) Analysis Summary
Timeframe Trend Zone Type Proximal Distal Average
Yearly UP Rally-Base-Rally 54,467 44,429 49,448
Half-Yearly UP BUFL 54,467 49,654 52,061
Quarterly UP Rally-Base-Rally 54,467 49,156 51,812
HTF Avg. UP 54,467 47,746 51,107
| Monthly | UP | Rally-Base-Rally | 55,875 | 53,483 | 54,679 |
| Weekly | UP | Rally-Base-Rally | 56,328 | 55,381 | 55,855 |
| Daily | UP | DMIP (BUFL) | 56,223 | 55,780 | 56,002 |
| MTF Avg. | UP | | 56,142 | 54,881 | 55,512 |
| 240m | UP | DMIP | 55,942 | 55,475 | 55,709 |
| 180m | UP | DMIP | 55,597 | 55,475 | 55,536 |
| 60m | UP | DMIP | 55,597 | 55,475 | 55,536 |
| ITF Avg. | UP | | 55,712 | 55,475 | 55,594 |
✅ Conclusion: All timeframes are bullish, with higher highs and strong demand zones developing across MTF and ITF — indicating a clear uptrend continuation structure.
BTCUSD As BTCUSD fell back to 118k, we’ve some good break of structure to the downside with some good momentum seen from the H4 timeframe. Could this be giving us some good bearish sentiment? Or it’s just one of the mini-fluctuations pullbacks as they accumulate enough orders to push the BTCUSD markets even higher.

Teach me to fish, don’t hand me the catch.
---
🎯 **“Teach me to fish, don’t hand me the catch.”**
That’s the mantra behind what we do.
We’re not here to hand you quick wins—we’re here to equip you with the tools, mindset, and precision to master the art of **technical analysis**.
📚 **Follow Us** as we unlock proven strategies, crafted through years of experience and sharpened by real market conditions.
💼 **What You'll Get:**
- High-performance analysis techniques
- Visual case studies from our **actual trades**
- Clear examples from the insurance sector and beyond
- A blueprint to recognize and seize winning setups with confidence
💥 Whether you're new or seasoned, this isn't textbook theory.
This is **applied strategy**, built for clarity and verified by results.
---

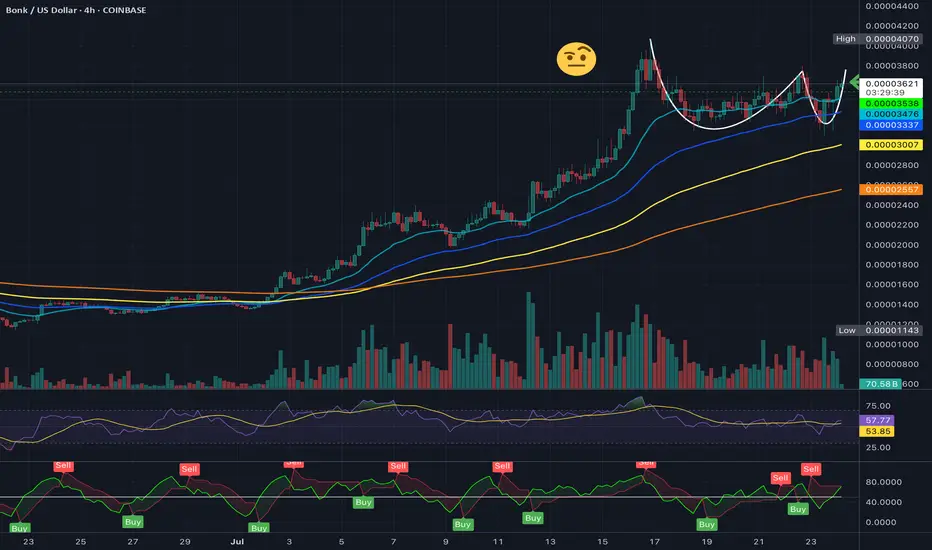
Its an ugly Cup & Handle, But one Nonetheless....$BONKThis isn't the prettiest formation of a Cup & Handle but playing out as one currently. A Pick up in volume should send this shit. LFG!
BULLISH H4 MOMENTUM ACTIVATED...?📊 Pattern & Structure:
The chart shows a downward channel (falling wedge) pattern that has recently been broken to the upside, indicating a bullish breakout.
The breakout is clean, with a sharp upward move, confirming the reversal from the bearish trend.
🔍 Key Levels Identified:
Support Zone:
142.284 – 141.790 (marked with an orange box)
This zone acted as a strong demand/support area.
Price bounced strongly after reaching this zone.
Immediate Resistance Levels:
145.799 – Near-term resistance.
147.000 – 147.629 – Key resistance zone (highlighted with a red horizontal line).
148.725 – Final bullish target/resistance on the chart.
📈 Bullish Scenario (highlighted with arrows and wave projection):
Price has broken out of the falling wedge, retested, and is pushing higher.
Target zone: 147.000–148.725.
The chart suggests a bullish projection, with further gains expected if the price sustains above 145.47.

FLS (SPOT)BINANCE:SLFUSDT
#SLF/ USDT
Entry (0.080 - 0.088)
SL 4H close below 0.0756
T1 0.100
T2 0.120
T3 0.147
Extra Target
T4 0.165
_______________________________________________________
Golden Advices.
********************
* collect the coin slowly in the entry range.
* Please calculate your losses before the entry.
* Do not enter any trade you find it not suitable for you.
* No FOMO - No Rush , it is a long journey.

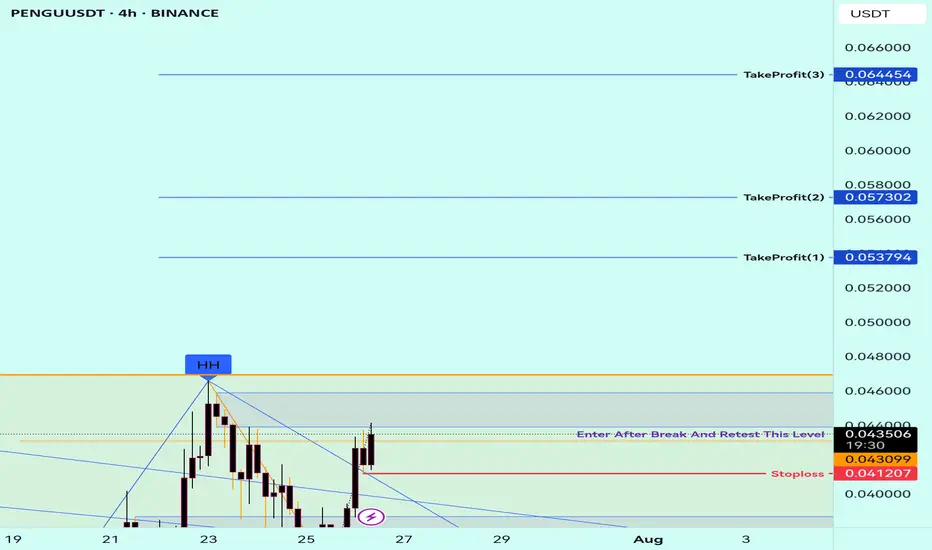
Buy Trade Strategy for PENGU: Betting on Meme Power and CommunitDescription:
This trading idea highlights PENGU, an emerging meme-based cryptocurrency that has gained popularity through its strong community support and viral potential. Inspired by internet culture, PENGU represents more than just humor — it taps into the growing trend of community-driven tokens that generate momentum through engagement, social media buzz, and grassroots marketing. With a limited supply and increasing visibility across platforms, PENGU positions itself within a niche market where speculation, culture, and community collide.
While meme coins like PENGU can offer explosive short-term potential, they also carry high levels of risk due to their dependence on community sentiment and lack of traditional utility or fundamentals. Market dynamics can shift rapidly, and what gains popularity quickly may also fade just as fast. Therefore, any investment in PENGU should be approached with caution.
Disclaimer:
This trading idea is for educational purposes only and does not constitute financial advice. Investing in cryptocurrencies, especially meme tokens like PENGU, involves significant risk, including the potential loss of all invested capital. Always conduct thorough research, understand the speculative nature of such assets, and consult a financial advisor before making any trading decisions. Past performance is not indicative of future results.
EU sell on minor structureEntry @ break and retest of minor support and trendlines minor and 1H
TP1 where 1H and 4H POC share @ 1.1693
which also -27 on minor fib
LH and LL showing on 1H structure,
On minor structure, price retraced 50%, retesting 1H trendline

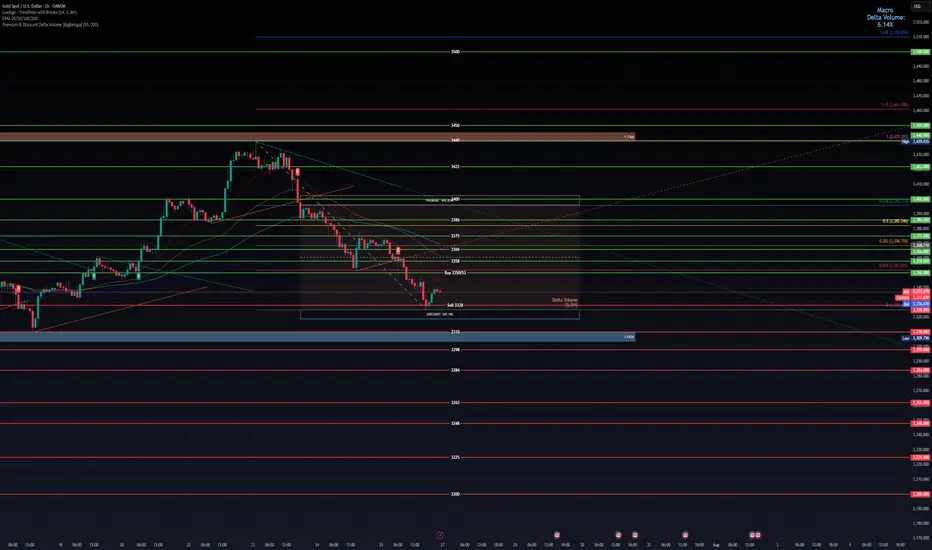
Gold weekly chart with both buy and sell entriesAnalysis of the Buy Entry: 2350/52
This level has been chosen as a potential long entry point due to a confluence of several technical factors.
Smart Money Concepts (SMC) - Discount Zone: The chart has a "Premium - Discount" range drawn over the recent downward price leg. The equilibrium (EQ) level is marked in the middle. According to SMC principles, traders look to buy assets at a "discount" (below the 50% EQ level) and sell at a "premium" (above the EQ level). Your buy entry at 2350/52 is located deep within the discount zone, making it an attractive price from this perspective.
Key Horizontal Support Level: The 2350 price is a significant psychological and technical level. Looking to the left of the chart, this area has previously acted as both support and resistance. By placing a buy order here, you are anticipating that this historical support level will hold again and cause price to bounce.
Potential Mean Reversion: At the point of entry, the price is significantly extended below the moving averages (the thin red, orange, and green lines). This can sometimes indicate an "oversold" condition in the short term, increasing the probability of a corrective bounce back up towards the moving averages (the "mean").
In summary, the buy entry is a calculated risk, betting on a bounce from a confluence of a deep discount price, a strong historical support level, and an oversold condition.
Analysis of the Sell Level: 2328
This level is critically important and likely serves two potential purposes: as a stop-loss for the buy trade, or as a trigger for a new short (sell) position.
Breakdown of Major Support: The chart highlights a significant support zone (the thick blue/grey box) roughly between 2330 and 2334. Your sell level at 2328 is placed just below this entire support structure and also below the most recent swing low. A price break below 2328 would signify a failure of this support, confirming that sellers are still in firm control.
Confirmation of Bearish Trend Continuation: In a downtrend, the price makes a series of lower highs and lower lows. A move down to 2328 would create a new lower low, reinforcing the bearish market structure and suggesting that the price is likely to continue much lower. This makes it an ideal place to exit a long position (cut losses) or to initiate a new short position to follow the dominant trend.
Order Flow and Volume Clues:
The note "Delta Volume?" next to this level suggests you are looking for confirmation from order flow data. A strong negative delta (more aggressive sellers than buyers) as the price breaks 2328 would provide strong confirmation for a short trade.
The label "LVN 2334.86" indicates a Low-Volume Node from a volume profile analysis. Price tends to move very quickly through these areas of low liquidity. By placing the sell level below the LVN and the support zone, you are anticipating an acceleration or a "flush" downwards once these key levels are breached.
In summary, the 2328 level is the invalidation point for the bullish "bounce" idea. If the price reaches this level, the reasons for buying are no longer valid, and the evidence strongly points towards a continuation of the downtrend.
Overall Strategy
The plan is to:
Enter a counter-trend long at 2350/52, anticipating a bounce from a strong support and discount zone.
Define risk by placing a stop-loss just below the key support structure at 2328.
Potentially use the 2328 level as a trigger to close the long and open a new short position to trade with the dominant bearish trend if the support level fails.
#XAUUSD H1 Setup – Smart Money Outlook📊 **#XAUUSD H1 Setup – Smart Money Outlook**
What we've been observing over the **last 3 sessions** is consistent **selling pressure** with **no meaningful pullback** yet — something that’s usually inevitable, even in strong downtrends.
🔁 A **retracement** is likely, and to identify key levels, we use the **Fibonacci Retracement Tool**.
---
### 🔍 **Market Sentiment Right Now**:
* Many traders are expecting a pullback into the **3348–3360 H1 Order Block**,
* Others are targeting **3368–3375** as a sell zone.
But here’s the twist:
⚠️ **Both these zones** could be potential **sell trap areas** (Fakeout Zone 1 & 2).
Why? Because **massive liquidity sits just above these levels**.
---
### 💡 **Smart Money Logic**:
Above the second fakeout zone lies an **inducement area** (liquidity pool).
And beyond that sits our **true institutional sell zone** at **3388–3393**, which aligns perfectly with the **Golden Fibo Zone (0.50–0.618)**.
📌 This is where we may see the **real bearish reaction**.
---
### 🟢 **Buy Setup Plan (Short-Term Opportunity)**:
If we get a **fully bullish H1 candle close above 3345**, we’ll look to **buy** with:
* **Entry:** Above **3345**
* **Stoploss:** Around **3332**
* **Target 1:** **3355**
* **Target 2:** **3368**
*(Potential final move into the trap zone)*
📢 **Important Note**: No buy will be considered without a strong **bullish H1 candle close** for confirmation. ✅
---
Let the market come to us — stay smart, not emotional. 🧠💰
\#SmartMoneyConcepts #XAUUSD #H1Analysis #LiquidityHunt #OrderBlock #GoldenFiboZone

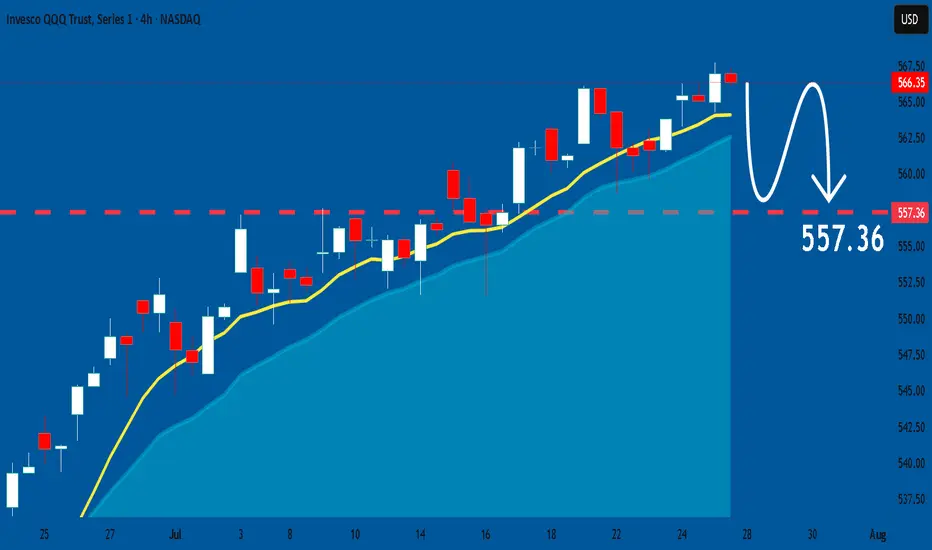
QQQ: Price Action & Swing Analysis
The analysis of the QQQ chart clearly shows us that the pair is finally about to tank due to the rising pressure from the sellers.
Disclosure: I am part of Trade Nation's Influencer program and receive a monthly fee for using their TradingView charts in my analysis.
❤️ Please, support our work with like & comment! ❤️
WHO WILL WIN BITCOIN'S RANGE BATTLE? In this weeks analysis, Bitcoin has been stack in a tight range for almost two weeks now. Trading range between $115k and $120k. Trend is still holding up for Bullish continuation but indicators strongly cautions loud Sirens. A decisive daily close above $120,200 could be the winning whistle for Bullish Continuation, while I see selling pressure to continue to the Support Block of about 113k. Also the selling Volumes are huge but prices are always quickly absorbed suggesting an accumulation is happening more than a distribution. So my thesis for Bitcoin is sideways range bound until there is a clear market winner. I will be paying much attention to the bearish alarm and a breakdown will be confirmed when daily price decisively close below $115k confirming the divergences on the chart. Trading between the range is high risk.

Gold: dropped on trade deals The safe-haven asset had its ups and downs during the previous week. The week started with an uptrend, where the price of gold reached its highest weekly level at $3.430, on trade tariff tensions. However, the deal made between the US and Japan, pushed the price toward lower grounds, ending the week at $3.340. In addition, Friday's drop was supported by announced tariffs negotiations between the US and EU in Scotland during the weekend.
The RSI dropped below the level of 50 on Friday, ending the week at the level of 48. The MA50 slowed down its divergence from MA200, however, the potential cross is still far away. Still, weekly lows of the price of gold found support at MA50 levels.
The week ahead brings several currently very important US macro data, including JOLTs, PCE, NFP and Unemployment data. In addition, the FOMC meeting will be held where the market will receive the latest Fed's view on economic developments in the country and future expectations. Also, further news on trade tariff agreements, especially regarding ongoing negotiations between the EU and the US in Scotland, might make an impact on investors sentiment for safe-haven assets. As per current charts, the price of gold might revert a bit to the upside, after a drop during the last three days of the previous week. In this sense, the resistance level at $3,4K might be tested. On the opposite side, the situation on charts is a little bit tricky. Namely, there is a line which perfectly connects all lows from February this year. Friday's closing was exactly at this line, which again adds to the probability of a short reversal. However, if, in any case, the price of gold breaks this longer term trend, then it will indicate that the longer path to the downside is in store for gold.

MARKETS week ahead: July 27 – August 2Last week in the news
Trade tariff (un)certainties shaped market sentiment during the previous week. The US-Japan trade deal was settled which brought some relaxation among investors. The US equities continued with a positive trend, with the S & P 500 reaching fresh all time highest level, ending the week at 6.388. On the same ground the price of gold turned a bit toward the downside, closing the week at $3.336. The relaxation was evident also in 10Y US Treasury yields, which closed Friday trading session at 4,38%. BTC had a short liquidation session on Friday, shortly reaching the $115K level, however, swiftly returned back toward the $118K.
The European Central Bank (ECB) held its July meeting during the previous week, where it held interest rates steady after seven consecutive cuts, signalling a more cautious approach going forward. While its macroeconomic outlook remains unchanged, the ECB sees downside risks to growth, including global trade tensions and weak market sentiment. President Lagarde downplayed concerns about the stronger euro and minor inflation undershooting, emphasizing a data-dependent, meeting-by-meeting policy stance. Although the ECB appears comfortable with its current position, a final rate cut in September is still possible if inflation or macro data disappoint.
President Trump announced a major trade deal with Japan this week, featuring a 15% reciprocal tariff, marking a shift in bilateral trade relations. The U.S. also reached a framework agreement with Indonesia, reinforcing efforts to strengthen trade ties across Asia. Trump signalled that more deals may be finalized before the August 1 tariff deadline, including potential progress with the EU, as a meeting with Commission President von der Leyen is set for Sunday in Scotland. These developments have been well received by investors, easing concerns over trade uncertainty and potential supply chain disruptions.
China unveiled a global AI action plan at the World Artificial Intelligence conference in Shanghai, calling for international cooperation on technology development and governance. Premier Li Qiang proposed establishing a global AI cooperation organization to coordinate regulation and infrastructure, emphasizing equitable access. The plan positions China in contrast to the U.S., favoring multilateralism over America's more block-oriented approach to AI strategy. Featuring participation from over 800 companies including domestic giants Huawei and Alibaba, the conference showcased thousands of AI innovations and signals China's ambition to challenge U.S. dominance in the field.
Palantir's stock achieved a new record high last Friday, rising over 2% and lifting its market cap to around $375B. With the latest move, the company is now holding 20th place as the most valuable U.S. company. The company's shares have more than doubled this year as investors' enthusiasm grows around its AI capabilities and government contract momentum. Analysts attribute the rally to Palantir's strengthened role in AI analytics and expansion in defence-related software and data contracts.
CRYPTO MARKET
The crypto market was traded in a mixed mode during the previous week. Some liquidations were made in BTC, followed by altcoins, however, there were also coins with relatively solid weekly performance. Total crypto market capitalization was increased by 1% on a weekly basis, adding total $39B to its market cap. Daily trading volumes were modestly decreased to the level of $275B on a daily basis, from $333B traded a week before. Total crypto market capitalization increase from the beginning of this year currently stands at +19%, with a total funds inflow of $600B.
BTC had a relatively flat week, with only $3B of funds inflow. On the other hand ETH continues to perform strongly, with another week in a positive territory of 5,3%, increasing its cap by $23B. XRP did not perform well on a weekly basis, as the coin had a drop in value of 7,4% and outflow of $15B. Some of the significant weekly gainers include Litecoin, with a surge of 13% on a weekly basis, Maker was traded higher by 14%, BNB gained 7%, while Solana was higher by 5% same as Uniswap. Other altcoins were traded either with a modest drop in value or with a modest increase in value.
There has been increased activity with circulating coins. Another week in a row, IOTA is increasing the number of coins on the market by 0,8% w/w. EOS had an increase of 0,6%, same as Polkadot. The majority of other altcoins had a modest increase of circulating coins of 0,1%, including XRP.
Crypto futures market
This week the crypto futures market reflected perfectly developments on the spot market, with ETH long term futures managed to pass the $4K level.
BTC futures were traded mostly flat compared to the previous week. Futures maturing in December this year closed the week at $120.810, and those maturing in December 2026 were last traded at $127.500. At the same time, ETH futures were traded around 2,5% higher for all maturities. Futures ending in December 2025 reached the last price at $3.779, while those maturing in December 2026 for the first time ended the trading week at $4.058.
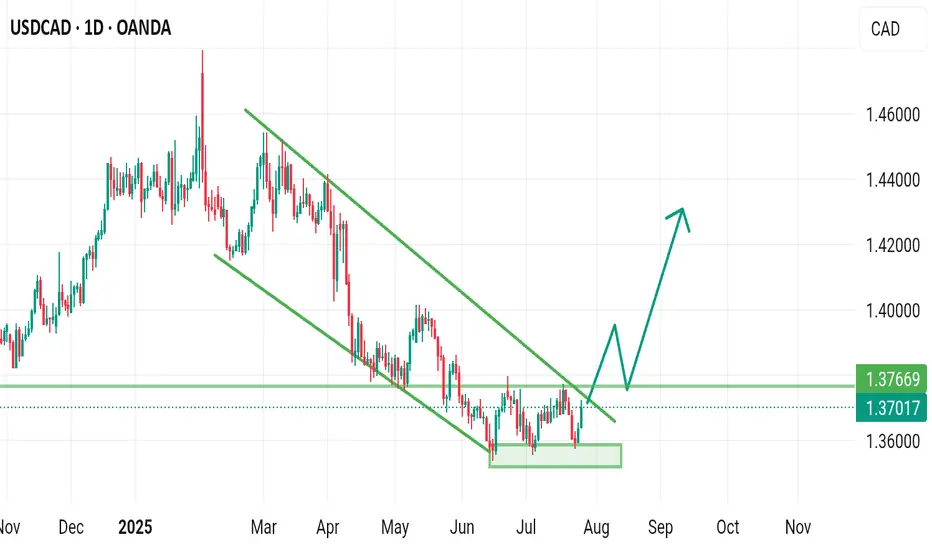
Buy usdcadWe have seen how price create a reversal pattern Wich is triple bottom advisable we are to wait for breaking of the above resistant (and retest) before buying
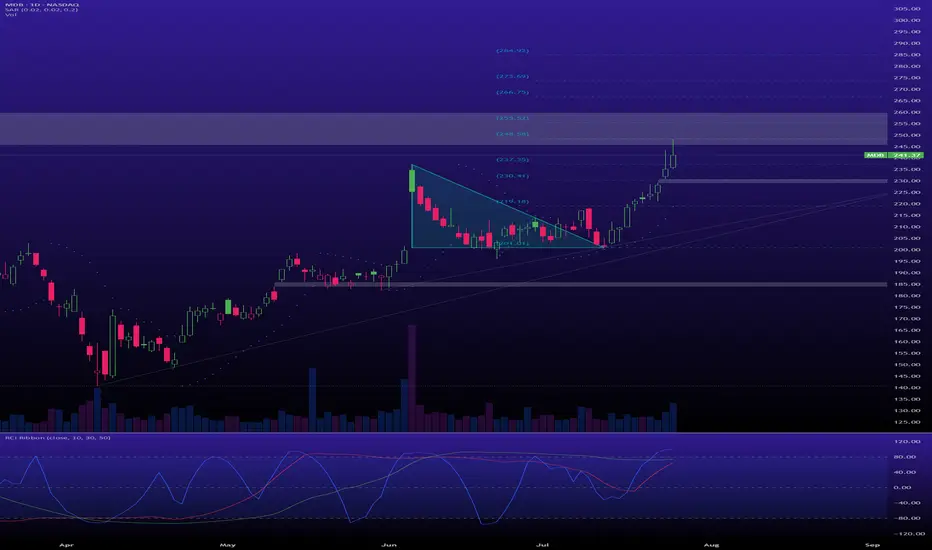
$MDB is currently in a mark-up phaseAfter spending months buying up every share the sellers would give him, the composite man has finally launched the rocket; it would be rude not to hop on for the ride.
Support & Resistance Levels
Next Week (August 4 - August 8, 2025):
Support: A healthy pullback would find support in the $230 - $235 zone. The major support is the breakout area around $215.
Resistance: The immediate resistance is the recent high near $248.
Next Month (to end of August 2025):
Support: The $215 level must hold to validate the new markup phase.
Resistance: The primary target is the next major structural resistance level from the weekly chart, which sits around $280.