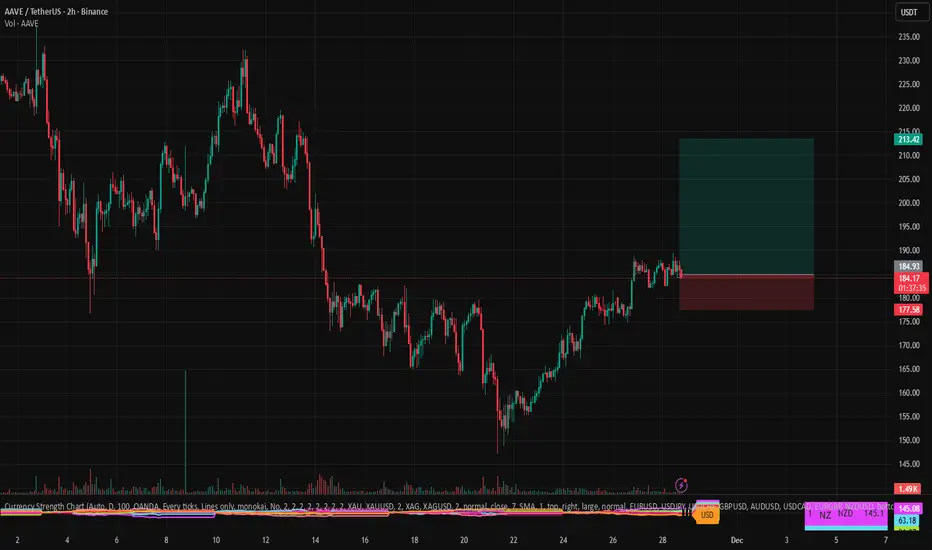
clean higher-low structure after completing a deep corrective waPrice is now consolidating right below a key breakout zone, showing strength with a series of bullish candles and stable volume. If this consolidation holds, a continuation toward the next major resistance becomes highly probable. The stop-loss is placed below the recent demand zone to protect against a failed breakout. The setup targets a trend-extension move aligned with the broader bullish recovery structure.
Community ideas
Katy AI Forecast for HOOD: Minimal Move ExpectedHOOD — QuantSignals Katy 1M Trading Brief (11/28)
🚀 Katy AI Stock Analysis
Symbol Analyzed: HOOD
Current Price: $128.58
📈 Katy Forecast
Final Prediction: $129.19 (+0.47%)
30-Min Target: $128.35 (-0.17%)
Trend: NEUTRAL
Confidence: 40% (Low)
Volatility: 17.2% (Elevated)
⚠️ Trade Signal
No trade generated — move size and confidence below threshold.
📊 Summary
Katy produced 0 actionable signals from 1 analysis.
HOOD remains directionless with low conviction and modest expected movement.

Sell into New YearHi, think there is at first a small rally to 65.2ish for a short. Possibly accompanied by NzdUsd to 56.6, and UsdCad down to 1.406. Then a sustained sell for the Aussie to 62ish into January for a commodity fuelled rally late in first quarter/early second quarter.

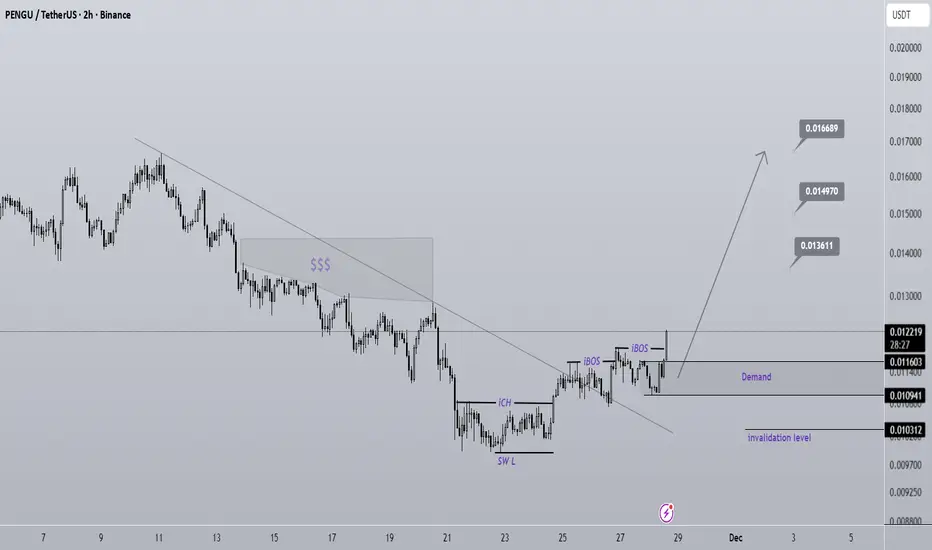
PENGU Looks Bullish (2H)Considering the iCH and the two iBOS, the lower timeframe structure has turned bullish, meaning we can look for buy/long positions within the small-timeframe order blocks.
We also have a liquidity pool on the chart that we expect to be swept soon.
The targets have been marked on the chart.
A 4-hour candle closing below the invalidation level will break this analysis.
Do not enter the position without capital management and stop setting
Comment if you have any questions
thank you
XAUUSD: Imminent reversal, don't miss outThe price of gold continues to rise steadily, driven by strong demand that’s pushing the market higher. However, the price is now facing a significant resistance zone, where sellers have previously intervened with conviction. This zone is critical: if buyers lose momentum here and sellers successfully defend the resistance level, we are likely to see a price decline, triggering a correction.
If this rejection is confirmed, it will be a clear signal that sellers will take control and push prices lower. I expect the price could drop to around 4,130.

Gold uptrend rectangleHello guys, we’re looking at a continuous trend from gold. After that surprising downtrend for just a second (4154) we see a positive bullish. Be careful everyone!

Will Verizon (VZ) Extend Higher After This Bullish Pullback?📊 VZ — Bullish Pullback Playbook | NYSE Swing Strategy 🛡️📈
🧠 Market Thesis
VZ (Verizon Communications Inc.) is showing a clean bullish pullback setup supported by:
✔️ Moving Average Pullback Confirmation
✔️ Re-Accumulation Zone Formation
✔️ Buyers regaining strength and stepping back in with momentum
Price behavior shows buyers dominating key levels, keeping the trend constructive and ready for continuation 📈💪
🎯 Entry Plan
🔓 Entry: Any valid price-level confirmation entry based on your strategy.
(Everyone has their own method — trade what fits your risk profile.)
🛑 Stop Loss
⚠️ Stop-Loss: “Thief SL” @ 39.00
(This is a personal reference point only. Not a recommendation — manage risk your way.)
🎯 Target Zone
🚓 Target: “Police force waiting at the Triangular Moving Average Barricade”
— A zone acting as strong resistance, combined with:
Overbought signals
Possible liquidity trap
Sellers waiting to react
📌 TP Level: 43.00
(Again — personal target. Trade responsibly and exit at your comfort level.)
📝 Notes to All Ladies & Gentlemen (Thief OGs)
I am not recommending you follow my SL or TP.
Your money → your rules → your trade → your responsibility 💼📌
This is a thief-style trading narrative made for fun, not financial advice.
🔎 Correlated Assets / Related Pairs to Watch
Keeping an eye on correlated telecom + defensive sector tickers strengthens conviction:
📡 $T (AT&T)
Moves similarly to VZ due to shared telecom sector flows
Similar defensive-sector inflows during risk-off periods
Can confirm or warn about momentum shifts
📶 NASDAQ:TMUS (T-Mobile)
Sometimes inversely reacts when capital rotates between telecom competitors
Relative strength comparison helps spot leadership shifts
🏦 AMEX:XLC (Communication Services ETF)
Sector ETF that often amplifies or confirms directional bias
Watching ETF flows helps validate whether buyers truly control the space
🧲 Key Correlation Notes:
Telecom sector = slow, steady movers with defensive qualities
When VZ, T, and XLC all align → trend continuation signals strengthen
Divergence between these pairs may warn early about losing momentum
🚀📈 Final Thief-Style Summary
We have a confirmed bullish pullback, re-accumulation strength, and a clear resistance barricade for TP planning.
Trade safely, protect profits, and don’t get caught by the “police” at resistance 🚓😂🔥
✨ “If you find value in my analysis, a 👍 and 🚀 boost is much appreciated — it helps me share more setups with the community!”
⚠️ Disclaimer
This is a thief style trading strategy just for fun.
Not a recommendation, not financial advice — purely educational and entertainment-oriented.
#VZ #Verizon #SwingTradeSetup #BullishPullback #TradingPlaybook #StockAnalysis #NYSE #MarketStructure #Reaccumulation #TelecomStocks #XLC #ATT #TMUS #ThiefStyleTrading #RiskManagement #ChartAnalysis #EditorsPickHunt

Title: FARTCOIN | Breakout Retest and Long-Term Structure PlayAfter a long period of compression, FARTCOIN (FART/USDT) is showing early signs of a potential trend reversal on the 1D chart.
Price has respected a descending resistance line for months while simultaneously forming higher lows on the ascending yellow trendline — signaling that bullish pressure may be building.
Currently, price is testing the intersection point between descending resistance and ascending support, forming what could be a symmetrical triangle breakout setup.
If we can hold above the breakout area and reclaim the mid-structure level (~0.40–0.42), the next technical objectives would be:
TP1: 0.56 – Retest of prior structural resistance
TP2: 0.73 – Measured move from the breakout pattern
TP3: 1.00+ – Potential full cycle expansion target
⚠️ Invalidation:
A daily candle close below 0.30 would suggest a failed breakout and continuation of the prior downtrend.
Educational Breakdown:
This setup is designed to teach how trendline confluence + structural compression can reveal early trend reversal zones.
Notice how the breakout leg aligns with a swing projection pattern, confirming momentum shift probability.
Bias:
Directional Bias: Bullish
Setup Type: Breakout + Retest (Mid-term swing)
Timeframe: 1D

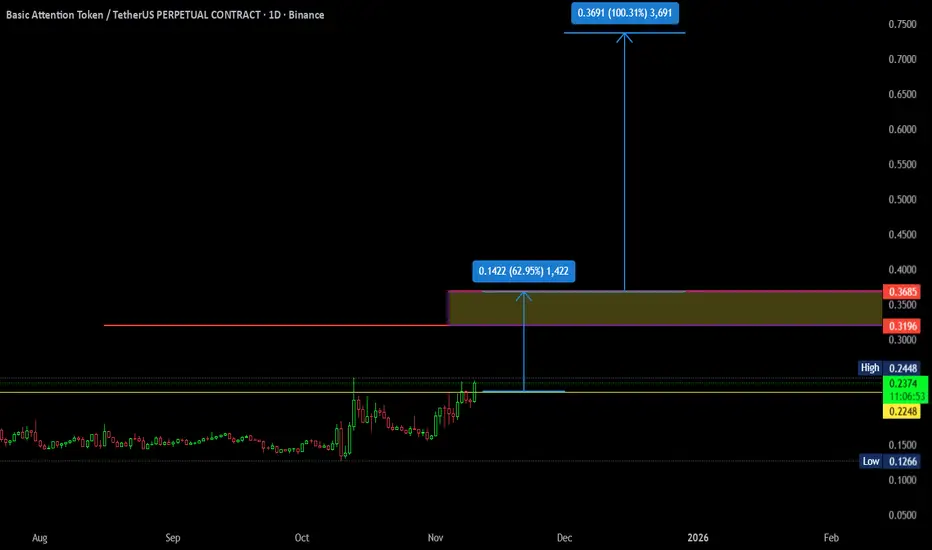
$BAT/USDT Analysis - VWAP-BasedThis analysis is based on VWAP (Volume Weighted Average Price) using monthly and daily charts.
Key Points:
- VWAP levels indicate significant support and resistance zones.
- The highlighted box represents the price expected on November 30 (note: November has 30 days, not 31).
- A daily close above $0.24 could signal a 62–100% potential upside.
Using VWAP across multiple timeframes helps identify both short-term and long-term trends.
💡 My strategy combines VWAP with Z-score deviations to pinpoint high-probability moves, this is what sets my approach apart.
DowJones oversold bounce reaching resistance at 47648Key Support and Resistance Levels
Resistance Level 1: 47648
Resistance Level 2: 47830
Resistance Level 3: 48000
Support Level 1: 47130
Support Level 2: 47000
Support Level 3: 46867
This communication is for informational purposes only and should not be viewed as any form of recommendation as to a particular course of action or as investment advice. It is not intended as an offer or solicitation for the purchase or sale of any financial instrument or as an official confirmation of any transaction. Opinions, estimates and assumptions expressed herein are made as of the date of this communication and are subject to change without notice. This communication has been prepared based upon information, including market prices, data and other information, believed to be reliable; however, Trade Nation does not warrant its completeness or accuracy. All market prices and market data contained in or attached to this communication are indicative and subject to change without notice.

USOIL : Don't be fooledHello friends
Well, you see that we have a descending channel that has hit the ceiling twice and the ceiling three times.
Well, in the third encounter with the bottom or support, you see that the buyers provided good support for the price and pushed it up and broke our medium-term ceiling. Now, if the breakdown is confirmed, the price will go to the ceiling of the channel and from there, a price correction can be expected.
The specified range is very important for a sell trade. Why?
Because there are many orders here, if the price reaches this area, it will inevitably correct. And there is another reason that we have, and the most important reason is that our trend is down and we should not open a trade against the trend.
This analysis is technically reviewed and is not a recommendation to buy or sell.
Avoid emotional behavior and observe capital management.
*Trade safely with us*

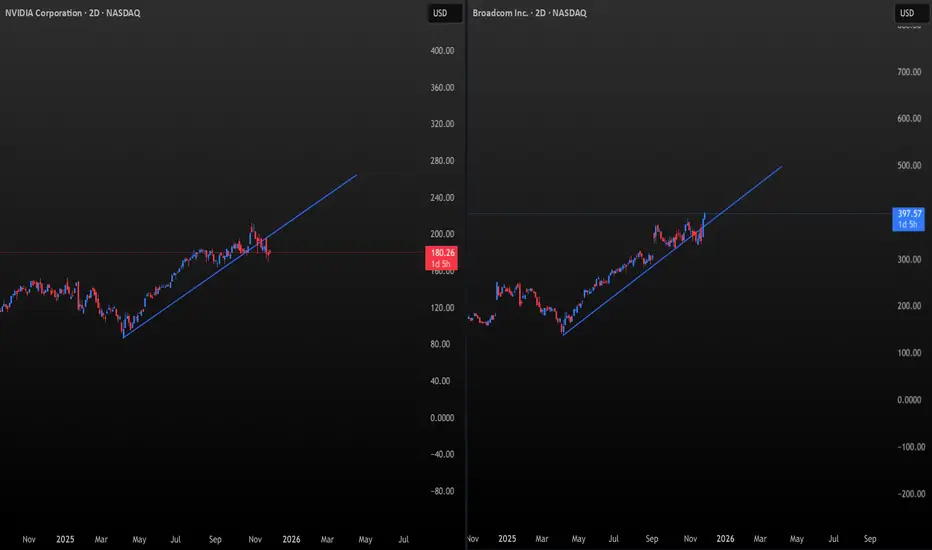
NVDA vs AVGO: The Battle for the AI Throne Has Begun⚡A New Leader Emerges in the Semiconductors
For years, NVDA was the undisputed titan — the gravitational center of the semiconductor universe.
But now, the geometry tells a different story.
THE CHARTS 📐
Both charts use the same natural scaling:
1° of time = $1 of price per unit.
And here’s the critical observation:
NVDA has broken beneath its 1° angle.
AVGO has recaptured and accelerated above its 1° angle.
AVGO has already made new all-time highs.
During a semiconductor correction.
While SMH was down.
While the S&P 500 retraced.
The real question still remains however, are we still in the early innings of the AI Boom?
SMH — The Semiconductor Supercycle Update
The Structure That Defines the AI Era🏛️
The 2023–2027 channel is the master structure for this entire semiconductor cycle.
SMH bounced precisely where the primary and secondary angles intersect.
🚀 Market Knots — Speed & Acceleration Confirm the Turn
Speed found support precisely at the median line around 126 Market Knots — the natural mid-energy band where major long-term advances restart.
Acceleration appears to have:
🔻spiked,
📉bottomed, and
is now curling upward.
Poised to turn positive
The measurements point to a weekly bottom and another wave higher in this semiconductor cycle fueled by AI growth.
The Leadership Rotation🏅 (The Baton Moment)
AVGO is emerging as the structural leader of the AI supercycle.
It has already demonstrated exceptional strength:
holding its 1° angle, breaking into new all-time highs, and accelerating while the rest of the semiconductor sector underperformed.
This behavior is not random.
It reflects Broadcom’s unique position at the infrastructure core of AI — the networking, switching, optical, and custom ASIC layer that becomes the bottleneck after GPUs.
As the semiconductor supercycle builds, AVGO steps forward as the defining leader of the AI boom
BTCUSDT.P - November 28, 2025Bitcoin is in a short‑term uptrend, riding a rising trendline after breaking out from prior consolidation and now pressing into a well‑defined resistance band around 92,100–92,600.
The chart outlines a tactical long setup with support around 90,100–90,200 as the key pivot; holding above this zone favors continuation toward the higher resistance/target region near 94,500–95,000, while a clean break back below the trendline would invalidate the bullish structure and open room for a deeper pullback.


Long trade Wed 26th Nov 25 — 3:25 PM
NY Session PM
Entry TF: 5-Min
🟩 1. Trade Parameters
Pair: AVAXUSDT
Direction: Buy-Side
Entry: 14.557
Stop Loss: 14.400
Take Profit: 15.577
Risk–Reward: 8.43R
🟨 2. Higher-Timeframe Context
HTF (1H / 4H) market structure:
Market has been in a multi-day downtrend, forming successive lower-lows and lower-highs.
A major demand zone between 13.12 – 13.30 was reclaimed on 23rd Nov.
Strong NY expansion candle broke above compression on 25th Nov, signalling a likely HTF shift.
Price pulled back into discount, forming a textbook re-accumulation structure.
30min TF overview
🟧 3. Liquidity
Liquidity Taken (Before Entry)
Sweep of Sunday–Monday lows around 13.12.
Deep purge into demand zone engineered equal-lows → liquidity grab.
Market created inducement wicks at 14.12, which were later swept.
Liquidity Above (Targets)
Buy-side liquidity pool at 15.57 (clear cluster of prior highs).
Multiple FVGs above price requiring rebalancing.
Void left from the sharp selloff on Nov 18th → price required re-pricing into inefficiency.
Liquidity narrative:
Sweep → Accumulation → Reclaim → Displacement to inefficiency.
5min Chart
🟥 4. SMC / ICT Technical Model Breakdown
✔ Model Type: BOS + FVG + Re-Accumulation Breakout
BOS at ~14.25 confirms shift back to bullish orderflow.
Clean FVG (14.22–14.28) formed after displacement.
Price returned to the FVG → mitigated OB → tapped equilibrium.
Strong continuation displacement candle printed → ideal entry timing.
Key Confluences:
Demand zone → BOS → FVG → OB alignment
EMA/WMA bullish crossover
Tight SL under engineered liquidity
🟦 5. Entry Logic
The entry at 14.557 acted as the:
Re-accumulation breakout confirmation
Retest of micro FVG
Retest of prior resistance turned support
SL placement below 14.400 protected under:
✓ Equal lows
✓ OB mitigation
✓ Structural swing low
🟫 7. Trade Outcome
Status: In session

Gold SELL SetupGold has tapped a major supply zone while forming a rising wedge, showing clear bullish exhaustion. Rejection from this zone signals a potential reversal. If price fails to break above the resistance, a sharp downside move is expected once the wedge breaks.
selling at 4205 level with reversal confirmation
TVC:GOLD

USD/CAD - Why the Canadian Dolor struglles in front of USD?As a fundamental point of view, the Canadian Dolor is still under the pressure of it's older brother, USD. With all the geopolitical tensions between this 2 neighbour countries, i am seeing again the USD gaining in front of the CAD.
As a tehnical point of view, on the HTF chart (daily) we can see a really nice chain of demands respected, price everytime reacted inside the demand after taking liquidity. It is the same case right now, as we see price retracing back to a demand zone (4h chart), taking the liquidity resting above it and right now we need to see the bulls entering this market to protect their gains.
The LTF is squizing the price, after the drop from the LH formed that failed to break the old structure. From my point of view, this is a good oportunity to enter buys also because of the fact that our HL is protected. If this zone is invalidated, my whole ideea will not stand anymore.
There is no clear bearish orderflow even in lower timeframes, just a drop in price, and a beggining of a consolidation market. Once the fractal structure changes bullish on the 4h chart, i will be even more confident to extend my risk and add more to the trade.
Also, fundamentally speaking, we all know about the rate cuts that will happen in December, there will be no surprise if FED will cut the rates with 0.25%. It will be a surprise if they don't and what are going to do after in the future. So right now, in my opinion, the decision is already pricing in.
Make sure to follow for more analyse in the future.

WTI🌎 Major investment banks forecast two stages for oil: a decline due to oversupply, followed by growth from 2027 due to a lack of investment.
After 2027: A prolonged growth period will begin due to a shortage of raw materials.
A gradual, slow decline in oil prices is observed.
We are near a support level, a break of which could accelerate the decline in prices.

It's a time for RKLB - 45% potential profit - 62 USDThe chart shows Rocket Lab Corporation on the daily timeframe. After a strong bullish trend, the price entered a deep correction phase, dropping into the 41–42 USD area. Currently, the decline appears to be losing momentum, and price action shows signs of stabilizing around a key support zone. This area has previously acted as a demand zone, which increases the likelihood of a short-term bounce.
The price is currently positioned below two moving averages, but it has started to approach them from underneath. This may indicate a potential short-term trend reversal if the price breaks above the first moving average and holds above it. Such behavior often signals the beginning of a corrective or reversal move to the upside.
The RSI indicator is in low territory, suggesting that the stock is near oversold conditions. Historically, this often results in a technical rebound as selling pressure weakens and buyers re-enter at discounted levels. Moreover, recent candlestick structure indicates decreasing selling pressure and early signs of demand returning to the market.
The highlighted price projection toward the 62 USD level reflects a potential corrective move back into a previous resistance zone, which also aligns with a psychological price level. From a technical perspective, this area represents a logical first upside target following such a strong downward move. If buying momentum continues and price breaks through local resistance levels, a move toward the 60–62 USD region in the near term is a realistic scenario.
Overall, the technical picture suggests that the stock may be entering an early recovery phase after a strong decline, with growing probability of a short-term upward movement. The coming sessions will be critical — a breakout accompanied by increased volume would strengthen the case for a move toward the 62 USD level.
Potential TP: 62 $
⚠️ Disclaimer
This analysis is for educational and informational purposes only and does not constitute financial or investment advice. The financial markets involve risk, and past performance is not indicative of future results. Always conduct your own research or consult with a licensed financial advisor before making any investment decisions.

Gold Is Loading Pressure — The Next Breakout Will Be Violent1. Market Structure Overview
Price is currently respecting a rising channel, showing a consistent sequence of higher highs – higher lows, but with gradually compressed momentum near the upper boundary and the resistance zone.
Key observations:
- Price is hovering near the upper trendline of the ascending channel.
- The resistance zone is directly above current price, causing hesitation and wicks.
- The chart shows a potential indecision → correction → continuation pattern forming.
This reflects a market preparing for a bullish continuation, but only after a controlled pullback.
2. Expected Scenarios for Today
✓ Primary Scenario – Bullish Retest Before Breakout (High Probability)
Price is likely to:
- Pull back toward the midline/lower edge of the ascending channel (yellow zone).
- Form a higher low within structure.
- Execute a clean retest of the ENTRY ZONE highlighted on your chart.
- Break above the Resistance Zone → Continue toward higher targets.
This matches your projected structure perfectly.
Entry Logic:
- Wait for price to retest the rising trendline and show bullish confirmation.
- The ENTRY ZONE is valid and aligns with trend continuation.
Upside Targets:
- TP1: 4,215–4,225
- TP2: 4,250+
- TP3 (extended): 4,280+ if the breakout is impulsive.
✓ Secondary Scenario – Compression Before Break
If price stays inside the channel and moves sideways:
- Market remains bullish but indecisive.
- This builds liquidity for a stronger breakout later.
- No selling is recommended unless structure breaks.
This scenario still favors bulls—just slower.
3. Trend Bias (Intraday)
The dominant trend is:
➡️ BULLISH – Buy the dip, do NOT chase breakouts
Signs confirming bullish bias:
- Higher lows remain intact.
- Structure respects the ascending channel perfectly.
- Resistance is tested multiple times → weakening.
- Volume spikes on bullish waves, fades on corrections.
4. Professional Conclusion
Gold remains in a strong bullish continuation structure inside the rising channel.
Your ENTRY ZONE is positioned perfectly for a high-quality retest trade.
Plan of Action:
- Wait for the pullback to the trendline.
- Confirm bullish rejection.
- Enter long within the zone.
- Target the liquidity sweep above resistance.
Smart, calculated, high-probability setup. 🔥

correction It is expected that the correction process within the current support area will end and we will witness the beginning of the upward trend. Otherwise, the continuation of the downward trend is likely.

check the trend The price is expected to consolidate above the support area and then the start of an uptrend is likely.
If the price breaks through the support area, a continuation of the correction is likely.

XAUUSD Outlook🟦 Market Structure (H4 & D1)
Price continues to respect the ascending structure after a clean CHoCH → BoS → Breakout Retest on H4, indicating that bullish momentum remains intact.
On D1, the market appears to be completing an ABC corrective formation, with wave (3) established and wave (5) potentially extending towards 4,320 – 4,380.
🟦 Liquidity & Key Zones
H4 is approaching a liquidity pocket at 4,155–4,165, which is likely to trigger a short-term pullback before any continuation higher.
On D1, price is moving into a mild imbalance / residual supply region, yet there is no firm rejection so far – suggesting that the broader bullish trend remains favoured.
🟦 Expected Scenario
The higher-probability scenario: a brief retracement into the liquidity zone, followed by absorption and the formation of a higher low → continuation towards 4,245, and potentially 4,380 as wave (5) develops.
Only a decisive break beneath 4,110 would weaken the current bullish structure and invalidate this outlook.
