Relief Rally or Further Drop? Key Levels to Watch on ARBUSDTARBUSDT continues its descent after invalidating the macro rising wedge, with price action firmly suppressed below key supply zones. Current wave structure hints at a potential relief rally toward 0.3886 before resuming the broader bearish trajectory toward the projected drop target at 0.1718. Until the macro descending trendline at 0.6259 is decisively broken, bearish sentiment remains dominant.
Community ideas

BTC 4H Ascending Support Retest, Will Supply Zone Reject Again?BTC has been respecting this ascending trendline since late June, with buyers stepping in each time price approached support. Now, price is hovering just above the trendline while the upper supply zone remains a strong ceiling. A clean bounce here could push us back toward 120K resistance, but a breakdown would likely open the door to a deeper pullback toward the June demand zone. Bulls need to defend this level decisively to avoid losing the uptrend momentum.

EURUSD My Opinion! SELL!
My dear subscribers,
My technical analysis for EURUSD is below:
The price is coiling around a solid key level - 1.1668
Bias - Bearish
Technical Indicators: Pivot Points Low anticipates a potential price reversal.
Super trend shows a clear sell, giving a perfect indicators' convergence.
Goal - 1.1588
About Used Indicators:
By the very nature of the supertrend indicator, it offers firm support and resistance levels for traders to enter and exit trades. Additionally, it also provides signals for setting stop losses
Disclosure: I am part of Trade Nation's Influencer program and receive a monthly fee for using their TradingView charts in my analysis.
———————————
WISH YOU ALL LUCK

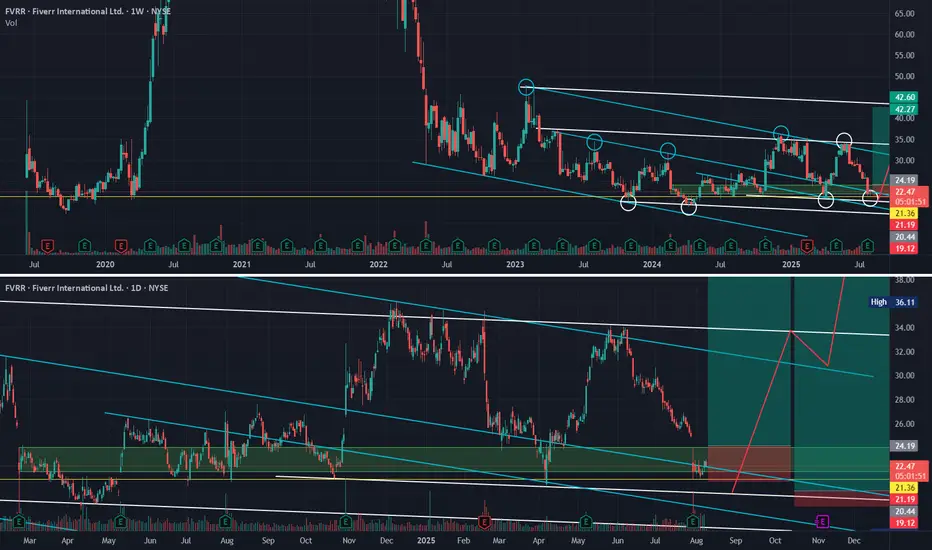
The stock that keeps on disappointing - Where & why I'm bullishFVRR. We all know the company. Many of us have probably waited patiently for a covid-like resemblance of the stock price. And yet here we are, sitting at $22, wondering if we'll ever reach $40 again.
I'm here to tell you, aside from the company being fundamentally strong and proving that with earnings and revenue growth YOY, the algorithms have got your back technically as well!
The overall reason I am technically bullish on this company and have been since April 2024 is the white algorithm as outlined by the white circles in the weekly chart above. Notice any time we are selling down and respecting teal/blue on the buy-side (blue circles), we hold and respect white taper (white circles) on the sell-side and allow for price to make it's way up back toward teal.
Once we prove the white algorithm on the buy-side as well, we will break out of this LTF consolidation and head toward HTF algorithms.
I want to prime you for three possible scenarios:
#1.
We are holding a very strong multi-year demand zone (green box). If we continue to hold this and close back above, as with every other time, it is a strong buy signal.
#2.
We are holding above a multi-year support zone at $21.70 (yellow line). This has held us (save for one or two liquidity grabs) since the company's IPO. Another attempt at this level will be a no-brainer scoop-up as far as R:R is concerned.
#3.
My prediction (and hope) is that we are trying, once again, to prove this white tapered algorithm on the sell-side. If we do that, we give price the ability/permission to break out of teal once and for all and head toward the fair-value pricing of this company (according to all the analysts - not me) in the $40+ range.
This is another one that may require a bit of patience to get the best case scenario - allowing for a push lower toward our HTF white algorithm.
In any case, I am still bullish on this chart - even with all the selling pressure and sideways movement.
Happy Trading :)
bearable bear bull waiting for monthly candle retracementhi guys if this gold daily candle will close like a huge red volume candle it is possible that this the first line of this poly line will play, although i am looking for retracement in this coming months i have small short position limit order at 3451 with very close maybe it is like stop hunt entry

Silver Bulls Unstoppable – Price Discovery Next?Silver has been on a strong uptrend, consistently making higher lows (HL) and higher highs (HH) over the past few years.
The long-term trendline, which acted as strong support for multiple retests, was finally broken to the upside. The old resistance zone has now turned into a solid support area, showing clear bullish strength.
Currently, price is hovering just below its all-time high (ATH) around $39.59. If bulls manage to break and sustain above this level, we could see fresh highs and a strong continuation of the upward momentum.
DYOR, NFA

ALKYL AMINES CHEM. LTD S/R Support and Resistance Levels:
Support Levels: These are price points (green line/shade) where a downward trend may be halted due to a concentration of buying interest. Imagine them as a safety net where buyers step in, preventing further decline.
Resistance Levels: Conversely, resistance levels (red line/shade) are where upward trends might stall due to increased selling interest. They act like a ceiling where sellers come in to push prices down.
Breakouts:
Bullish Breakout: When the price moves above resistance, it often indicates strong buying interest and the potential for a continued uptrend. Traders may view this as a signal to buy or hold.
Bearish Breakout: When the price falls below support, it can signal strong selling interest and the potential for a continued downtrend. Traders might see this as a cue to sell or avoid buying.
MA Ribbon (EMA 20, EMA 50, EMA 100, EMA 200) :
Above EMA: If the stock price is above the EMA, it suggests a potential uptrend or bullish momentum.
Below EMA: If the stock price is below the EMA, it indicates a potential downtrend or bearish momentum.
Trendline: A trendline is a straight line drawn on a chart to represent the general direction of a data point set.
Uptrend Line: Drawn by connecting the lows in an upward trend. Indicates that the price is moving higher over time. Acts as a support level, where prices tend to bounce upward.
Downtrend Line: Drawn by connecting the highs in a downward trend. Indicates that the price is moving lower over time. It acts as a resistance level, where prices tend to drop.
Disclaimer:
I am not SEBI registered. The information provided here is for learning purposes only and should not be interpreted as financial advice. Consider the broader market context and consult with a qualified financial advisor before making investment decisions.

GBPUSD- 4/8/25 - Bearish There was a clear BoS on the HTF with ended with near equal low liquidity as marked below.
Looking for a slightly higher risk bearish trade, i identified the zone that broke structure and placed a sell limit at this zone.
My TP is the equal low liquidity - but i may hold it a little longer but keep trailing my SL.
+ve:
1. HTF BoS to bearish
2. Zone that broke structure clearly identified
3. Equal low liquidity that will draw price back to it soon
-ve:
1. Imbalance above zone that broke structure
2. Large bullish candle formed during last friday that indicates big momentum towards bullish movement for awhile

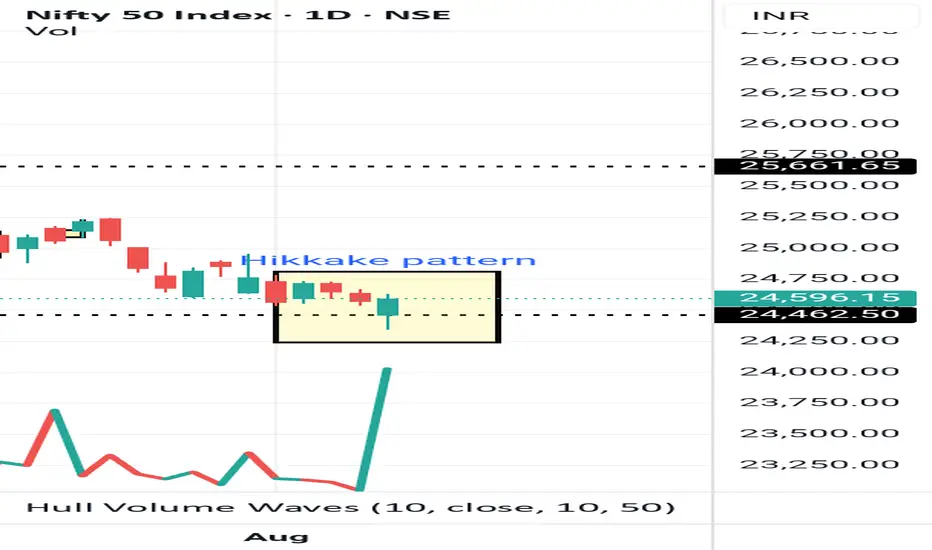
Nifty hikkake pattern.Nifty 24596 has given an excellent example for hikkake pattern to trap call writers.
Lingrid | BNBUSDT Potential Bullish ContinuationThe price perfectly fulfilled my previous idea . BINANCE:BNBUSDT is rebounding from a higher low along the upward trendline, maintaining its position within the broader bullish channel. After the recent retracement from the peak at resistance, price has stabilized above 750, suggesting accumulation before a potential push higher. As long as it holds the trendline and the key 735–750 support zone, bulls are likely to target the 820 level next. This bullish continuation is fueled by a strong structure of higher lows and a healthy trend.
📉 Key Levels
Buy trigger: Close above 780
Buy zone: 735–750
Target: 820
Invalidation: Break below 730
💡 Risks
Failure to hold 735 support may trigger deeper pullback toward 700
Rejection at 780 could result in extended range-bound movement
Resistance near 820 may cap gains without strong momentum
If this idea resonates with you or you have your own opinion, traders, hit the comments. I’m excited to read your thoughts!

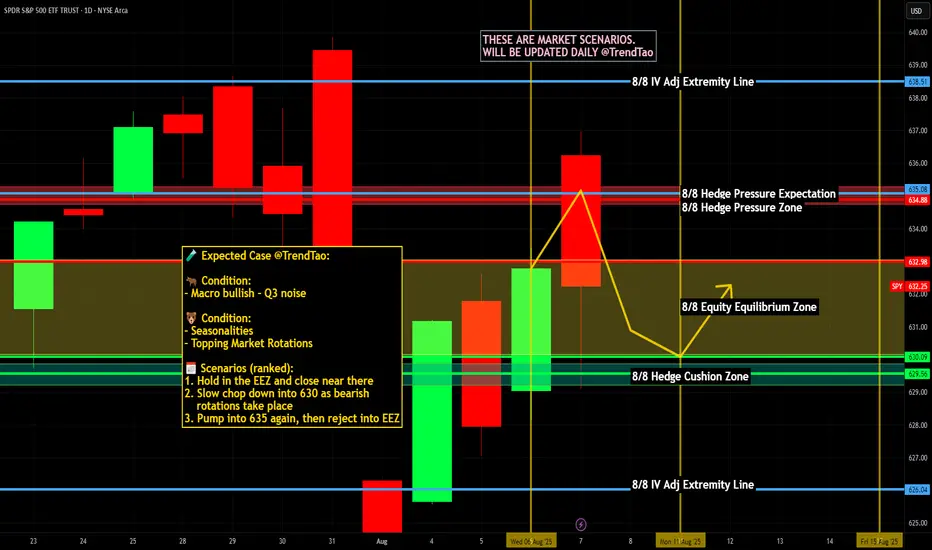
Nightly $SPY / $SPX Scenarios for August 8, 2025🔮 Nightly AMEX:SPY / SP:SPX Scenarios for August 8, 2025 🔮
🌍 Market-Moving News 🌍
🧾 Tariff Shock → Day 2 Positioning
Markets are still digesting the new tariff regime (10%–41% on broad imports) and the proposed 100% levy on imported semiconductors with carve-outs for firms investing in U.S. production. Expect continued dispersion: U.S.-capex-heavy names bid; globally exposed hardware, autos, and consumer electronics face margin risk until rules are clarified.
💬 Policy Signaling Risk
Fed speakers are leaning cautious on growth and inflation pass-through from tariffs; Bostic flagged skepticism that tariff-driven price effects fade quickly. Translation: don’t count on a rapid dovish pivot because of tariffs alone.
⛽ Energy & Positioning Into the Weekend
Oil beta in focus: Baker Hughes U.S. rig count (1:00 pm ET) and CFTC COT (3:30 pm ET) hit this afternoon—both can nudge energy, USD, and risk appetite into the close.
📊 Key Data Releases & Events 📊
📅 Friday, August 8, 2025
10:20 AM ET – St. Louis Fed President Alberto Musalem (remarks)
Market angle: watch for any tariff-inflation commentary and guidance on the path/timing of cuts.
1:00 PM ET – Baker Hughes U.S. Rig Count
Reads on drilling activity; oil services beta and crude sentiment.
3:30 PM ET – CFTC Commitments of Traders (weekly)
Positioning update across futures/FX; risk heading into next week.
(No major Tier-1 U.S. macro prints scheduled today; next CPI is Tuesday, Aug 12.)
Bureau of Labor Statistics
⚠️ Disclaimer:
Educational info only, not financial advice. Do your own research.
📌 #trading #stockmarket #economy #Fed #tariffs #chips #energy #rigcount #COT
Bullish on THEUSDTTHE is a hidden gem. It has retraced 95% from ATH and did a nice first pump in July. Volume is coming in and we can expect a further growth as soon as we break out this triangle - above EMAs and a high volume node as a backup. This is your chance for a 5x Spot trade in next weeks / months.
For more trade ideas check and insights check our profile.
Disclamer: only entertaining purpose, no financial advice - trading is risky.

ADA Ready for PUMP or what ?ADA has successfully broken out of the falling wedge pattern and retested the breakout zone,the price is holding firmly above previous resistance, which now acts as strong support.
Continued strength could lead to upward movement toward targets at $0.87 , $0.93 and $1.20...
Stay Awesome , CobraVanguard

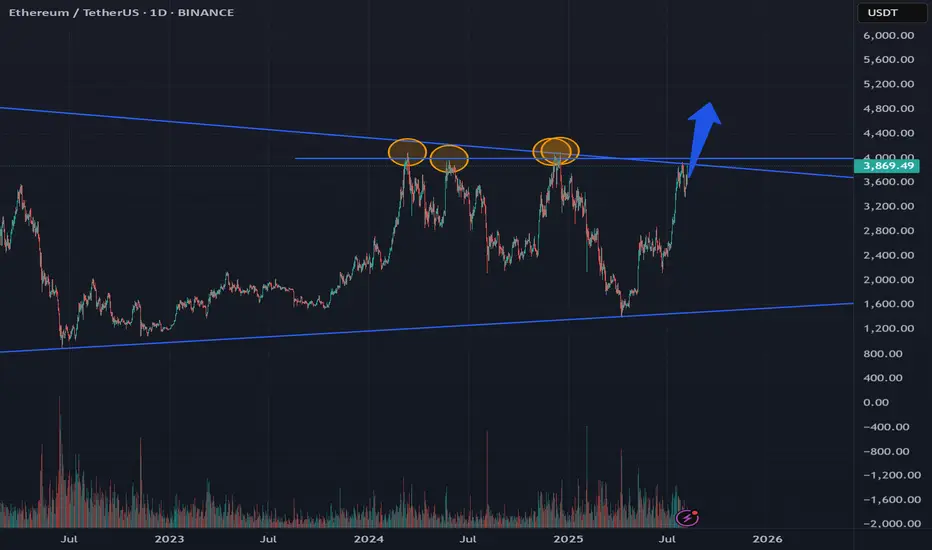
Ethereum Forms Symmetrical Triangle and Bullish PennantETH is currently consolidating in a symmetrical triangle - a narrowing range created by alternating lower highs and higher lows. This pattern is considered neutral, but when broken through it usually gives a strong impulse to movement, you also need to take into account the information from the previous analysis of ETH
A pennant is also being formed - after a strong impulse, the price contracts, creating a small narrow channel (pennant), which often continues to move in the same direction after the breakout
Current price: $3.684
Probable price of the upper breakout from $4100 to $4800, then most likely there will be a small price drop
The probability that we will go down is extremely small now, but the price may fall to the level of $3400 or $3300
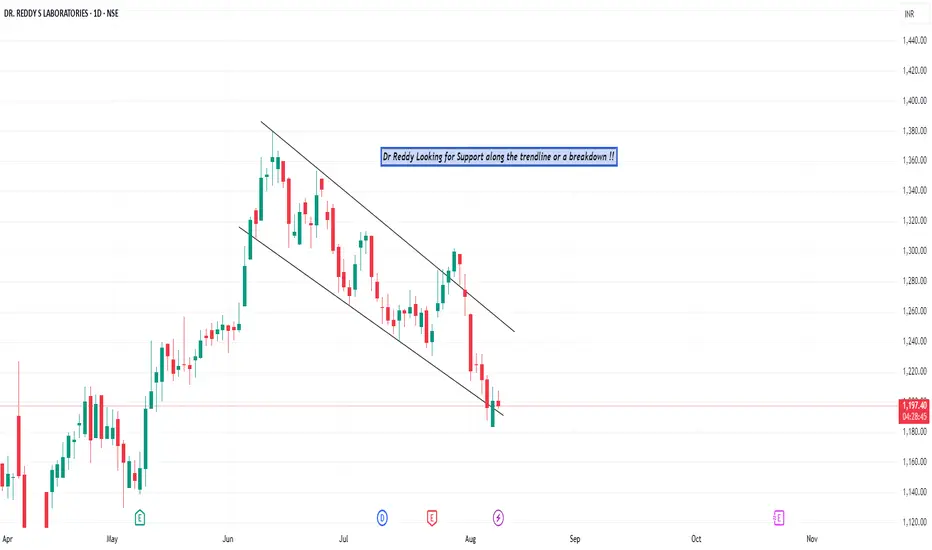
Dr Reddy at trend reversal ?Dr. Reddy’s – At a Make-or-Break Point on the Trendline
Dr. Reddy’s is pressing right against the lower boundary of its falling channel — a trendline that has acted as support multiple times in the recent downtrend.
Right now, the stock is hovering near ₹1,199, trying to find its footing. This level is critical:
If the trendline holds → We could see a technical bounce back toward the mid-channel zone, potentially testing ₹1,240–₹1,260 in the short term.
If it breaks down → A clean close below this trendline, especially with volume, could accelerate the downside, opening the way toward ₹1,170–₹1,150.
Given the sharp selling momentum in the last few sessions, traders should watch closely for either a rejection candle with buying pressure or a break and retest of the channel base for confirmation.
Thus saith the Crypto-Profit Prophet BTCThus saith the Crypto-Profit Prophet:
Mount Sinai Pivot Points
– As Moses beheld the tablets, so do we mark Bitcoin’s sacred highs. At 117,315, the seventh commandment of resistance is engraved—our signal to unsheathe the short sword.
Oracle of On-Chain Sentiment
– From the urn of wallet flows and the scrolls of Twitter prophets, we divine that greed waxes fat. When murmurings declare “the Promised 100K,” we take heed and prepare to descend.
Genesis Candle Filter
– On the third day Bitcoin created the candles, and only those closing on the weekly Sabbath (Friday close) bear true witness. Any mid-week heresy is swept away like chaff in the wind.
Noah’s Flood Volume Veil
– When trading volume swells beyond 20,000 “ark-ounces”, the floodgates open. Such deluges portend the great deluge of price—and baptize our position in profits.
Parting of the Red Sea Trend Confirmation
– We draw trendlines as Moses drew the sea: from the High of Deliverance to the High of Exile to the High of Redemption. Once that “Red Sea Downtrend” parts before us, we march forth into the bearish wilderness.
Divine Execution Plan:
Enter Sell BTC/USD: 117,315
Heavenly Stop: 120,000 (beyond the Mount Hermon Summit)
Promised-Land Target: 102,414
Go forth and multiply thy gains—lest the locusts of leverage lay waste!

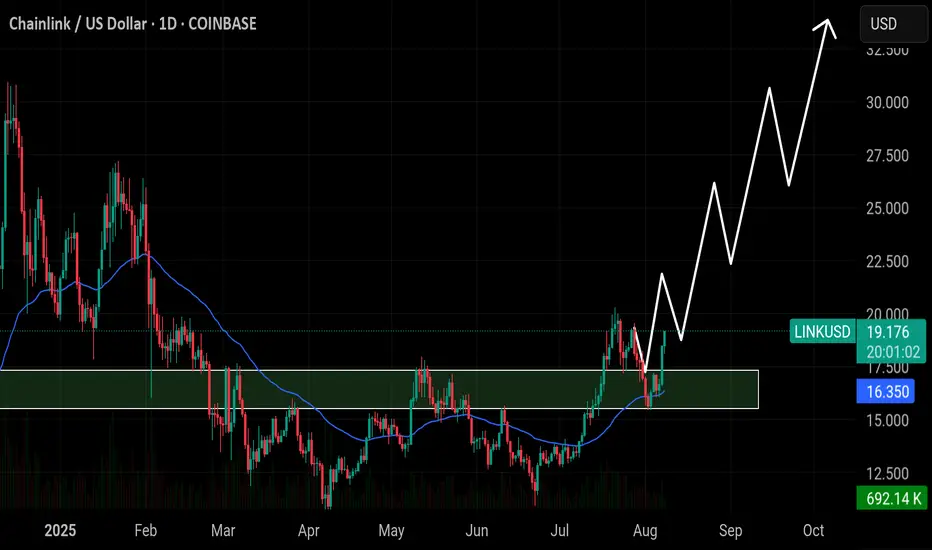
$LINK has retested the $15.80 breakout zone and bounced stronglyBIST:LINK has retested the $15.80 breakout zone and bounced strongly. Price is now gaining momentum and holding above the 50EMA. As long as this zone holds, LINK is likely to push toward $24, $28, and $32 in the coming weeks. A break below $15.0 would invalidate this bullish setup.

Tesla - The all time high breakout!🚗Tesla ( NASDAQ:TSLA ) will break out soon:
🔎Analysis summary:
For the past five years Tesla has overall been consolidating between support and resistance. But following the recent bullish break and retest, bulls are slowly taking over control. It is actually quite likely that Tesla will soon break above the previous all time highs.
📝Levels to watch:
$400
🙏🏻#LONGTERMVISION
SwingTraderPhil

SOL 1H – Trendline Break Holds, But Can Bulls Clear 178?olana has finally broken its multi-week descending trendline, with price reclaiming the 50/100 EMA cluster and showing strong momentum. The breakout point aligns with a potential change in market structure, but confirmation will depend on whether buyers defend the retest zone near 168–170.
If the breakout sustains, the next key hurdle sits in the 176–178 zone. Stoch RSI is currently in overbought territory, suggesting a possible cooldown before the next push.
Key watchpoints:
– Retest of breakout level for confirmation
– Holding above EMAs to maintain bullish bias
– Clearing 178 resistance to open room for continuation toward 185+

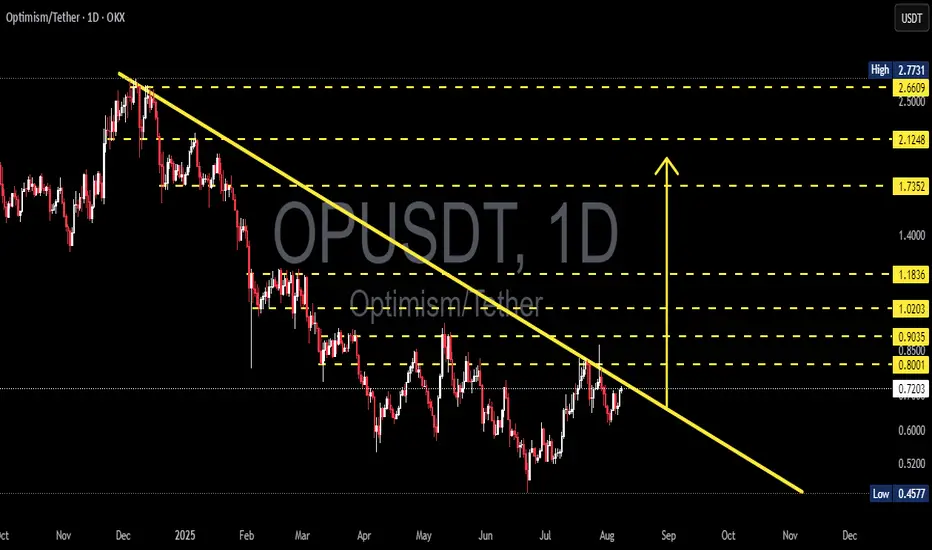
OP/USDT Technical Analysis – Approaching a Major Breakout Zone!Chart Overview: The OP/USDT pair on the 1D (Daily) timeframe is currently moving within a long-term descending trendline, forming a descending triangle or falling resistance channel since November 2024. The price is now approaching a critical point near the long-term resistance trendline (yellow line), which has been tested multiple times.
---
🟢 Bullish Scenario: Breakout Potential
If the price manages to break and close above the descending trendline resistance (currently near the $0.80–$0.85 zone), it would signal a strong bullish breakout. The next key resistance levels to watch (based on yellow dotted horizontal lines) are:
1. $0.9035 – minor resistance
2. $1.0203 – psychological level
3. $1.1836 – mid-term strong resistance
4. $1.7352 and $2.1248 – extended bullish targets
A confirmed breakout would ideally be supported by increasing volume and RSI momentum above 50.
---
🔴 Bearish Scenario: Rejection at Resistance
If the price fails to break the trendline and gets rejected, a downside move is likely to follow. Key support levels to watch are:
1. $0.7200 – current support
2. $0.6000 – minor support
3. $0.4577 – strong historical support (lowest level)
This would suggest continued bearish control and could extend the downtrend that has lasted over 8 months.
---
📊 Pattern Breakdown: Descending Trendline
Consistent lower highs since the peak near $2.77
The descending trendline is the main battle zone between bulls and bears
This pattern often leads to a breakout if buyers gain momentum
---
🎯 Conclusion & Strategy:
This is a critical zone for OP/USDT.
Traders should wait for breakout confirmation before entering long positions.
For breakout traders: consider a buy-the-breakout strategy with stop-loss below the trendline.
For short sellers: look for a rejection at resistance with targets at the nearest support levels.
#OPUSDT #CryptoAnalysis #Altcoins #TechnicalAnalysis #BreakoutTrade #Optimism #CryptoSetup #BullishScenario #BearishScenario #ChartPatterns
Solana - The bullish background remains strongCurrent Technical Signals
SOL is trading around $180-$181, holding above the key 20-day EMA, which is around $178.25. A break below this level could open the way to support around $171.78, while holding above this level creates potential for a rise towards $186.40-$190.47.
A golden cross is forming between the 100- and 200-day EMAs on the daily chart - a classic bullish signal, strengthening the chances of a rise to $200.
Your network volume and balances on exchanges are showing a decline, which indicates a decrease in supply - easing pressure on the price and supporting bullish sentiment.
Support and Resistance
Support:
$178.25 (20‑EMA)
$171.78 — lower limit in weak market
The Currency analytics
Resistance:
$180–$190 zone — critical for further gains
Upper resistance at ~$200 — critical for rally continuation
Structural and Valuation Signals
A test of the daily bullish divergence on SOL indicates potential for further gains after correction.
SOL recently broke out of its ascending channel, indicating a possible reversal and the beginning of a new move higher.
Finance Feeds

Tia pump to $1.824Just recently opened a long position on Tia.
Aiming for 1.824 target today. scaling out
Sl: 1.706 todays, daily wick low
Tps on chart
Might correct a bit for better entry if just seeing this
