BTC 4H Analysis - Key Triggers Ahead | Day 38😃 Hey , how's it going ? Come over here — Satoshi got something for you!
⏰ We’re analyzing BTC on the 1-Hour timeframe.
👀 On the 4-hour timeframe of Bitcoin we can see that Bitcoin was under a descending trendline, and each time it touched this trendline it faced selling pressure. Bitcoin broke this trendline at the end of August, and since the beginning of September until now it has been ranging below the $113,000 resistance, where it has touched this level 3 times and then got rejected downward. Usually, these kinds of zones don’t break easily, and if they do, it is together with major global economic news.
⚙️ The key RSI zone of Bitcoin in the 4-hour timeframe is at 65. A swing scenario is considered for Bitcoin after the news, and if this news comes in favor of the risky market (crypto), it can move above the 65 range and even enter overbought territory.
🕯 The size, volume, and number of green candles have almost increased, while red candles are still accompanied by selling pressure. There is a taker-seller zone above, at the $113,000 resistance, that has kept the price down. With the release of news, a good wave of capital can enter or exit the market.
📊 On the 4-hour timeframe of USDT.D we can see that Tether dominance is in a very important support zone, and losing this support can bring good volume into the market. I think this support break can also happen with today’s PPI news. Tether dominance, like Bitcoin, was above a continuation ascending trendline, but now it has broken the trendline and is ranging below it. This shows us the importance of the news!
📊 On the 4-hour timeframe of BTC.D we can see that Bitcoin dominance is in a support zone, and with a 4-hour candle that looks like multiple profit-taking it got supported and moved upward. Although the move is small, we should pay attention. The resistance zone of Bitcoin dominance is at 58.36%, and the support zone is at 58.06%. Losing these zones can give altcoins very strong moves.
🔔 Bitcoin is now under an important resistance at $113,000. If this zone is broken, it can move upward again. A very strong support zone is also built by maker buyers at $107,627, which is quite far from the current price. For a long position, wait until the taker-seller zone is taken out with a whale candle and then enter on the pullback. Also pay attention that altcoins can give us the most profit during this period when both Bitcoin dominance and Tether dominance are dropping.
❤️ Disclaimer : This analysis is purely based on my personal opinion and I only trade if the stated triggers are activated .
Community ideas

Excellent Profits of current Bull runAs discussed throughout my yesterday's session commentary: My position: I am constantly using my dip Buying strategy and will continue Buying Gold from my key entry points (excellent Profits by now) Buying Gold from #3,630.80 many times throughout yesterday's session. #3,645.80 is keeping Gold away from touching #3,652.80 benchmark.
I have firstly waited for #3,645.80 and Bought Gold aggressively (#7 orders with #50 Volume) closed all on #3,651.80 and waited for second chance to re-Buy Gold on #3,627.80 reversal which delivered excellent Profits.
My position: As advised many times, do not Sell Gold at all costs as wherever you Buy Gold on this market, you won't be wrong. I have Bought Gold on #3,652.80 and #3,654.80 minutes ago and closed all on #3,657.80 extension. Keep Buying Gold on each dip is my practical suggestion.

SOL Parabolic Run Despite the recent chop, when you zoom out to the 1D timeframe there is a clear pattern being followed since the April crash.
From the sub $100 low Solana has posted progressively higher lows in a parabolic fashion. The highs on the other hand are in more of a linear fashion as shown by the diagonal S/R level, at first it provided support and now since March it has been resistance.
So for me there are two possible actionable trades:
- Continuation of the parabolic move, this would include flipping the Diagonal S/R level, currently at time of writing this resistance level is being tested, a close above gives a better possibility of the rally continuing.
- The rally becomes exhausted and fails to flip the Diagonal S/R and loses the parabolic support level. Should this support break $185 is the first target (light green zone), $160 as the second target (dark green zone).
Important to remember we have CPI & FOMC rapidly approaching that could provide the volatility to trigger either of these moves, lets see what happens next.

NZDUSD Bullish Rebound!
HI,Traders !
#NZDUSD made a retest of
The falling support line
While trading in a local
Uptrend and we are already
Seeing a bullish reaction
So we are locally bullish
Biased and we will be
Expecting a further move up !
Comment and subscribe to help us grow !


USDCAD SHORT 1HHead & Shoulder and bearish divergence spotted.
expecting it will break the neckline and start bearish trend.

GBP/USD Setting Up for Expansion | Sept 10, 2025🚀 GU Setting Up for Expansion | Sept 10, 2025
📌 Daily: Still bullish 🔥
📌 4H: Momentum bullish ✅
📌 1H: Bullish but no established high/low yet 📈
📌 15M: EXPECTING A TP HT
Price reacted perfectly off discount pricing 🎯 and showed strong buy pressure. ⚡️
⚠️ Caution: Only validate sellers if we see a clean break & close above both LQ zones – otherwise bullish continuation remains in play.
💡 Smart money might sweep liquidity before running higher… stay patient & let price confirm the move.

XAU/USD on Fire — Next Stop $3,750?Gold (XAU/USD) on the 1H chart is currently maintaining a bullish structure, with price trading around $3,644 after bouncing from the $3,610 support zone. This area has repeatedly acted as a demand level, confirming that buyers are defending dips. The market has been forming higher lows and higher highs, which reinforces the bullish bias.
On the upside, the price faces resistance around $3,674–$3,700, which aligns with the marked take-profit zone. If bulls manage to push above $3,700 with momentum, the next extension target could be near $3,750, a psychological level and a historically reactive price point. On the downside, $3,610 remains a key invalidation level; a break below could shift momentum back toward sellers.
From a momentum perspective, recent buying signals around the lower zones confirm continued interest from institutional buyers. The recent cluster of selling signals near $3,670 reflects short-term supply pressure, but price behavior shows that demand is gradually absorbing that.
________________________________________
✅ Trade Setup (Bullish)
• Entry: $3,645 – $3,650
• Stop Loss: Below $3,610
• Take Profit 1: $3,674
• Take Profit 2: $3,700
• Extended Target: $3,750
________________________________________
Risk handling is critical here. The setup offers a 1:1.5 to 1:2 risk/reward, depending on entry execution. A smart approach would be to book partial profits at $3,674, then trail the stop-loss to breakeven. If price breaks above $3,674 convincingly, use a trailing stop strategy under each new higher low on the 1H chart. This allows traders to lock in gains while still staying exposed to the larger bullish move.
In short, Gold remains poised for a bullish breakout, with strong upside potential if resistance levels are cleared. Careful trade management with partial exits and trailing stops will ensure traders maximize profit while limiting risk.
________________________________________

Short Gbpusd using today's high as slPrice has retraced after clearly sell side liquidity but it's expected to continue selling

USDCAD H4 | Bearish reversal off overlap resistanceUSD/CAD is reacting off the sell entry which is an overlap resistance that lines up with the 61.8% Fibonacci retracement and could reverse from this level to the take profit.
Sell entry is at 1.3856, which is an overlap resistance that lines up with the 61.8% Fibonacci retracement.
Stop loss is at 1.3918, which is a swing high resistance that lines up with the 100% Fibonacci projection.
Take profit is at 1.3791, which is a pullback support that aligns with the 50% Fibonacci retracement.
High Risk Investment Warning
Trading Forex/CFDs on margin carries a high level of risk and may not be suitable for all investors. Leverage can work against you.
Stratos Markets Limited (tradu.com ):
CFDs are complex instruments and come with a high risk of losing money rapidly due to leverage. 65% of retail investor accounts lose money when trading CFDs with this provider. You should consider whether you understand how CFDs work and whether you can afford to take the high risk of losing your money.
Stratos Europe Ltd (tradu.com ):
CFDs are complex instruments and come with a high risk of losing money rapidly due to leverage. 66% of retail investor accounts lose money when trading CFDs with this provider. You should consider whether you understand how CFDs work and whether you can afford to take the high risk of losing your money.
Stratos Global LLC (tradu.com ):
Losses can exceed deposits.
Please be advised that the information presented on TradingView is provided to Tradu (‘Company’, ‘we’) by a third-party provider (‘TFA Global Pte Ltd’). Please be reminded that you are solely responsible for the trading decisions on your account. There is a very high degree of risk involved in trading. Any information and/or content is intended entirely for research, educational and informational purposes only and does not constitute investment or consultation advice or investment strategy. The information is not tailored to the investment needs of any specific person and therefore does not involve a consideration of any of the investment objectives, financial situation or needs of any viewer that may receive it. Kindly also note that past performance is not a reliable indicator of future results. Actual results may differ materially from those anticipated in forward-looking or past performance statements. We assume no liability as to the accuracy or completeness of any of the information and/or content provided herein and the Company cannot be held responsible for any omission, mistake nor for any loss or damage including without limitation to any loss of profit which may arise from reliance on any information supplied by TFA Global Pte Ltd.
The speaker(s) is neither an employee, agent nor representative of Tradu and is therefore acting independently. The opinions given are their own, constitute general market commentary, and do not constitute the opinion or advice of Tradu or any form of personal or investment advice. Tradu neither endorses nor guarantees offerings of third-party speakers, nor is Tradu responsible for the content, veracity or opinions of third-party speakers, presenters or participants.

XAUUSD EXPECTATION BEFORE INFLATION DATA RELASE Hi Traders,
Here my Analysis for OANDA:XAUUSD . As we seen the NFP data release last week shown the weak to USD and already achieve on the monthly zone using my own fibonacci retracement. The inflation data would be the main point for this week.
The Daily candle created 9/9/2025 show the seller give a hint to make a push for short, I will looking for the best price for retracement to continue short for a while for this week with the data release and fundamental.
3644 - 3647 is the range price im looking for short entry. and will looking for price action first before execute the entry.
For support level would be on my TP1 zone , which have a demand on H4 timeframe while the best support level would be my TP2.
If you have any comment or ideas very welcome to share it in comment. Thank you and have a good trade!!

EURNZD Will Go Higher! Long!
Please, check our technical outlook for EURNZD.
Time Frame: 1D
Current Trend: Bullish
Sentiment: Oversold (based on 7-period RSI)
Forecast: Bullish
The market is approaching a significant support area 1.969.
Current market trend & oversold RSI makes me think that buyers will push the price. I will anticipate a bullish movement at least to 2.013 level.
P.S
We determine oversold/overbought condition with RSI indicator.
When it drops below 30 - the market is considered to be oversold.
When it bounces above 70 - the market is considered to be overbought.
Disclosure: I am part of Trade Nation's Influencer program and receive a monthly fee for using their TradingView charts in my analysis.
Like and subscribe and comment my ideas if you enjoy them!

USOIL SELLERS WILL DOMINATE THE MARKET|SHORT
USOIL SIGNAL
Trade Direction: short
Entry Level: 63.28
Target Level: 61.46
Stop Loss: 64.49
RISK PROFILE
Risk level: medium
Suggested risk: 1%
Timeframe: 3h
Disclosure: I am part of Trade Nation's Influencer program and receive a monthly fee for using their TradingView charts in my analysis.
✅LIKE AND COMMENT MY IDEAS✅

EURUSD BUY?Market is overall bullish on daily and weekly. Based on 4HR TF, the market seems to be forming a possible reversal pattern which could lead to a possible reversal.
We could see BUYERS coming in strong should the current level hold.
Disclaimer:
Please be advised that the information presented on TradingView is solely intended for educational and informational purposes only.The analysis provided is based on my own view of the market. Please be reminded that you are solely responsible for the trading decisions on your account.
High-Risk Warning
Trading in foreign exchange on margin entails high risk and is not suitable for all investors. Past performance does not guarantee future results. In this case, the high degree of leverage can act both against you and in your favor

XAU BULLISH FLAGHey Guys, I see a clear Bullish flag in 1TF if the BCC happens above 3,649.37 with 3/5mins TF Bullish Engulfing candle with bullish FVG buying opportunities towards 3675 and beyond. Clear "V" recovery in play !. Trade according to your plans with proper MM and confluence. Cheers!

XAUUSD – Outlook Ahead of PPI ReleaseXAUUSD – Outlook Ahead of PPI Release
Good day Traders,
Gold recently advanced towards the Fibonacci 2.618 extension before meeting resistance and reacting lower. Price has also broken through the most recent minor low within the upward structure, which, in my view, represents a violation of the prevailing bullish trend. A further leg would still be required to establish a durable reversal structure, yet the case for a bearish bias is already forming.
Fundamental Context
Later today, the US PPI data will be released. Expectations are for 0.3%, down from 0.9% previously. Should the forecast materialise, gold could extend higher in the short term. However, I believe the figure may not prove as weak as projected, and therefore it is prudent to monitor the market’s response to the data before committing to fresh positions.
Technical Levels of Interest
3660: A potential retest of this zone could provide another reaction and may represent the most attractive level to initiate short exposure.
3318: If gold confirms a lower structure in line with Dow theory and decisively breaks beneath prior support, the market could extend towards this deeper downside target.
Trading Approach
The preferred strategy for today is to seek selling opportunities:
Ideal entry: around 3660, should price retest and reject the level.
Strong confirmation: a decisive candle close beneath old support would validate further downside and provide a clear short entry.
Short-term traders may also consider scalping within the corrective range created during yesterday’s US session, as the market redistributes price action.
This is my perspective on gold for the day. Traders should use it as a guide and align it with their own analysis and risk management.

Potential bearish drop?EUR/USD is reacting off the support level, which is a pullback support, and a breakout of this level could lead the price to drop from this level to our take profit.
Entry: 1.1705
Why we like it:
There is a pullback support.
Stop loss: 1.1739
Why we like it:
There is a pullback resistance level.
Take profit: 1.1657
Why we like it:
There is a pullback support that is slightly below the 78.6% Fibonacci retracement.
Enjoying your TradingView experience? Review us!
Please be advised that the information presented on TradingView is provided to Vantage (‘Vantage Global Limited’, ‘we’) by a third-party provider (‘Everest Fortune Group’). Please be reminded that you are solely responsible for the trading decisions on your account. There is a very high degree of risk involved in trading. Any information and/or content is intended entirely for research, educational and informational purposes only and does not constitute investment or consultation advice or investment strategy. The information is not tailored to the investment needs of any specific person and therefore does not involve a consideration of any of the investment objectives, financial situation or needs of any viewer that may receive it. Kindly also note that past performance is not a reliable indicator of future results. Actual results may differ materially from those anticipated in forward-looking or past performance statements. We assume no liability as to the accuracy or completeness of any of the information and/or content provided herein and the Company cannot be held responsible for any omission, mistake nor for any loss or damage including without limitation to any loss of profit which may arise from reliance on any information supplied by Everest Fortune Group.

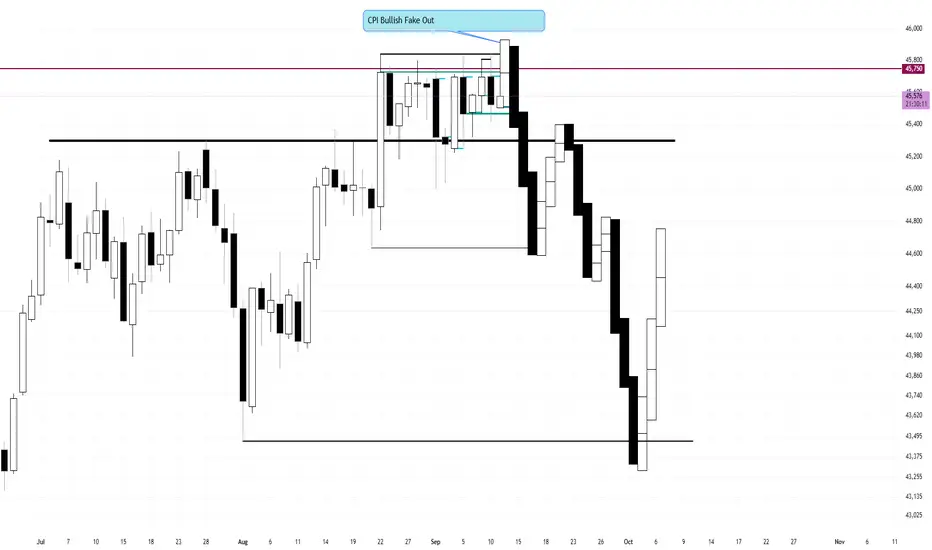
CPI Bullish Fake out (Bearish Range- False Break Reversal)
I am anticipating a Bullish close on Thursday to close above these highs for a 1% rally. Then Friday to wipe the board to start the move back down to the other side of the range for the true support Long.
I will continue to look for Sells until support. This is a Bearish range at the top.
Expecting more pump to the upside Seeking a moonshot to 0.006 then 0.007 👏 look forward to seeing you soon 🥳

Btcusdt Btc heading to 117k easily . The resistance has been broken on the 4hrs clearly I think one final push up is left until bull run finish maybe after the rate cuts then we see btc reach a new ATH

DOT; BUY OR SELL?Hello friends
Given the good growth we had, the price has formed a triangle, and if the triangle breaks, the price can move to the specified targets.
If the price falls, we have two excellent support areas that the price will definitely react to.
*Trade safely with us*

BUYING OPPORTUNITYeuraud
buying setup reasons 1.uptrend in high timeframe 2.price form new higher high in daily timeframe 3.price is at support level

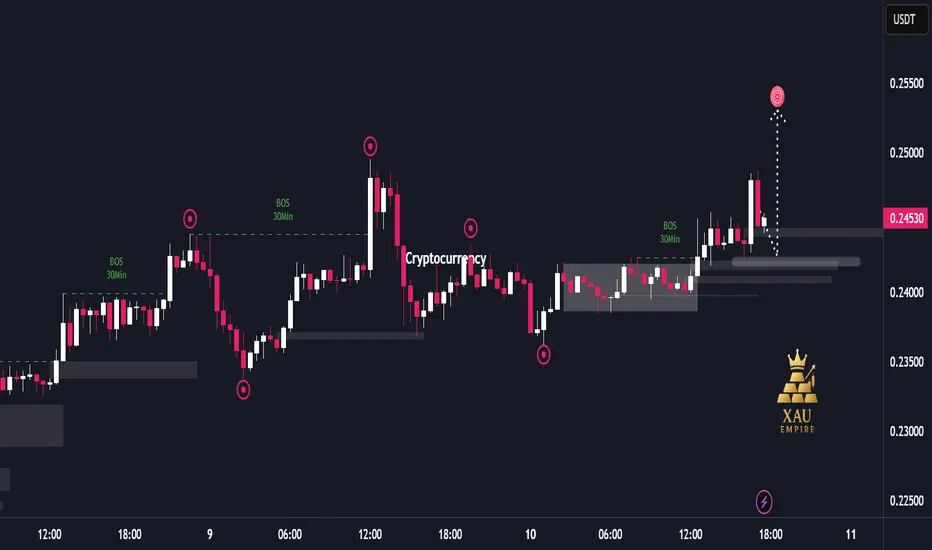
Institutional Flow Driving DOGE Upside Liquidity Hunt📊 Report-Based Analysis
Market Structure:
The chart shows multiple “Break of Structure (BOS)” events, indicating that institutional orders are driving the market direction. Frequent upside BOS suggests that the bullish trend is currently dominant.
Liquidity Movements:
Price has repeatedly hunted liquidity around major highs and lows (sharp wicks and sudden moves triggering stop losses) before returning to its intended direction. This behavior reflects strong institutional control over market flow.
Price Action Dynamics:
First, the market expanded upward with strong bullish momentum.
A sharp correction followed, creating volatility.
Afterwards, price entered a consolidation phase, which later broke to the upside.
Despite a recent rejection, the bullish structure remains intact.
Current Situation:
Price is trading around the 0.245 area. A large bullish candle was followed by a quick rejection, but the broader structure continues to lean bullish. Projections on the chart suggest a potential push higher as liquidity targets remain above.
Market Bias:
Short-term bias remains bullish. The consistent BOS and formation of higher lows show that the market is more likely to continue seeking upside liquidity in the near term.