Solana - The bullish background remains strongCurrent Technical Signals
SOL is trading around $180-$181, holding above the key 20-day EMA, which is around $178.25. A break below this level could open the way to support around $171.78, while holding above this level creates potential for a rise towards $186.40-$190.47.
A golden cross is forming between the 100- and 200-day EMAs on the daily chart - a classic bullish signal, strengthening the chances of a rise to $200.
Your network volume and balances on exchanges are showing a decline, which indicates a decrease in supply - easing pressure on the price and supporting bullish sentiment.
Support and Resistance
Support:
$178.25 (20‑EMA)
$171.78 — lower limit in weak market
The Currency analytics
Resistance:
$180–$190 zone — critical for further gains
Upper resistance at ~$200 — critical for rally continuation
Structural and Valuation Signals
A test of the daily bullish divergence on SOL indicates potential for further gains after correction.
SOL recently broke out of its ascending channel, indicating a possible reversal and the beginning of a new move higher.
Finance Feeds
Community ideas

Gold mapping for next weekGold is going down. Gold Major trend is Changing to bearish, lets see are Gold going down after grab liquidity
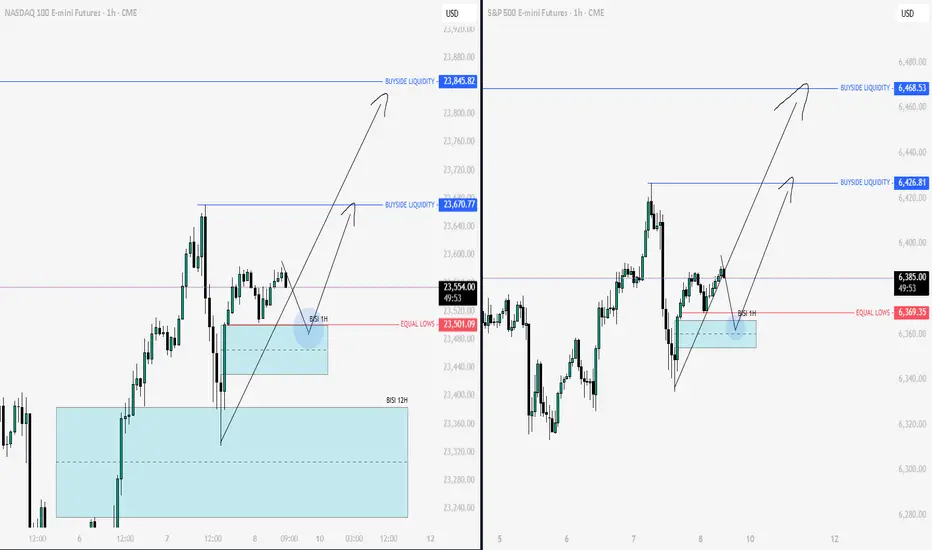
Nq & Es Key Levels & Daily Bias 08-08-2025Today’s bias is once again bullish, aiming for those all-time highs.
When the market opens at 09:30, I’d like to see price dip into discount zones or take out some lows first — that would set up a nice rally upward and a potential long opportunity.
If that doesn’t happen, I’ll stay on the sidelines. No chasing longs in premium territory.
Enjoy the day no matter what happens, and keep learning so you’re sharper tomorrow.
We’ll check back later to see how it played out.
Long trade
15min TF overview
🟩 Trade Type: Buyside Trade
Pair: ETHUSDT
Date: Sunday, 3rd August 2025
Time: 5:15 PM
Session: London–New York Overlap (LND Session PM)
Timeframe: 15 minutes
🔽 Entry Parameters
Entry Level: 3,455.23
Stop Loss: 3,436.73 (-0.54%)
Take Profit: 3,877.00 (+12.21%)
Risk-to-Reward (RR): 22:8
📉 Market Structure & Technicals
Trend Context:
Price reversed from a steep bearish trend and showed signs of a bullish momentum shift.
EMA/WMA Levels:
EMA (blue) and WMA (yellow) show a bullish crossover at the point of entry
Both MAs began to slope upward, confirming the trend shift.
Liquidity Observations:
Clean sweep of prior lows below 3,500 preceding entry.
Price traded back into a premium zone after reacting from a deep discount.
🧠 Narrative / Rationale
Set up Narrative:
ETH completed a strong downtrend and printed a bullish market structure shift (MSS) on the 15-minute TF. Entry was taken after price reclaimed the (POI) and confirmed a higher low.
Current Status: Trade in progress, profit levels partially hit.
TP aligns with the previous supply zone or relatively equal highs around 3,784.
Additional liquidity above 3,877–3,915 for extended targets if trade continues.

Ethereum Not Dead- i know some peoples think ETH will go to 250$ or 500$, so wait for it...
- I've always maintained that I'm not a fan of ETH because of its scalability limitations and centralization, for that reason ETH needs some messy L1...L2...etc..
- That said, my opinion doesn’t matter much, ETH is here to stay. The Ethereum ecosystem hosts thousands of projects; I’d say it’s too big to fail.
- i used Bitstamp exchange to look further back in the chart's history.
- i simplified this monthly chart so much that even a 10 year old kid could understand it, just check the RSI low levels and compare it with previous years. Again, check the max RSI level for the previous ATHs.
- i won't discuss where to buy because, whether you get ETH at $1,800 or $1,500, the bull run for ETH and Altcoins hasn't started yet.
Happy Tr4Ding !

Is Eth still in a downward channel?On 7/23 I wrote:
"Eth will hit my red T1 target, bounce to the top of the current range (green T1)
then drop..."
So far these 2 targets were hit and target 3 (bearish T2) was off by 1%
7/24 Bearish T1 hit
7/28 Bullish T1 hit
8/3 Eth drops toward Bearish T2 (within 1%)
8/7 (Today) I will soon determine if this is a fakeout and my lower target gets hit, or if the bearish scenario will get invalidated and I will enter the remainder of my positions upon confirmation. Either way trading the initial range proved to be a success and I have a strategy moving forward.
I keep these stats for myself to track my accuracy. I also used to track influencer's predictions (when I first started many years ago). I would write notes on my charts, documenting each influencers predicitons and see how often they were correct. If not how do we really know if we should be following them?

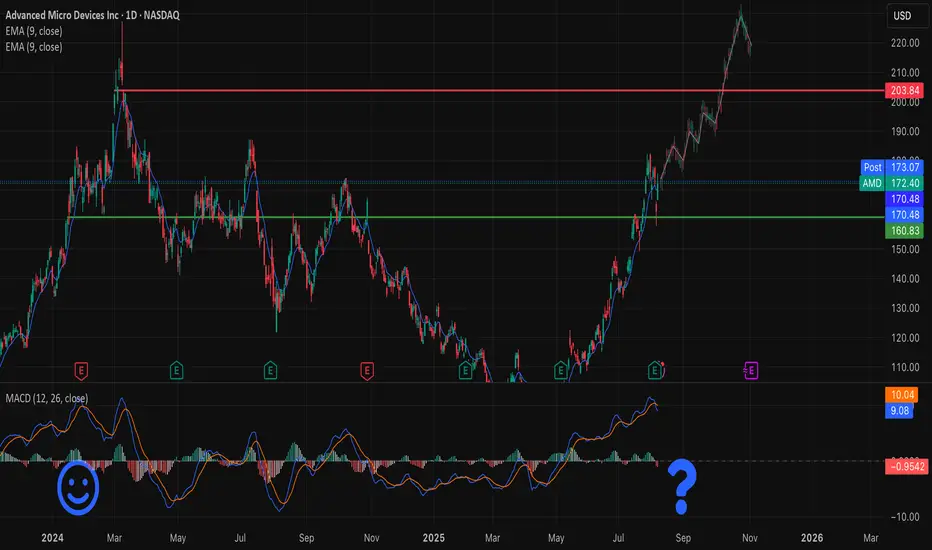
$AMD — Is history repeating itself?NASDAQ:AMD The chart is showing a pattern strikingly similar to previous highs — a strong rally after a long accumulation, followed by a pullback on news.
📰 Q2 2025 Earnings:
• Record revenue: $7.7B (+32% YoY)
• Strong sales in Ryzen CPUs and Radeon GPUs
• Q3 outlook: $8.7B revenue, ~54% margin
What’s holding it back:
• Export restrictions on MI308 to China hit margins and investor sentiment
• Short-term profit taking after a powerful rally
Reasons for optimism:
• Upcoming AI products MI350 and MI400 could be major growth drivers
• Expected demand from data centers and AI infrastructure
Technical view:
• EMA 9 remains above key support levels (170, 160)
• MACD is close to a potential bearish crossover — worth watching
• Past highs show that sharp corrections in AMD often set the stage for the next wave up
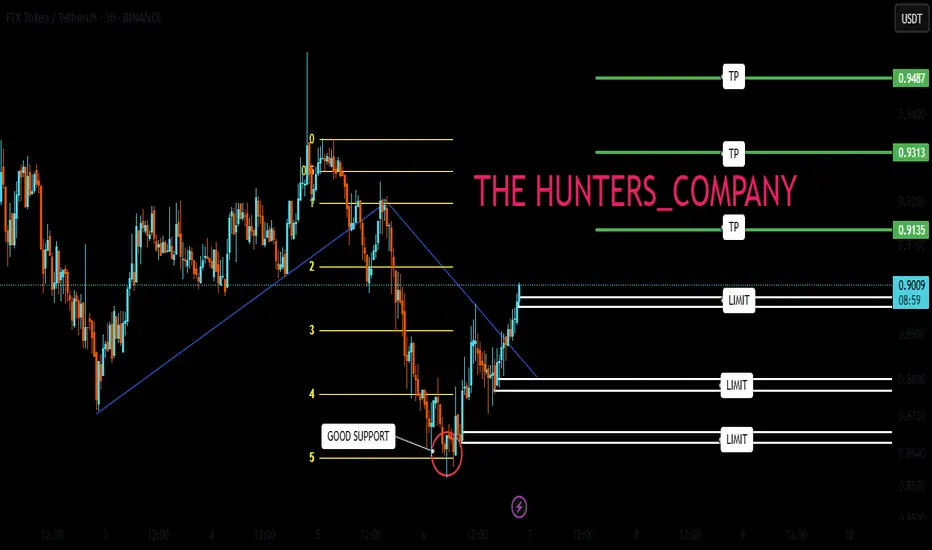
FTT : Go to work, it's goodHello friends🙌
✅after the decline we had, you can see that the price was supported by buyers in the support area we identified with Fibonacci and broke its resistance.
✅Now you can buy in the support areas we have identified for you with risk and capital management and move towards the set goals.
🔥Follow us for more signals🔥
*Trade safely with us*
BIO : BUY MARKET!!!Hello friends🙌
✅Given the good upward wave we had, the price has now corrected, providing a good opportunity to buy in steps in the specified areas with risk and capital management and move towards the specified goals.
🔥Follow us for more signals🔥
*Trade safely with us*

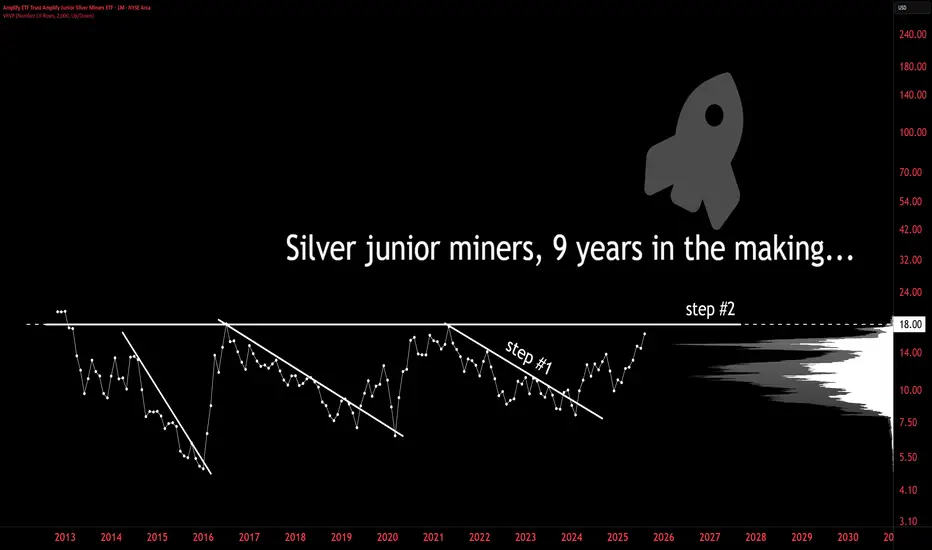
SILVER JUNIORS: 9 YEARS IN THE MAKING🚨 SILVER JUNIORS: 9 YEARS IN THE MAKING
✅ Step 1: Internal breakout
🔜 Step 2: Final resistance @ $18
When these go, they don’t walk — they sprint.
The chart says it all.
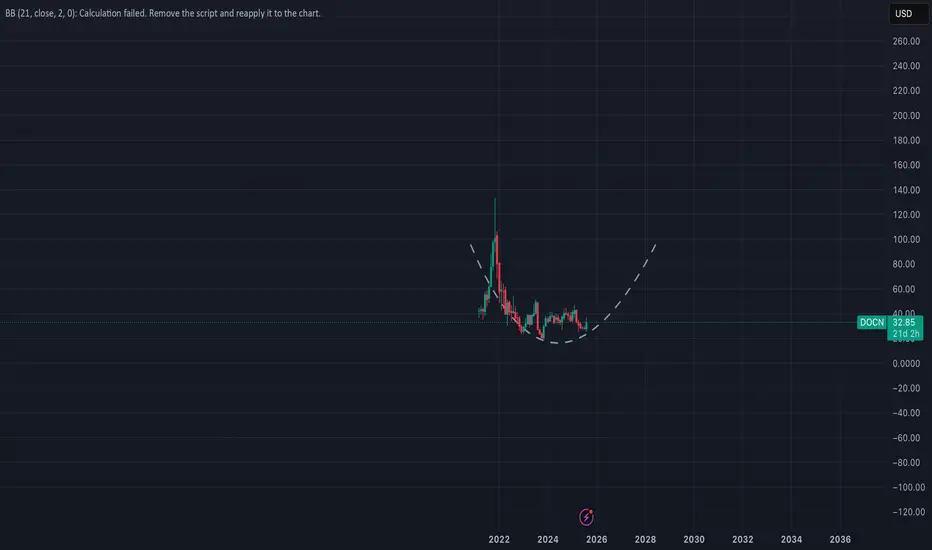
Potential rounded bottom or C&H early formationConsolidated for multiple quarters and seems to have formed a strong base..Rounding bottom in formation?
on watch for now:
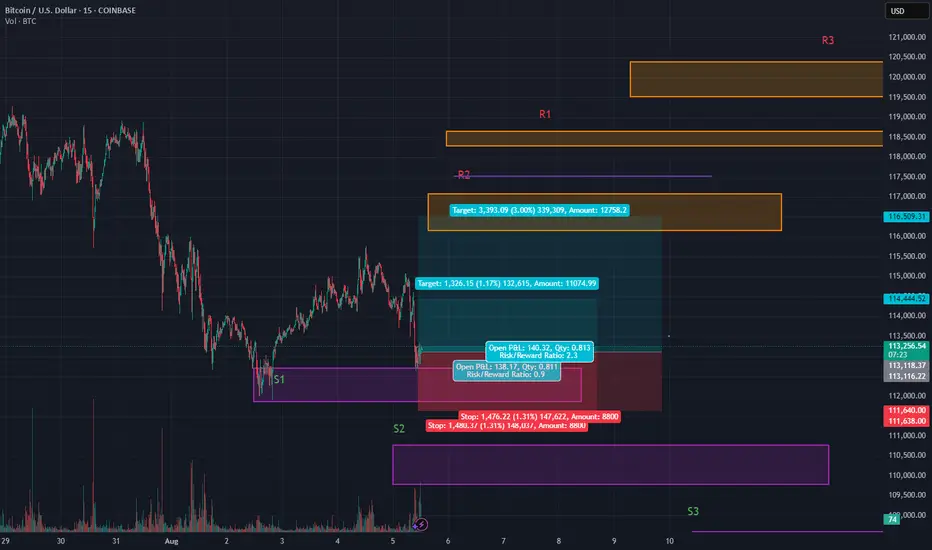
BTC Bleeding, Scalpel Please💣 Price just nuked back to our OG S1 zone and buyers are throwing hands at $113k 🥊
This is a quick scalp play while the dust settles
🎯 Entry: 113,159
🛡 Stop: 113,111 (just below S2's base. you can tighten this up, to the base if desired.)
📈 Scalp Target 1: 114,444
🚀 (Swing Trade) Target 2: 116,588
🧠 Setup: Reclaim after wick trap
📐 Structure: Bullish continuation off demand
📍 Zone: Micro-range base + sweep low trap
Scalpel sharp ✂️
Clean. Tight. Ruthless.
⚠️ Heads up — 30m still trending down
So lock those stops and stay nimble 🔪
⚠️If $113k fails, watch for a flush to S2 or even S3.
This bounce is a scalp — not a trend shift (yet) 🚨
Is oil price heading back up? Watching a potential inverse head and shoulders forming on the 30-minute chart for Oil.
🔹 Risk/Reward: 2.7
🔹 Entry: 63.290
🔹 Stop Loss: 63.043
🔹 Take Profit 1 (50%): 63.93
🔹 Take Profit 2 (50%): 64.21
A couple of key factors still need to align before I pull the trigger:
• One will confirm around 14:45 SAST (GMT+2)
• Looking for lower volume on the right shoulder compared to the left
What do you think? Is oil ready to push higher?
Drop your thoughts or how you trade inverse head and shoulders below! 👇

Ripple (XRP): 1:3 RR Position Opportunity Here | Breakout ComingXRP is still rising, attempting to break the local high and possibly reach a new all-time high (ATH). We found two trading opportunities here, so now all we have to do is wait!
More in-depth info is in the video—enjoy!
Swallow Academy

SYN/USDT – Bullish Structure & Key Reversal Zoneis forming a clean bullish structure, with the first leg of the reversal starting from the $0.12 zone, which acted as a key pivot level. A recent liquidity sweep below $0.12 has now been fully reclaimed, suggesting strong buyer presence and a confirmed reversal signal.
With price stabilizing above this reclaimed zone, SYN is showing early signs of building momentum for the next leg higher. Holding above $0.12 may pave the way for continuation and potential trend acceleration.

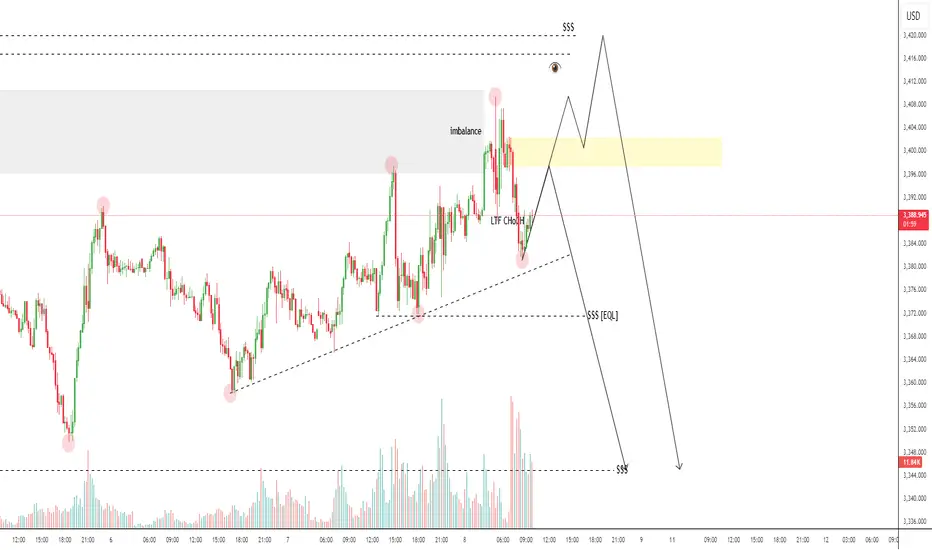
SMART MONEY CONCEPT (SMC)📉 Análisis Bajista XAU/USD – SMC
🔹 1. Market Context
Price completed the mitigation of the 4H FVG, closing the previous bullish cycle. This opens the door for a new bearish impulse, as there is no remaining imbalance to fill in that zone.
🔹 2. Structure Shift
• Trendline break confirming loss of bullish momentum
• Clear ChoCh and BOS after the break
• Strong rejection at the resistance zone
🔹 3. Entry Zone
• 15M Order Block (OB-15M) marked as optimal sell entry after rejection
• Entry aligned with bearish structure confirmation
🔹 4. Target
• Aiming for the support zone, where resting liquidity is likely to be taken
• Stop Loss placed above resistance to protect from potential fake outs
💡 Summary:
Bullish cycle completed → structure shift → resistance rejection → bearish projection towards support with high probability. GOOD LUCK TRADERS… ;)

TESLA ABC Trap ZoneTesla’s price action has been exhibiting a period of consolidation characterized by lateral movement, forming a pattern commonly identified as a triangular structure. Triangular formations, by their nature, have the potential to break out in either direction—upward or downward—depending on market dynamics. However, my focus is particularly on recognizing this pattern within the context of an Elliot Wave ABC corrective structure.
Specifically, the second wave in this sequence appears to manifest as a triangle, suggesting a phase of market indecision and consolidation. This phase is typically followed by a final impulsive move downward, which would serve to complete the overall corrective pattern. Understanding this sequence is critical, as it provides insight into the potential continuation or reversal of Tesla’s price trend after the correction concludes.

GRT Main trend. 23 02 2025Logarithm. Main trend. Time frame 1 week (no need for less). Hype will be when they promote everything related to artificial intelligence. It may go against the general trend in this regard.
But, at the moment, behind the market, which is logical. I imposed dynamic support/resistance zones of the Gann fan for orientation with the intersection of ordinary key levels (as everyone sees). I showed formations that can be formed and key reversal zones, percentages to them.
Previous closed trading idea +311% / +890%
1️⃣exactly in the designated zones of the planned first “hamster pump” +311%
2️⃣and the maximum pump (planned dump zone) 700-900%
GRT/USDT Main trend. Descending wedge. 8 02 2023
Local trading situation now.
Locally, after collecting long stop-loss at a large % (-27), this zone is held. If the market as a whole is positive, then this zone with 3 trend support points will be the main support for the development of the upward trend.
If this zone is broken, and the price consolidates below the “neck” level, then a decline to the 0.78 zone, that is, the formation of a descending wedge in the secondary trend. There will be a “double bottom” globally. Then, a breakthrough of the wedge resistance, and aggressive pumping under the hype of all that sort of thing.
Scam. Unlikely . Lower declines (implementation of "head and shoulders" without a squeeze) — the likelihood of a scam, that is, tales of hacking and "closure of the project". What is unlikely is how the project is traded in the US on Coinbase, and for this there are consequences for the creators.

GBPUSD Potential UpsidesHey Traders, in today's trading session we are monitoring GBPUSD for a buying opportunity around 1.33900 zone, GBPUSD is trading in an uptrend and currently is in a correction phase in which it is approaching the trend at 1.33900 support and resistance area.
Trade safe, Joe.

Maruti Suzuki Maruti had been consolidating in this zone for the past 3 months. It has now given a breakout & may potentially move towards the 13500 range in the coming days.

short market outlook on AUDUSD todayfor todays AUDUSD market we can except to short the market after price break Asia low and retraces up to premium zone and getting CHOCH

$ETH \ $BTC GONNA SEND INCOMING!The Ethereum-Bitcoin parity saw a local bottom after a long-term correction phase and began to move upward. The upcoming process will continue with a sharp upward trend.

BITCOIN PREDICTION: a SECRET PATTERN is FORMING (watch out)!!!Yello paradisers! In this Bitcoin prediction, I'm updating you about the crash we predicted earlier in previous videos. I'm showing you on a high timeframe chart the ABC corrective mode wave; we are now forming the C wave. The C wave subdivides itself into five smaller waves because it's a motive mode wave. We are taking a look at the volume. We understand that bears are still in power, so we are waiting for some nice volume from bulls. We are spectating a bullish divergence on the MACD indicator. On RSI, there is exaggerated bullish divergence, and in stochastic RSI, we are in an oversold area.
Then, we are shifting our focus to a medium timeframe. We are zooming into the fourth wave, where we are making our sub-waves right now. On the medium timeframe, we are also spectating bearish divergence. We are waiting for the second booby that will basically increase the probabilities of absorption.
As we have seen previously, that helped us to predict that Bitcoin will be crashing. We are also taking a look at our head and shoulders target, which is at $109,000.
Then we are shifting our focus to a lower timeframe, where we are seeing the secret pattern, triple three. Right now, we are creating a sub-wave XX, which is forming itself as a possible zigzag. Paradisers, make sure that you are trading professionally, focus on long-term growth, and avoid get-rich-quick schemes. Any shortage in trading usually ends up sooner or later in bankruptcy.
Remember, don’t trade without confirmations. Wait for them before creating a trade. Be disciplined, patient, and emotionally controlled. Only trade the highest probability setups with the greatest risk to reward ratio. This will ensure that you become a long-term profitable professional trader.
Don't be a gambler. Don't try to get rich quick. Make sure that your trading is professionally based on proper strategies and trade tactics.
