Dogecoin (DOGE) Update — $0.14 Reclaims SupportDogecoin continues to stabilise above the $0.14 region after a sharp fakeout trapped late sellers. The recovery back into support has created early signs of a potential three-drives reversal pattern forming.
Price action now shows a consistent defence of this level, and with a third drive taking shape, bullish pressure is gradually building. Holding above $0.14 increases the chances of an expansion move into higher resistance zones.
Key Points
- Price has reclaimed a key support level after a liquidity sweep.
- Market structure suggests a possible shift in short-term momentum.
- A break above local resistance may trigger continuation to the upside.
What to Expect
As long as DOGE stays above $0.14, the probability of a push toward $0.21 and possibly $0.24 increases. Losing this level would invalidate the pattern and restore bearish control.
Community ideas

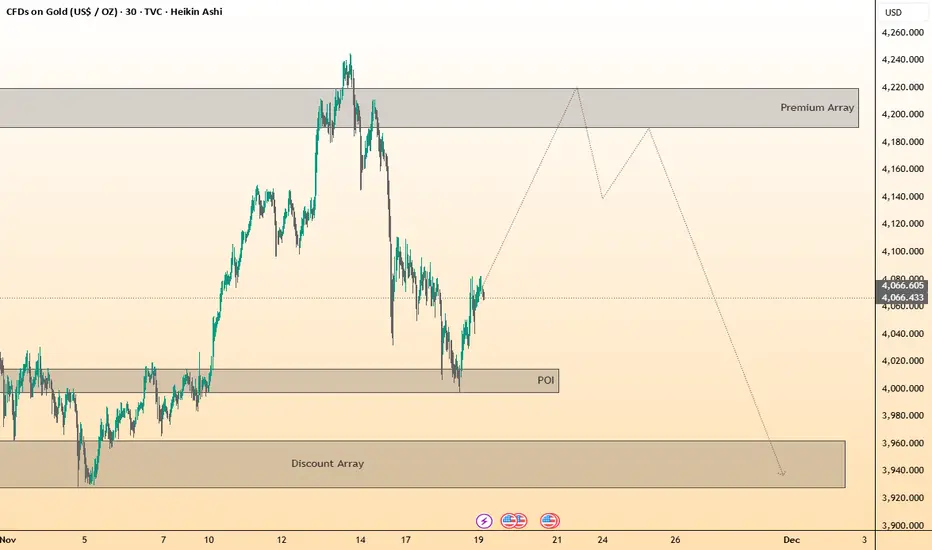
ICT-based structures and expected price projections.Key Elements Visible:
🔹 Current Market Price:
Price is trading around 4066.
🔹 Previous Swing High Zone:
A Premium Array is drawn as a large grey zone around the 4180–4220 area, indicating a potential distribution or sell zone where price may react after grabbing liquidity.
🔹 Previous Swing Low / POI:
A Point of Interest (POI) is marked below, around the 4000–4020 region. This is shown as a discount area where buyers may step in.
🔹 Discount Array:
At the bottom of the chart, a large Discount Array box is shaded, around the 3920–3980 zone, suggesting a deeper liquidity pool or bearish objective if the lower POIs are taken.
🔹 Projected Price Path:
A speculative line (market structure projection) is drawn showing:
A move upwards toward the Premium Array zone
Followed by a sharp reversal downward, targeting the Discount Array
🔹 Market Structure Context:
The current price appears in a retracement phase, attempting to recover from a previous sharp decline.
CAKEUSD - PancakeSwap enter bull phaseHi
Pancake Swap has around 3B TVL into his DEX and its still the most used.
Owned by Binance.
Even though is a big range, this kind of altcoin could be highly speculative and can reach unimaginative prices.
This is not a trading advice.
Thanks
Gex

FIL/USDT Road to $6.50FIL is showing some early bullish signs for a potential reversal setup on the 4H timeframe. Price action suggests we are currently in the accumulation phase of a Cup & Handle formation.
I'm expecting a an exact mirror move where price will move almost identical to the previous swing low. Afterwards, if market momentum is stable enough price can charge upwards to the marked targets.
This trade setup could be had for both Intra-day and Swing traders. Depending on your goals and risk management.
Good Luck!

ALT SZN CHART Crypto cap without btc.
February will do what last years february failed to deliver.
I do believe an altseason will occur.

How to Use Simple Moving Averages (SMA) to Predict Price TargetsIn this video, you’ll learn exactly how to use the Simple Moving Average (SMA) to find both short-term and long-term price targets.
I explain which SMA settings work best, how to spot trend direction, and most importantly:
When you should take a trade and when you should stay OUT of the market to avoid losses.
What You’ll Learn:
How the Simple Moving Average works (SMA 9, 21, 50)
How to use SMA for short-term and long-term price targets
Best SMA crossover strategies
When to enter a trade using SMA
When to stop trading / avoid traps
How institutions use SMA to set levels
Tips to improve your accuracy and timing

Trade Setup: AUD/USDType: Short
Entry: 0.65194
Stop-Loss: 0.66747
Target: 0.62088
Risk-Reward: 2:1
Rationale: Tracking this trade with proper risk management.

MERLUSDT PERPETUAL TRADE SELL SETUP Short from $0.35500MERLUSDT PERPETUAL TRADE
SELL SETUP
Short from $0.35500
Currently $0.35500
Targeting $0.34400 or Down
(Trading plan IF MERL
go up to $0.38 will add more shorts)
Follow the notes for updates
In the event of an early exit,
this analysis will be updated.
Its not a Financial advice

EUR USD Bearish Potential EUR/USD 15m (Educational only) This idea is based on a confluence of pure price action, volume analysis, and market structure. We have identified a high-probability short setup on the EUR/USD 15-minute chart.
1. Price Action: The Shooting Star Rejection The most critical signal is the candlestick pattern at the recent high (approx. 1.05600).
Observation: We see a prominent Shooting Star candle. This is defined by a small body at the bottom of the range and a very long upper wick.
Interpretation: This wick represents a failed attempt by buyers to push the price higher. The market rallied into this level, but aggressive selling pressure (supply) overwhelmed the buyers, forcing the price to close near its lows. This is a clear sign of a momentum shift from bullish to bearish.
2. Market Structure: Testing Supply The rejection occurred precisely within a known Supply Zone (resistance area).
Observation: Price rallied into the same level where it had previously sold off sharply.
Interpretation: The market was "testing" to see if there were still sellers at this price. The violent rejection confirms that significant supply remains, making it a formidable ceiling for price.
3. Volume Analysis: The Bearish Divergence The volume histogram provides confirmation of the price action.
Observation: As the price pushed up to make its final high into the supply zone, the volume was decreasing compared to the previous rally.
Interpretation: This is a classic Volume Price Divergence. It indicates that the upward move was "hollow"—it lacked the strong participation (institutional buying) seen in the earlier part of the trend. A rally on falling volume is unsustainable and often precedes a reversal.
Conclusion & Trade Plan The combination of a bearish candlestick pattern (Shooting Star) at a key structural level (Supply Zone), confirmed by weakening buyer commitment (Volume Divergence), presents a strong case for a short position.
Direction: Short (Sell)
Entry: At market price or on a minor pullback toward the rejection wick's high.
Stop Loss: Just above the high of the Shooting Star's wick, as a break above this level would invalidate the bearish thesis.
Target: The recent swing lows or the next major demand zone lower down.

ASTERUSDT 4H#ASTER is moving inside a falling wedge pattern on the 4H timeframe. If price breaks above both the wedge resistance and the SMA21, the potential targets are:
🎯 $1.1349
🎯 $1.1817
🎯 $1.2196
🎯 $1.2575
🎯 $1.3114
🎯 $1.3801
❌ Invalidation: a 4H candle closing below the wedge support.
⚠️ Always remember to use a tight stop-loss and maintain proper risk management.

My thoughts on BTC and the Market. $200K BTC looms on 2026.My thoughts on Bitcoin for 2025 yearly close and 2026. Covering TA, Macro, bullish signals, bearish signals and more.
Do you agree or disagree?

GoldTrading Strategy | November 28-29✅ 4-Hour Chart (H4) Trend Analysis
1️⃣ Overall Structure: Bulls in Control, Price Breaks Key Resistance
Price has broken above and stabilized above the key resistance at 4156 (yellow line), forming consecutive bullish candles with strong volume, indicating clear bullish strength.
The latest bullish candle has a strong body and closed near its high, showing that upward momentum is still continuing.
2️⃣ Moving Averages: Bullish Alignment
MA5, MA10, and MA20 are in a classic bullish formation, and price is consistently advancing along MA5 and MA10.
MA20 is turning upward, which is a key signal of trend reversal.
➡️ This indicates that the medium-term trend has strengthened, with bulls dominating the market.
3️⃣ Bollinger Bands: Upper Band Opening, Trend Strengthening
Price is riding along the upper Bollinger Band — a typical sign of a strong bullish trend.
The upper band is expanding upward, indicating rising volatility and expanding upside potential.
✅ 1-Hour Chart (H1) Trend Analysis
1️⃣ Trend Structure: Strong Rally, Short-Term Pullback Expected
H1 recently surged to 4226.89 and then pulled back slightly, showing a normal correction after a strong rally.
Price remains above MA5 and MA10, indicating a strong pullback rather than a trend reversal.
2️⃣ Moving Averages: Short-Term Still Bullish
MA5 and MA10 remain in a bullish formation.
MA20 is starting to provide support, making it the key level for short-term pullbacks.
➡️ Short-term bias remains bullish, but a technical correction may occur at any time.
3️⃣ Bollinger Bands: Upper Band Pressure
The H1 upper Bollinger Band is around 4222, and price saw reduced volume after touching it, suggesting short-term profit-taking.
🔴 Resistance Levels: 4226 / 4230
🟢 Support Levels: 4195 / 4182
✅ Trading Strategy Reference
1️⃣ Buy on Pullback (Main Strategy)
Buy in the 4182–4195 range
🎯 Targets: 4218 / 4230
⛔ Stop Loss: 4170
Reason:
H4 has clearly broken above 4156, confirming a medium-term bullish trend. A pullback is a buying opportunity.
2️⃣ Short at High Levels (Secondary Strategy, Light Positions)
Short near 4226–4230 if price shows rejection
🎯 Targets: 4205 / 4195
⛔ Stop Loss: Above 4238
Reason:
H1 faces pressure at the upper Bollinger Band, showing short-term exhaustion and potential for a pullback.

AUDUSDAs usual with our support and resistance, we got this in the bag this week.
Took trade on the 15m TF.
Watch this space this December.
DrElder_

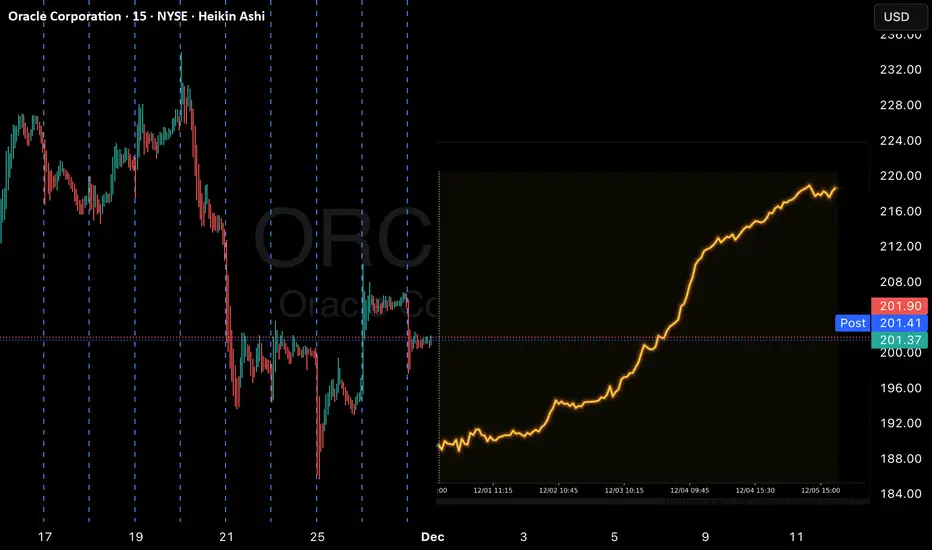
ORCL Swing Signal: Katy AI Predicts Short-Term UpsideORCL Swing Signal — (2025-11-28)
Instrument: ORCL
Direction: BUY CALLS 📈
Confidence: 58% (Medium)
Horizon / Expiry: 14 days → 2025-12-12
Strike Focus: $210.00
Entry Range: $8.50 – $9.00 (mid $8.75)
Target 1: $12.75 (+50%)
Target 2: $15.30 (+80%)
Stop Loss: $6.38 (-25%)
Position Size: 2% of portfolio
Risk Level: Moderate — recent volatility and low confidence
Katy AI Signal
Bullish bias, recovery potential after 7.96% drop
Predicted mean reversion toward $220–$230 range
40.2% swing range position favors upside
Technical Context
Current Price: $201.30 (< VWAP $206.97) → potential bounce
Key Resistance: $219.07
Support: $185.63
Trend Strength: Weak, but setup favors upside
Candlestick Patterns: None detected
Broader Market: STRONG_BULLISH; SPY & QQQ bullish
Options Flow
Neutral flow, low time decay risk
No unusual activity — potential for momentum shift
Trade Setup & Strategy
Why This Trade: Combines oversold bounce potential with broader market tailwinds
Timing Advantage: Enter after sharp single-day drop; favorable risk/reward
Risk Mitigation: Tight stop loss, small position size, scale in if needed
Bitcoin cycle symmetry? Timing-based overviewThe chart highlights three major BTC cycles:
2017 → 2021 → 2025.
Each spans roughly 1064 days from peak to peak.
This pattern has repeated twice, and the current cycle aligns within the same time window.
🔍 Key observations:
The 2017 cycle ended → correction + long accumulation.
The 2021 cycle mirrored the structure.
The current cycle reached a new ATH (~126K), aligning with historical cycle endpoints.
BTC is now trading inside a zone where previous cycles showed strong pullbacks and base formation.
Further movement may develop as corrective waves rather than trend continuation. Historically BTC offered solid bounces after topping out.
Altcoins
Upside still exists, but it depends on BTC holding support.
Stability above key levels = potential alt impulse.
Breakdown = elevated risk for alts.
Summary
BTC cycles ≈ 1064 days each.
Current outlook fits the end-cycle window.
Likely corrective structure with bounce scenarios.
Alts need BTC stability to shine.
The market isn’t emotional it’s geometric.
Cycles aren’t guarantees, but they’re signals worth respecting.

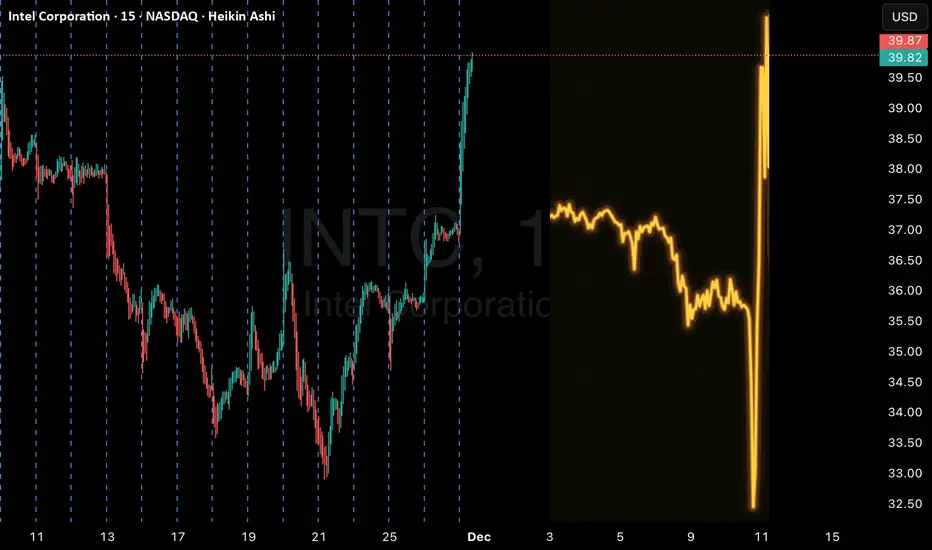
INTC Quant signals v3: Weak Movement, No Edge DetectedINTC — QuantSignals Katy 1M Trading Information (2025-11-27)
🚀 Katy AI Stock Analysis
Symbol: INTC
Current Price: $36.95
📈 Katy Forecast
Final Prediction: $36.84 (–0.29%)
30min Target: $36.93 (–0.05%)
Trend: NEUTRAL
Confidence: 40% (Low)
Volatility: 50.1% (High)
⚠️ Trade Signal Status
No trade signal generated
— Move size too small and confidence below QS threshold.
📊 Summary
From 1 analysis, Katy generated 0 actionable trading signals.
INTC remains in a low-conviction, low-movement zone with high volatility but no clear direction.

Solana: Is the Bottom In, or More Downside Ahead?SOL has already climbed more than 15% from last Friday’s low at its peak, potentially signaling the completion of wave ii in orange. For now, however, we’re still keeping open the possibility that this move could dip to a new low—within our green Target Zone ($155.80–$113.20). In any case, once this interim correction wraps up, wave iii in orange should kick off an impulsive rally, only losing steam above resistance at $295.31.

META – Weekly Chart📈 META – Weekly Chart Overview
A technical rebound may be starting to form.
Several signals from The Wave system are aligning:
✅ Price in the buy zone
META has retraced into a historically strong demand area, perfectly overlapping with the Wave buy signal zone.
This region has acted as a springboard multiple times in the past.
✅ Undervaluation on higher timeframes
The stock is currently trading near its dynamic trendline support, combined with oversold readings on momentum indicators.
This suggests the correction might be approaching exhaustion.
✅ Momentum turning
The stochastic is bottoming out exactly where previous weekly reversals occurred.
RSI also shows early signs of stabilisation.
🎯 Potential scenario
If buyers step in from this level, META could aim for the upper resistance area marked on the chart, offering an attractive risk-to-reward of 3.3 — a favourable setup for medium-term swing traders.
🛑 Invalidation
A clean break below the SL area would shift the structure and invalidate the bullish setup.
This is a textbook example of waiting for high-probability zones rather than chasing the price, discipline always pays.

GBP/CHF – Pullback Into SupportGBP/CHF may be pulling back into a strong support zone within an ongoing uptrend. For a clean continuation setup, we need to see price push deeper into the level and then show clear signs of rejection.
Momentum on the 4H still needs to move lower and then hook upward to confirm buyers stepping back in. If that shift happens, this pair could set up for a quality continuation move.
What we’re watching for:
Deeper tag of the support zone
Clear rejection candle
Momentum turn (down → hook up)
Volume confirmation on 1H or 15M
Structure shift off the zone
No setup yet — just monitoring for VMS alignment.
Educational analysis only — not financial advice.

BTC not over yet.BTC is not over yet, As you can see on the chart there are still 2 major trends remaining as BTC is having a reaction of the 85k level. As long as we can remain this area, there are still possibilities fo a push to a new ath.

Long upside position Strong reversal on dip
Now strong buying zone
Target upto 100000 based fib levels

Gold market Structural Correction in PlayThe gold market reacted firmly at 4190’s, yet underlying imbalances between 4120 and 4090 remain unmitigated. This unresolved liquidity suggests a potential corrective sweep into these zones before bullish momentum can fully re-establish dominance.
Additionally, gold has now broken the bearish trend stance at 4160’s, signalling an early shift in market structure. However, confirmation of bullish continuation will likely depend on how price interacts with the imbalance range below.
