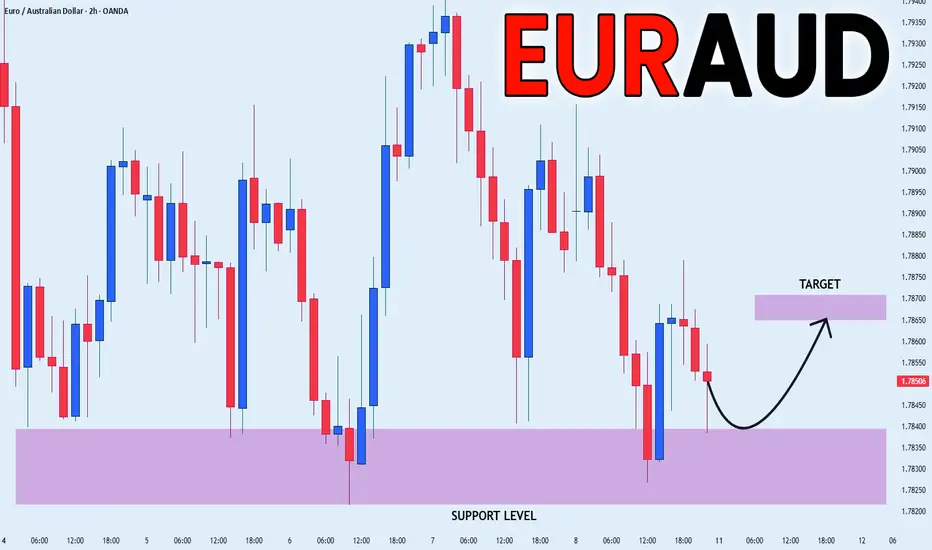
EUR_AUD LOCAL LONG|
✅EUR_AUD is going down now
But a strong support level is ahead at 1.7820
Thus I am expecting a rebound
And a move up towards the target of 1.7865
LONG🚀
✅Like and subscribe to never miss a new idea!✅
Community ideas
Gold prices are expected to break through $3,500 next week.Gold prices are expected to break through $3,500 next week.
Here are my latest political takeaways on gold.
1: The market currently sees a 92% chance of a Federal Reserve rate cut in September.
If next week's US July CPI data (expected to be released on August 12) falls short of expectations, it could further reinforce expectations of a rate cut, which would be bullish for gold.
If the data is stronger than expected, it could temporarily put pressure on gold prices.
2: Recently, Fed officials such as Cook and Daly have adopted dovish stances, highlighting labor market weakness and inflation risks. The market will closely monitor their subsequent comments.
3: US tariff policy interruptions
The Trump administration announced tariffs on imported 1 kg and 100 ounce gold bars, primarily targeting refining centers like Switzerland. This could tighten US gold supply and push up futures premiums (New York gold futures briefly traded over $100 above spot).
4: If tariff policies are further clarified or expanded (for example, to include 400-ounce gold bars), this could exacerbate market volatility and strengthen gold's safe-haven properties.
5: Global Central Bank Gold Purchase Trends
The People's Bank of China has increased its gold holdings for nine consecutive months (adding another 60,000 ounces in July), and over 90% of global central banks plan to continue increasing their holdings over the next 12 months, providing long-term support for gold prices.
6: If other central banks (such as India and Russia) announce new gold purchase plans, this could boost market sentiment.
7: Geopolitical Risks
US-Russia Relations: If the US-Russia summit goes poorly, it could exacerbate risk aversion.
Middle East Situation: Any rumors of escalating conflict or supply disruptions could be bullish for gold.
8: If the spread between New York gold futures and spot prices continues to widen (currently at a premium of approximately $100), it could trigger carry trades or delivery pressure.
Changes in COMEX inventories warrant attention.
Technical Analysis:
Key Price Levels
Resistance:
$3400-3408 / $3438-3450 / $3500.
Support:
$3380-3385 / $3370 / $3350.
Daily Chart:
Gold is consolidating in an ascending triangle pattern.
If it breaks above $3400, it could test the $3438-3450 area.
If it falls back, watch the $3380 support level.
Trading Strategy for Next Week:
Short-term intraday strategy:
If gold holds above $3400, continue buying with a target of $3438-3450.
If it falls below $3380, it could fall to the $3350-3370 area.
Band layout: layout on dips, stop loss reference $3350, target $3500-3631

EUR-GBP Potential Long! Buy!
Hello,Traders!
EUR-GBP keeps falling down
Towards the horizontal support
Level of 0.8650 and after the
Retest we will be expecting
A local bullish rebound
Buy!
Comment and subscribe to help us grow!
Check out other forecasts below too!
Disclosure: I am part of Trade Nation's Influencer program and receive a monthly fee for using their TradingView charts in my analysis.

$well riding the trend line, looking for a bounceWe'll see how this plays out over the next 60 to 80 Days!

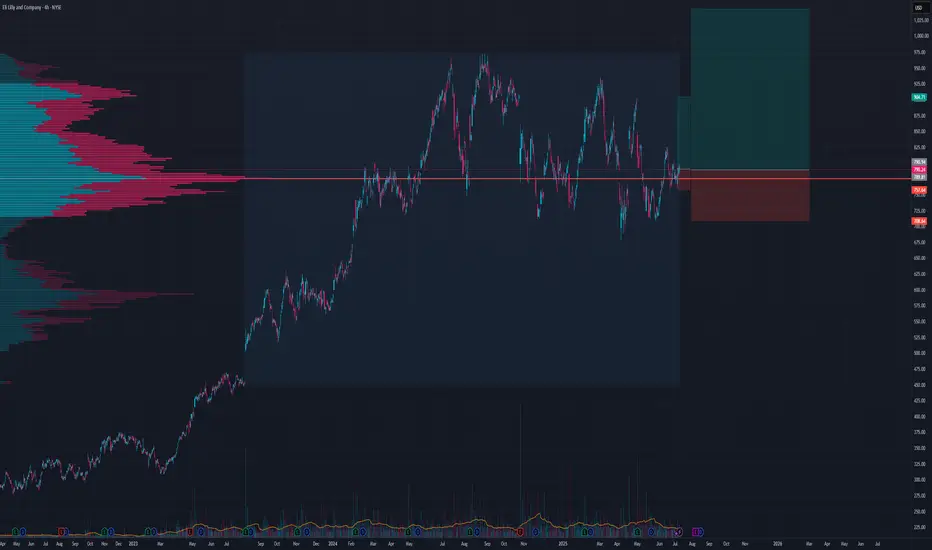
Long Healthcare and BiotechI think we will go for all time highs soon
TP 1 over 900
Got 2 stop losses on chart depending on time horizon and risk apatite
16 Year Cycle looks completeYou can refer to my chart linked below (about the "Summer Rally"), which did indeed happen.
I was skeptical the Summer Rally would actually happen, as it was a bit predictable, but there we go.
Distribution is also being seen on lower time frames.

Proprietary SupportIn this slowly but continuously updating idea I will be posting an interesting way to analyze charts. It is something old but also new, like duality.
We all know that the stock market continuously grows.
But it doesn't always grow.
For markets lie between worlds.
The reasonable and the unreasonable.
The free choice and the illusion of free choice.
Let me explain...
In micro scale, we seem to believe that the markets follow the "support / resistance" rule.
An (over)simplification necessary for us to comprehend the infinities of the quantum world.
There are lots of stories told in the picture above...
- Prices are chaotic and completely incomprehensible.
- We have to smooth-out to get a clearer picture.
- Is Support / Resistance real or a result of crowd psychology?
- At what point horizontal action "ceases" to exist and "trend" takes over?
Either we call it a "power law" or a Lin-log regression, charts in macro scale seem to trend.
So prices sometimes move with one "law" (support) and sometimes with another (trend).
Do we remember / know what is the foundation of price movement?
A century ago, Wyckoff came up with his theory of accumulation and distribution.
We can safely say that his research was not a result of crowd psychology. He backtested countless price charts, in a period (1920s) when trading was purely psychological, with traders having little experience to modern ideas of "trend", "support" etc.
Just like the new modern technology design principles, ahem aapl, technological information lies inside bubbles. Transparent but distorted. Clear but fuzzy. Duality once again.
Modern trading is a self sustaining loop. The "freedom" of our actions is trapped inside a bubble. Most of us "trade" with similar strategies, and end up in the mass pool of barely-profitable-investors. Unconventional strategists like Hedge Funds must have "alien" technology to overcome such psychological traps.
Back to the main chart:
It is one attempt to bring a new dimension to chart analysis. To merge these two worlds of "support" and "trend". I cannot possibly reach the expertise of massive corporations, but I can bodge something out, and I did.
Price charts can be analyzed with unconventional / proprietary methods to conclude into the chart above. It is a little rough but bear with me. I had to perform complex calculations which I couldn't compile into a Pine Indicator. There is a reason that the top lines are not exactly straight. Their calculations depend on a blend between micro and macro movements.
A couple of interesting charts to conclude the first update of this idea:
BTC Daily
BTC Weekly
A Perfect Fractal.
I hate bubbles. Mental ones, Soapy ones, Stock ones and UI ones.
- An angry Father Grigori.

XRP - Wait for It!Hello TradingView Family / Fellow Traders. This is Richard, also known as theSignalyst.
📈XRP has been overall bullish trading within the rising wedge pattern marked in blue, and it is currently retesting the lower bound of the wedge.
Moreover, it is retesting a strong demand zone marked in orange.
🏹 The highlighted blue circle is a strong area to look for buy setups as it is the intersection of the orange demand zone and lower blue trendline acting as a non-horizontal support.
📚 As per my trading style:
As #XRP retests the blue circle zone, I will be looking for bullish reversal setups (like a double bottom pattern, trendline break , and so on...)
📚 Always follow your trading plan regarding entry, risk management, and trade management.
Good luck!
All Strategies Are Good; If Managed Properly!
~Richard Nasr

BTC/USD – Eyes on the Next Breakout BTC is holding strong bullish momentum above 116,660 📈. Liquidity is building, and a quick pullback into the OB buy zone could be the last chance before we push towards Day High (117,644) and beyond to the 118,800 supply zone.
💡 Smart money loves this setup: grab liquidity, load positions, and ride the breakout.
This is where the big moves happen — don’t blink or you’ll miss it.
🎯 Buy Zone: 116,660 – 116,000 OB
🎯 Targets: 117,644 / 118,800 OB
⚠️ Invalidation below 116,000
🔥 Get ready — the market’s about to move fast.

Xrp - This is the bullrun breakout!🔑Xrp ( CRYPTO:XRPUSD ) breaks the triangle now:
🔎Analysis summary:
After the recent bullish break and retest, Xrp managed to already rally another +100%. This is a clear indication that bulls are still totally in control of cryptos and especially Xrp. It all just comes down to the all time breakout, which will then lead to a final parabolic rally.
📝Levels to watch:
$3.0
SwingTraderPhil
SwingTrading.Simplified. | Investing.Simplified. | #LONGTERMVISION

LULU - Updated analysis and what to look out forWe have a pretty clear HTF zone to look out for below - $130-$160 - in which we will need to see how price holds up. I cannot imagine a drop below there - that would make this completely undervalued - and I will be looking for long trades when we arrive there and see the LTF algorithms playing out.
Until then,
Happy Trading :)

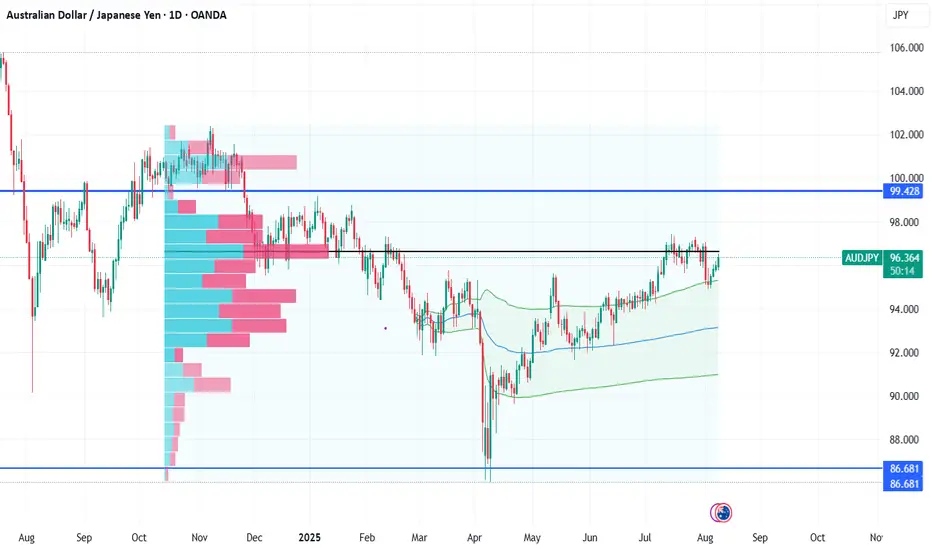
AUD/JPY Daily Chart📈 AUD/JPY Daily Chart
🛠 Tools Used:
🔹 Volume Profile (Visible Range) – to spot high-activity price zones.
🔹 Support & Resistance Lines – key zones at 99.428 🛑 and 86.681 🟢.
🔹 50, 100 & 200-Day SMAs – to track trend direction and dynamic support.
📊 Market Snapshot:
AUD/JPY is currently at 96.364, showing steady bullish momentum 📈 after bouncing from the 50-day SMA.
The Volume Profile reveals a large cluster of trading activity between 95.00 – 97.50, making this the current value area.
⚠️ Key Zones to Watch:
Resistance: 97.50 → 99.428 (Major hurdle 🚧)
Support: 94.50 → 92.00 → 86.681 (Long-term floor)
💡 Trade Idea:
✅ Bullish scenario: Break & close above 97.50 could trigger a rally towards 99.40.
❌ Bearish scenario: Drop below 94.50 could invite sellers back to test 92.00 and possibly 86.68.
📌 Summary:
The bulls are in control, but the real test lies ahead at 99.428 – a zone where sellers historically step in. Watch price action closely near resistance for confirmation before entering a breakout trade.
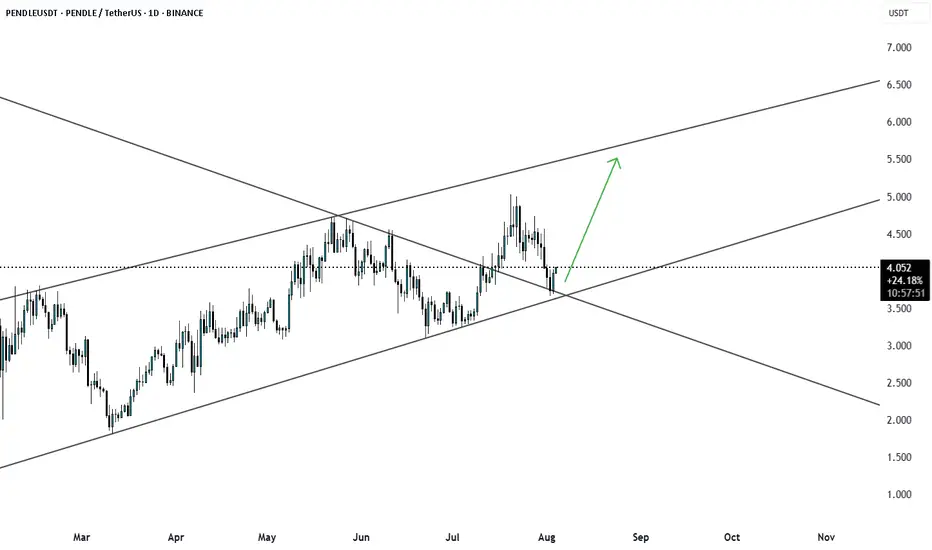
PENDLEUSDT at Channel SupportPENDLEUSDT is currently trading within an upward channel. Yesterday, the price pulled back to the channel support and formed a bullish engulfing candle, indicating potential continuation of the uptrend. A move toward the channel resistance appears likely.
A long trade can be considered with a stop-loss at 3.5.

Lower High Complete?OFC earnings provided buys a good level to pick up price but POC at 6375 was key.
The 4HR shows and englufing with LH partially complete.
Bias is Short!

Gold consolidates ahead of growthGold has encountered strong resistance and excessive pressure from bears. Before continuing its growth, the price may test the local trend support or the support zone of 3371–3358.
Scenario: bullish trend, but the price lacks the potential and consolidation to overcome resistance at 3400-3410. In this case, MM may form a trap to collect liquidity, such as a false breakdown of support, and only then move up.

AAPL LONGApple is breaking out, supported by bullish accumulation volume patterns indicating strong buying pressure. Key bullish points:
$100B U.S. investment strengthens domestic operations and tariff protection.
Strategic supply chain shifts to U.S. and India reduce geopolitical risks.
Leading tech sector rally amid AI growth potential.
With momentum building, $275 is the next target.

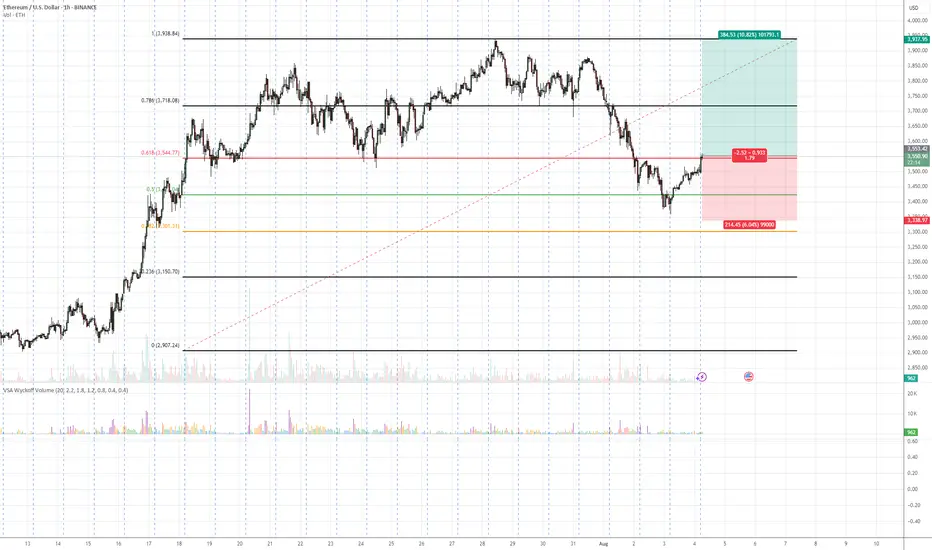
ETH/USDT – Bullish Reversal Potential from Fibonacci Confluence 💡 Idea:
Ethereum is showing signs of demand absorption at a critical Fibonacci support cluster (0.5 – 0.618 retracement). VSA patterns confirm that selling pressure is being absorbed, hinting at a possible markup toward previous swing highs.
📍 Trade Setup:
Entry: Current levels near 3,551
Target: 3,937 (+10.82%)
Stop Loss: 3,338 (below last absorption zone)
R:R Ratio: ~1.79:1
📊 Technical Reasoning (VSA)
1. Stopping Volume at Fibonacci Support
ETH tested the 0.5–0.618 retracement zone from its prior bullish impulse.
Wide spread down-bars on high volume failed to produce significant downside progress, signaling professional buying.
2. No Supply Confirmation
Following the stopping volume, the market printed narrow range candles on decreasing volume, indicating supply exhaustion.
3. Demand Emergence
The recent push above short-term resistance came with increasing volume and wider up-bar spreads, suggesting the start of an accumulation-to-markup transition.
4. Structure & Fibonacci Confluence
Current rally aligns with the Fibonacci golden zone and past structural support.
📌 Trading Plan:
Enter on confirmed breakout above minor resistance with volume expansion.
Scale out partial profits near 3,800 and let remainder ride toward 3,937.
Keep stop below 3,338 to avoid being shaken out by false breakouts.
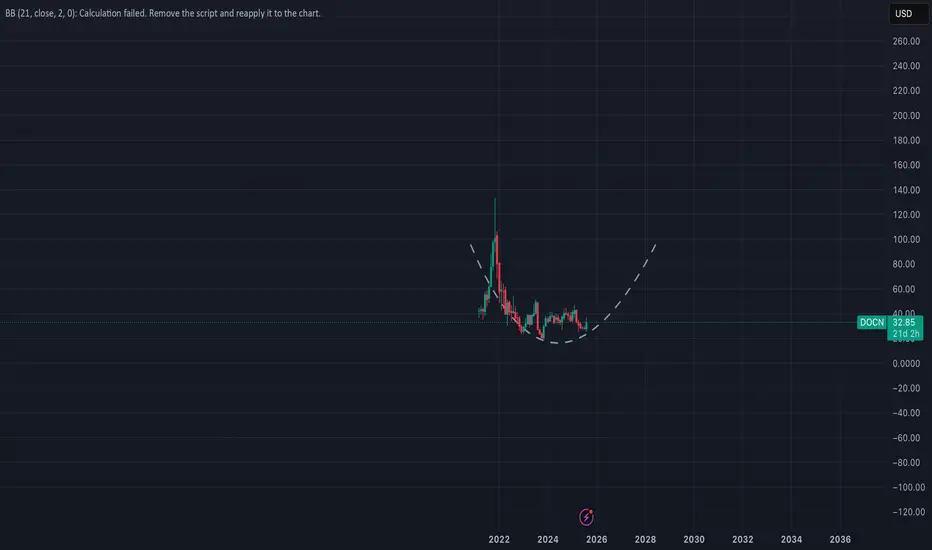
Potential rounded bottom or C&H early formationConsolidated for multiple quarters and seems to have formed a strong base..Rounding bottom in formation?
on watch for now:
Ethereum’s Rise in Market Dominance – The Queen’s Mov👑♟ Ethereum’s Rise in Market Dominance – The Queen’s Move 📈🔥
Most of the time, traders focus on Bitcoin dominance as the leading gauge of crypto market capital flow. But right now, it’s Ethereum’s turn to shine — the Queen of crypto is starting to dominate the board.
Ethereum dominance has surged from the 7.18% lows, reclaiming the 0.618 Fibonacci retracement zone, and is now holding strong near 12.73%. This bounce comes after years inside a large descending channel, where past peaks hit 30.73% in 2018 and 22.58% in 2022.
With the next key target sitting at 18.29%, ETH dominance is flashing early signs of a potential market shift. If the Queen breaks past the upper channel resistance around 20.32%, we could see a historic run toward the 30–37% dominance range.
🔑 Key insights:
Bounce from major long-term channel support
0.618 Fib level reclaimed — bullish technical signal
Room to climb before meeting the upper trendline resistance
Breakout could mark a major power shift in crypto market share
If Bitcoin is the King, Ethereum is proving once again why she’s the Queen — strategic, resilient, and ready to take more of the board.
One Love,
The FXPROFESSOR 💙
Disclosure: I am happy to be part of the Trade Nation's Influencer program and receive a monthly fee for using their TradingView charts in my analysis. Awesome broker, where the trader really comes first! 🌟🤝📈

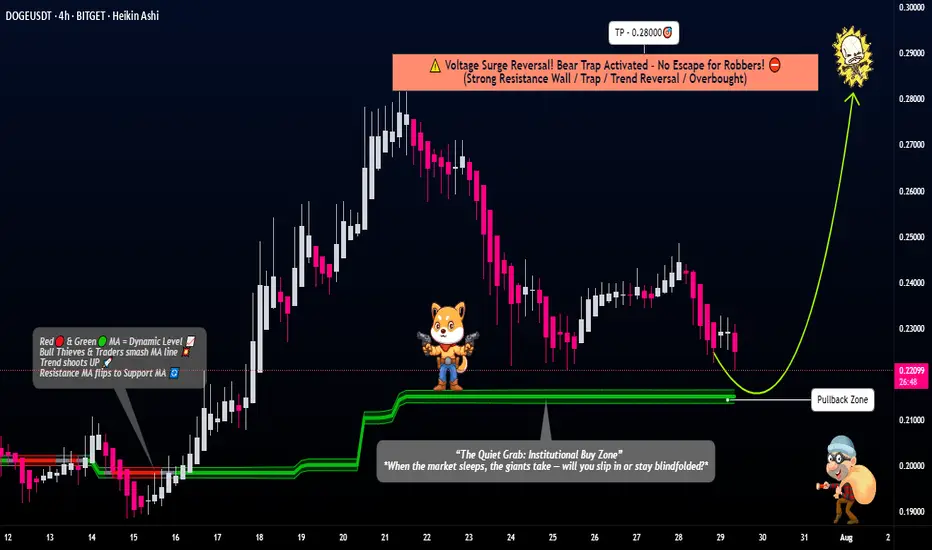
Thief Strategy Unlocked: DOGE/USDT Swing Robbery🐕💸 "DogeCoin Heist Plan: Swipe the Vault Before the Bark Bites!" 💥🔐
🌍 Hi! Hola! Ola! Bonjour! Hallo! Marhaba! 🌍
🎩 Welcome back, Money Makers & Market Robbers! 🏴☠️
💥 This is your DOGE/USDT (Dogecoin vs Tether) Crypto Market Heist Plan – fully loaded with Thief Trading Style tactics combining technical firepower 🔥 and macro intel 📊 for a high-voltage entry!
💣 Plan of Attack: The Robbery Blueprint 📈
🎯 Entry Point:
🟢 The vault's wide open! Enter LONG at any price—pullback is your sneak path in.
Set your BUY LIMIT orders using 15m or 30m timeframes at the recent swing zones.
Layer them like a pro 💹 with DCA (Dollar Cost Averaging) precision.
🛑 Stop Loss (SL):
👂 "Listen up!" Don’t slap a stop loss before the pullback confirms—it’s like triggering the alarm too early!
📍 Thief's SL placed only after pullback occurs—use the 4H swing low around 0.19000.
✍️ Adjust SL based on your risk appetite, lot size, and number of entries.
🏁 Target Zone:
🎯 Aim for 0.28000, or make a stealthy exit before the escape door shuts.
💰 Special Note for Scalpers:
Only go LONG—this market’s barking up, not down!
Big pockets? Straight in.
Smaller stack? Join the swing crew and rob with patience.
Use a trailing SL to secure the loot 🏆.
📊 Market Overview:
Currently bullish bias due to:
Macro inflows
Risk sentiment shift
Volume surge
On-chain support
Check 📡: Fundamentals | COT | Intermarket | Sentiment | Price Action.
⚠️ Heist Hazard - News Alert:
📰 Don’t enter new positions around high-impact news.
Set trailing SLs to guard your open trades during these volatile spikes.
💖💬 Robbers' Call to Action:
💥 Hit that BOOST Button on the idea 💥
Not just for likes—it fuels our squad’s energy and signals more Thief Heist Plans are coming 🐱👤💸
Let’s rob these charts—strategically, smartly, & silently.
📌 Stay Tuned for more explosive trade setups from the vault of Thief Trader.
🤑🛸 Trade smart. Trade bold. Trade like a Thief.
“COFFEE CFD Smash-and-Grab: Thieves’ Swing Trade Blueprint!"🚨☕ The Great "COFFEE" Market Heist 🚨💰
🌟Hi! Hola! Ola! Bonjour! Hallo! Marhaba!🌟
⚔️Dear Money Makers & Robbers, 🤑💸✈️
Get ready for the ultimate COFFEE Commodities CFD Market Heist! Based on our 🔥Thief Trading Style combining technical and fundamental analysis, here’s our master plan to snatch profits from the market vault.
💥 The Master Plan:
📉 Entry:
“The vault is wide open! Swipe the bearish loot at any price—our heist is on!”
💸 Use sell limit orders on the 15- or 30-minute timeframe, at the nearest swing high or low levels to lock in the perfect robbery spot. Thief (I"AM) using multiple limit orders (DCA / layering strategy style method of entries).
🛑 Stop Loss:
📌 Set your Thief SL at the nearest or swing high level of candle wick on the 4H timeframe (~313.00) to keep your loot safe.
📌 Adjust SL based on your trade risk, lot size, and multiple entry plan—don’t let the cops catch you!
🎯 Target:
Aim for 260.00 or escape before the target—take the loot and run!
👀 Scalpers’ Tip:
Only scalp on the Short Side! If you’ve got deep pockets, jump in big; otherwise, join swing traders to ride the heist. Use trailing SL to protect your loot.
💣 Market Vibes:
The “COFFEE” CFD market is trapped in bearish territory, fueled by:
🔎 Risky levels
🔎 Oversold zones
🔎 Consolidation
🔎 Trend reversal
🔎 Traps near levels where bullish robbers get strong.
📰🗞️ The Big Picture:
Check out the Fundamentals, Macro, COT Report, Quantitative Analysis, Sentimental Outlook, Intermarket Analysis, and Future Trend Targets to stay one step ahead! 👉👉👉
⚠️ Trading Alert:
News releases can rock the market vault!
🚨 Avoid new trades during big news
🚨 Use trailing SL to lock profits and guard your loot.
💥 Hit the Boost Button!
Supporting our Robbery Plan helps us all steal money with ease! 💰💵 Boost our robbery team’s strength, and trade with the Thief Trading Style to cash in every day. 💪🏆🤝🚀🎉
Stay tuned for our next heist plan—until then, keep those profits safe and stay sharp! 🤑🐱👤🤩

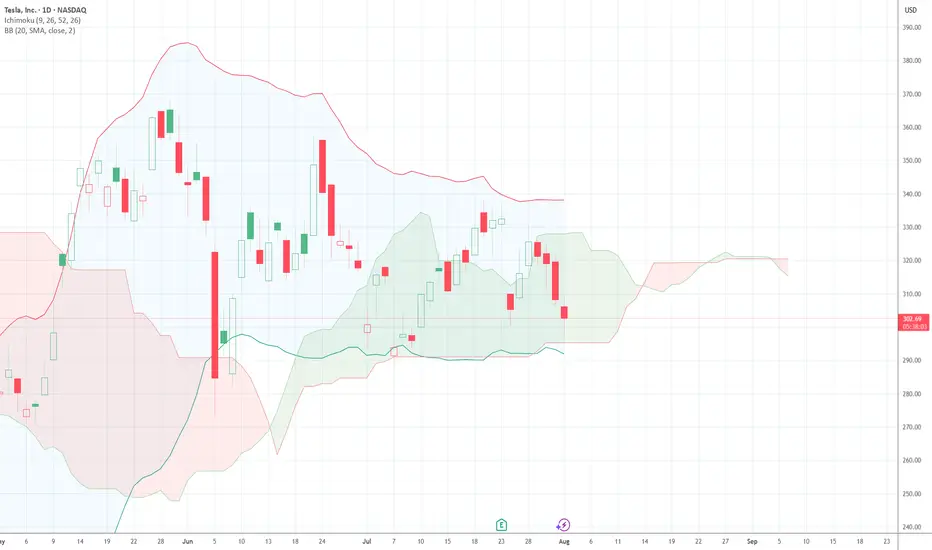
$TSLA 3rd Time's a CharmI bottom called NASDAQ:TSLA twice in a row. About to do it a third time today. 312.5C 8/8 @ 4.47 were just bought for $1.3 million.