NASDAQ Bulls Pushing – Will 20,347 Hold or Break?Price is currently approaching the 20,347 🔼 resistance zone after a strong bullish rally from the 19,150 🔽 support level. The market structure remains bullish with consistent higher highs and higher lows, showing strong buyer momentum.
Support at: 19,670 🔽, 19,150 🔽, 18,500 🔽, 17,600 🔽
Resistance at: 20,347 🔼, 20,600 🔼, 21,000 🔼
Bias:
🔼 Bullish: If price breaks and holds above 20,347 🔼, we could see a continuation toward 20,600 and 21,000.
🔽 Bearish: A strong rejection from 20,347 🔼 could send price back down toward 19,670 and 19,150 for a retest.
📛 Disclaimer: This is not financial advice. Trade at your own risk.
Community ideas

BTCUSD +$500 in the next few candles/sessionsBitcoin (BTCUSD) is showing strong bullish momentum, and current price action indicates a potential move upward by the next $500 in the short term.

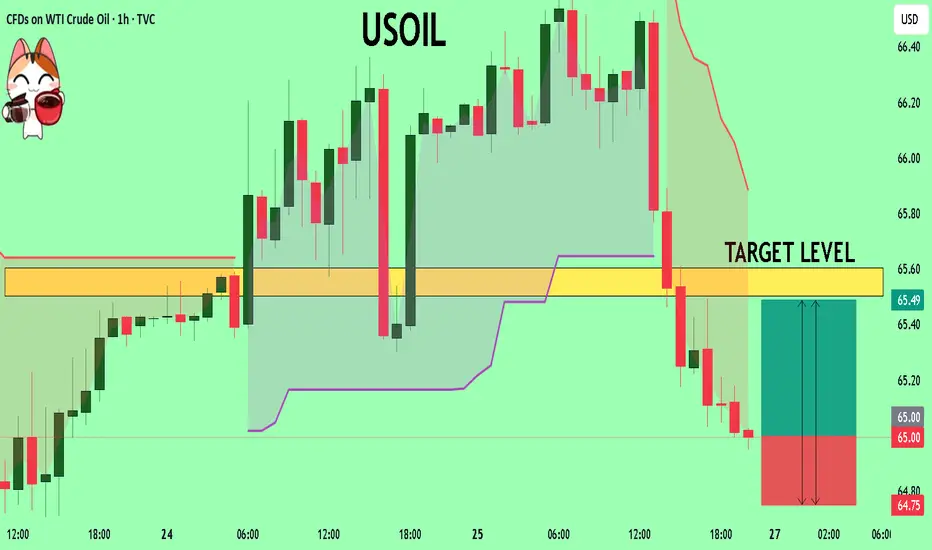
USOIL My Opinion! BUY!
My dear friends,
Please, find my technical outlook for USOIL below:
The instrument tests an important psychological level 65.00
Bias - Bullish
Technical Indicators: Supper Trend gives a precise Bullish signal, while Pivot Point HL predicts price changes and potential reversals in the market.
Target - 65.50
Recommended Stop Loss - 64.75
About Used Indicators:
Super-trend indicator is more useful in trending markets where there are clear uptrends and downtrends in price.
Disclosure: I am part of Trade Nation's Influencer program and receive a monthly fee for using their TradingView charts in my analysis.
———————————
WISH YOU ALL LUCK
US Equities Index – Retesting Breakout Zone After Strong RallyUS Equities Index recently broke through the 4,760.00 resistance zone with strength, but price is now pulling back slightly, possibly retesting this level as new support. The projected upside targets the 4,876.76 zone, which remains the next key resistance.
Support at: 4,760.00 🔽 | 4,650.00 🔽
Resistance at: 4,876.76 🔼
🔎 Bias:
🔼 Bullish: Holding above 4,760.00 confirms breakout structure with potential continuation toward 4,876.76.
🔽 Bearish: A breakdown back below 4,760.00 could shift bias short-term toward 4,650.00 and 4,555.95.
📛 Disclaimer: This is not financial advice. Trade at your own risk.

ICL on the Daily TFScrip is currently at around 87. Took a correction of 0.382 Fib level and moving up and there is a potential Bearish ABCD Reversal pattern Point D at around 109-110.lets c how it plays further, hopefully InSha Allah.

#KDA/USDT Stay Adaptive ?#KDA
The price is moving within a descending channel on the 1-hour frame, adhering well to it, and is on its way to breaking it strongly upwards and retesting it.
We have a bounce from the lower boundary of the descending channel. This support is at 0.4260.
We have a downtrend on the RSI indicator that is about to be broken and retested, supporting the upside.
There is a major support area in green at 0.4186, which represents a strong basis for the upside.
Don't forget a simple thing: ease and capital.
When you reach the first target, save some money and then change your stop-loss order to an entry order.
For inquiries, please leave a comment.
We have a trend to hold above the 100 Moving Average.
Entry price: 0.4530
First target: 0.4625
Second target: 0.4754
Third target: 0.4932
Don't forget a simple thing: ease and capital.
When you reach the first target, save some money and then change your stop-loss order to an entry order.
For inquiries, please leave a comment.
Thank you.

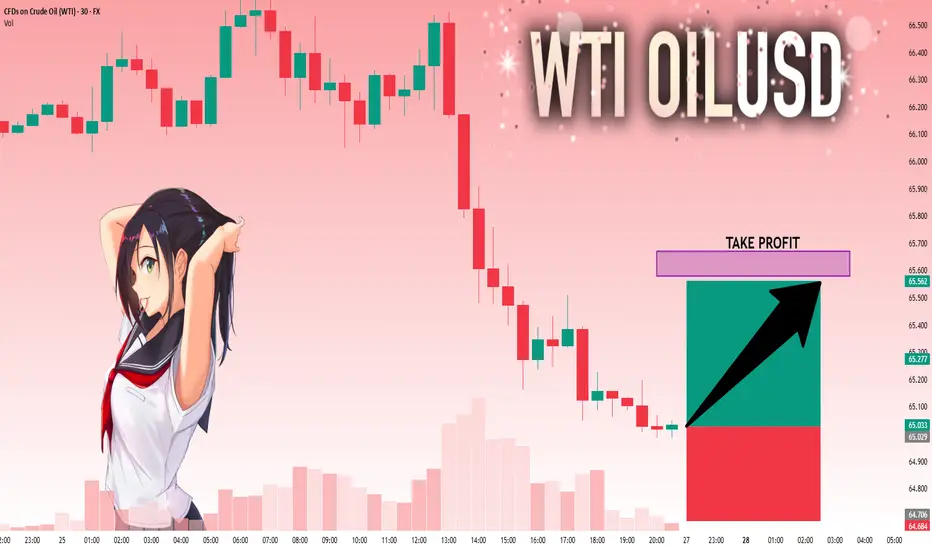
USOIL: Next Move Is Up! Long!
My dear friends,
Today we will analyse USOIL together☺️
The market is at an inflection zone and price has now reached an area around 65.029 where previous reversals or breakouts have occurred.And a price reaction that we are seeing on multiple timeframes here could signal the next move up so we can enter on confirmation, and target the next key level of 65.579.Stop-loss is recommended beyond the inflection zone.
❤️Sending you lots of Love and Hugs❤️
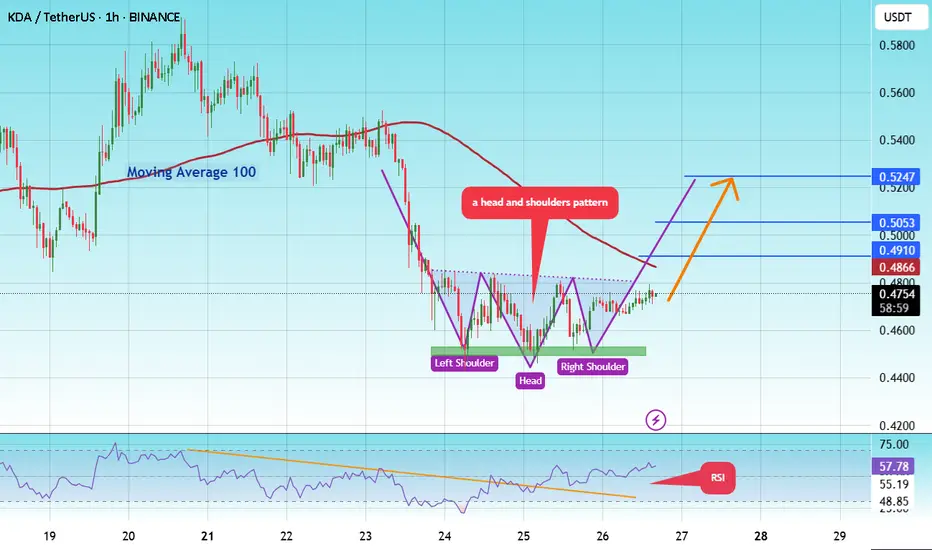
#KDA/USDT Stay Adaptive ! #KDA
The price is moving in a head and shoulders pattern on the 1-hour frame and is expected to break and continue higher.
We have a trend to stabilize above the 100 moving average once again.
We have a bearish trend on the RSI indicator, supporting the upward move with a break above it.
We have a support area at the lower boundary of the head and shoulders at 0.4545, acting as strong support from which the price can rebound.
We have a major support area in green that pushed the price higher at 0.4490.
Entry price: 0.4747
First target: 0.4910
Second target: 0.5053
Third target: 0.5247
To manage risk, don't forget stop loss and capital management.
When you reach the first target, save some profits and then change your stop order to an entry order.
For inquiries, please comment.
Thank you.
Watch CRTM 233% or 1.691M additional vol got injected on last trading session. Total day end volumes are more than 2x of the Avg Vol 10 days. One Bullish GAP Mitigated marked in GREEN.
Can or may be watched.

NG1!: Target Is Up! Long!
My dear friends,
Today we will analyse NG1! together☺️
The price is near a wide key level
and the pair is approaching a significant decision level of 3.087 Therefore, a strong bullish reaction here could determine the next move up.We will watch for a confirmation candle, and then target the next key level of 3.107.Recommend Stop-loss is beyond the current level.
❤️Sending you lots of Love and Hugs❤️

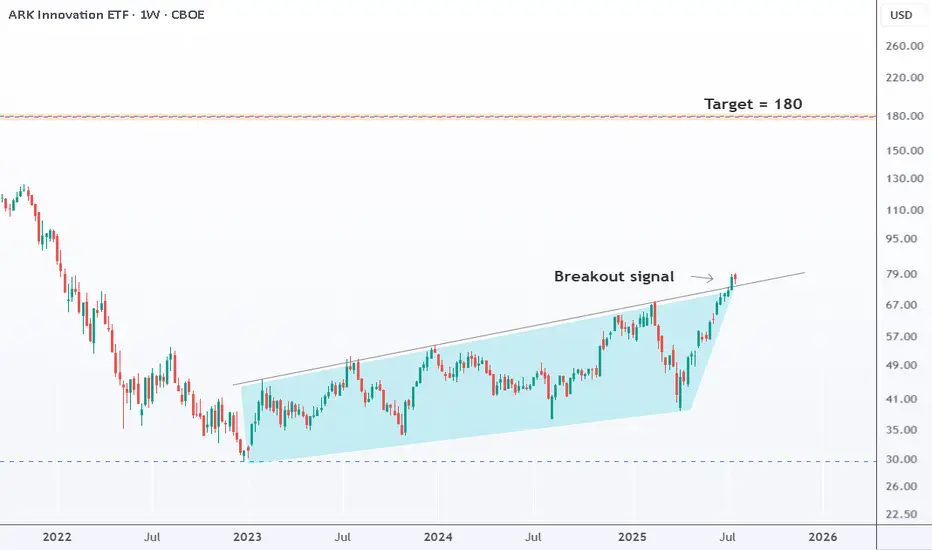
ARKK looks like it's breaking outARKK is signaling a breakout, with price likely to push higher toward the 180 target. The pattern looks strong. The only sign that would invalidate the breakout is a drop below 72. unless that happens, the bullish view remains.
NI225: Move Down Expected! Short!
My dear friends,
Today we will analyse NI225 together☺️
The recent price action suggests a shift in mid-term momentum. A break below the current local range around 41,456.23 will confirm the new direction downwards with the target being the next key level of 40,954.70 and a reconvened placement of a stop-loss beyond the range.
❤️Sending you lots of Love and Hugs❤️

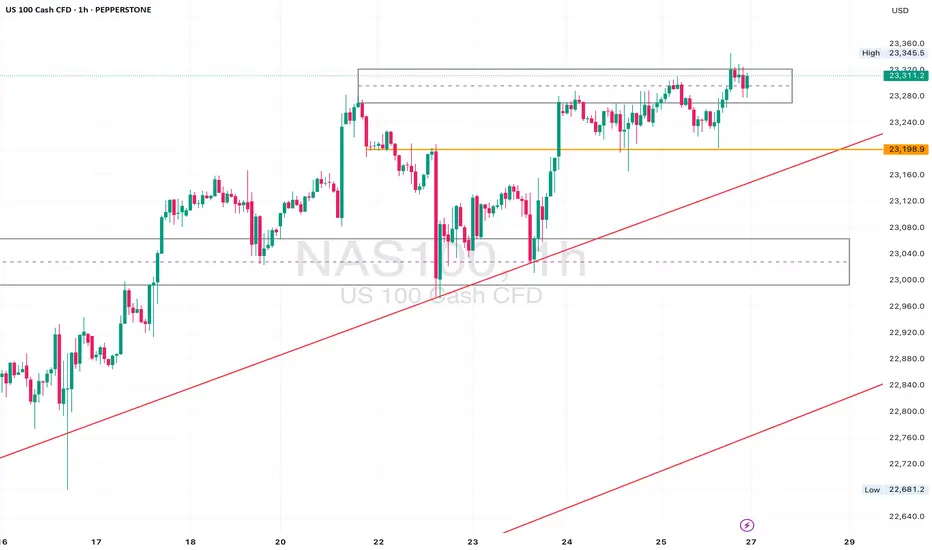
NAS100 Retesting Breakout – Eyes on 23170 for Bullish PushDaily Analysis:
Price is testing the upper boundary of the long-term ascending channel. Structure is still bullish with no major breaks of support. If momentum holds, we could extend toward the channel top.
4H Analysis:
Retesting breakout structure. Support is forming around 23000–23050. Bullish momentum remains valid unless price closes below this zone.
1H Analysis:
Micro-breakout confirmed with bullish impulse above 23120. If 23170 holds, continuation toward 23280–23320 is likely.
Confirmation & Entry:
Watch for continuation above 23170. SL below 23080. TP: 23280+
Use caution if 23000 breaks — this would weaken short-term bias.
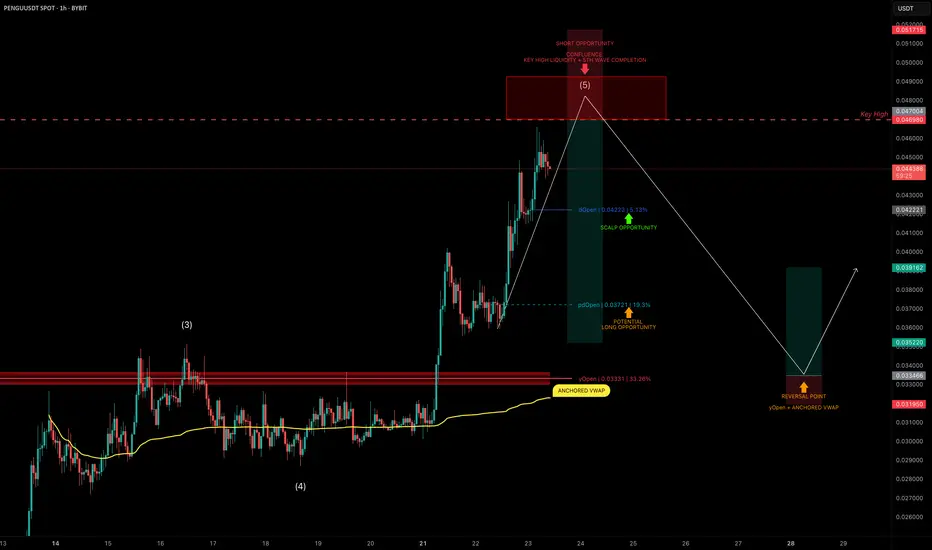
PENGU Topping Out? Targeting 30% Downside After Liquidity SweepPENGU has had an explosive run, but it now looks to be nearing completion of wave 5 of its current Elliott impulse.
We’re approaching a key high at $0.04698, a likely liquidity grab zone — and potentially a great area to position for a short trade.
🧩 Short Setup Overview
➡️ Wave 5 Completion Incoming:
Price is showing signs of exhaustion as it approaches $0.04698, where liquidity is likely stacked above the previous high.
➡️ SFP Trigger Zone:
Watch for a swing failure pattern (SFP) at $0.04698 — confirmation for a potential short entry.
➡️ Psychological Resistance:
The $0.05 level also sits just above — a classic psychological barrier that may get tapped or wicked into.
🔴 Short Trade Setup
Entry: After a confirmed SFP at $0.04698–$0.05
Target (TP): Yearly Open (yOpen) — potential move of ~30%
Stop-loss: Above post-SFP high
R:R: Excellent asymmetry if setup confirms
🛠 Indicator Note
In this analysis I'm using my own indicator called "DriftLine - Pivot Open Zones ", which I recently published.
✅ It helps highlight key open levels, support/resistance zones, and price structure shifts — all critical for confluence-based trade planning.
Feel free to check it out — you can use it for free by heading to my profile under the “Scripts” tab.
💡 Educational Insight: How to Trade Wave 5 Liquidity Sweeps
Wave 5 tops often trap late longs, especially when paired with psychological levels and key highs.
➡️ Patience is key — wait for a rejection pattern or SFP before entering.
➡️ Liquidity sweeps first — then the move.
Final Thoughts
PENGU is pushing toward $0.04698–$0.05, but this may be its final move up before correction.
With the yearly open as a logical target, and clear confluence via DriftLine, this setup offers a clean short opportunity — if confirmation comes.
Stay sharp, let price lead, and trade the reaction — not the prediction.
_________________________________
💬 If you found this helpful, drop a like and comment!
Want breakdowns of other charts? Leave your requests below.
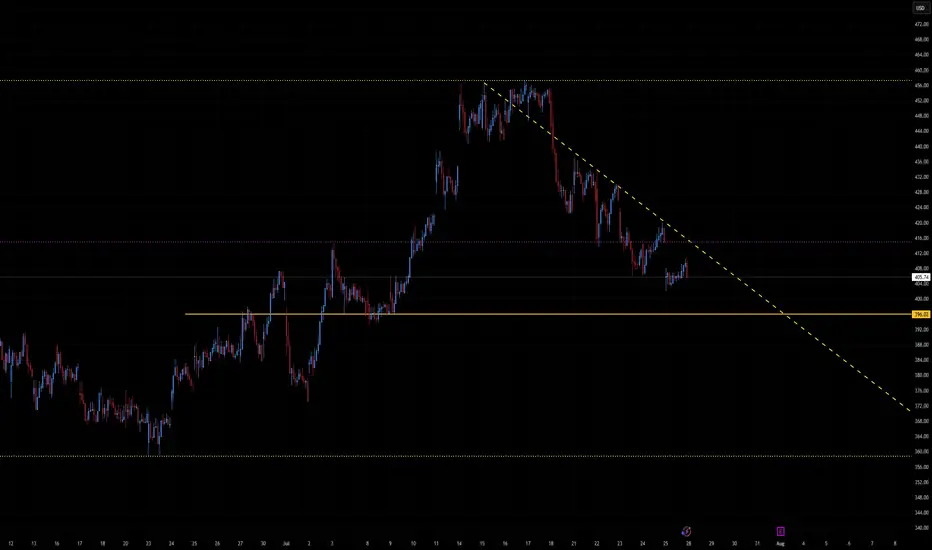
MSTR - Where it goes only BTC knows📊 MSTR – MicroStrategy Technical & Bitcoin Correlation
Ticker: MSTR | Sector: Bitcoin Treasury Proxy / Enterprise Software
Date: July 26, 2025
Current MSTR Price: ~$405.89
Current Bitcoin Price: ~$118,127
🔍 Chart & Price Structure
Recent Action: MSTR declined from the ~$430–450 range and has consolidated around the $405 level, forming a tight base.
Support Zone: $395–$400 — prior volume cluster, recent dip buyers stepped in.
Weak Resistance: $415–$420 — a shallow supply zone; bigger resistance lies at ~$430.
Volume & Candles: Mixed volume, with small-bodied candles showing indecision near $405. Buyers are attempting to hold.
📈 Bitcoin Outlook & Influence
MicroStrategy remains tethered to Bitcoin’s trajectory. Recent BTC consolidation around $118K closely influences MSTR sentiment.
BTC Projections
From Citi (Jul 25):
Base Case: $135K by year-end
Bull Case: $199K
Bear Case: $64K if equities falter or ETF flows wane
Other Views:
Hashdex sees BTC reaching up to $140K in 2025
Omni Ekonomi
Global X ETF-based models anticipate $200K within 12 months
The Australian
Kiyosaki warns of potential crash despite optimism
These imply a possible 25–70% upside in BTC, which could drive MSTR toward $500–$600+ if holdings are stable.
⏱️ Short-Term Outlook (1–2 Weeks)
✅ Bullish Scenario
Trigger: Hold above support at $400, reclaim $415–$420
Immediate Upside Targets:
First: $430
Break above $430 → $450
Drivers: Bitcoin breaking back above recent highs, ETF inflows, favorable regulatory headlines
❌ Bearish Scenario
Trigger: Break below $395
Downside Targets:
$380 → $360 → $350
Drivers: BTC weakness → below $110K, altcoin rotation, broader equity weakness
🔭 Long-Term Outlook (H2 2025 / beyond)
🚀 Bull Case
If Bitcoin reaches $135K–$200K (Citi bull case, institutional demand, ETF momentum), MSTR could rally alongside to $550–$650.
MicroStrategy’s business fundamentals (data analytics/AI) may contribute optionality beyond BTC.
🐻 Bear Case
If Bitcoin retraces toward $64K or below due to risk-off sentiment or regulatory changes, MSTR could fall back toward $300–$350.
📊 Summary Table
View Trigger Level Targets Bitcoin Scenario Confidence
Short-Term Bull Above $405 and reclaim $415–420 $430 → $450 BTC > $118K and flat-to-up Moderate
Short-Term Bear Below $395 $380 → $360 → $350 BTC dips < $115K Moderate
Long-Term Bull BTC to $135K–$200K $550 → $600+ ETF inflows + adoption acceleration High (if BTC strength)
Long-Term Bear BTC drops below $110K $350 → $300 Sentiment collapse or regulation Moderate
🧠 Conclusion
MicroStrategy’s stock remains inherently tethered to Bitcoin performance. The $395–$405 zone acts as critical support, while a push above $415–$430 could signal renewed upside. Longer-term, BTC strength into the $135K–200K range would propel MSTR toward $600+ levels; a BTC pullback could drag it toward $300 or lower.
Watch Bitcoin flows, ETF updates, and pillar crypto adoption trends—these are likely to dictate MSTR’s next leg.
XAUUSD: Bearish Bias SetupI am watching for a possible reversal in XAUUSD, predicting a rejection with a downside target around 3.300.
This downside target is reasonable based on this setup, as it is based on a previous bullish move, from which price could find support and bounce, or break below, and the downside momentum could start to continue down.
I am just sharing my thoughts on the chart, this is not financial advice. Always confirm your setup and manage your risk accordingly.

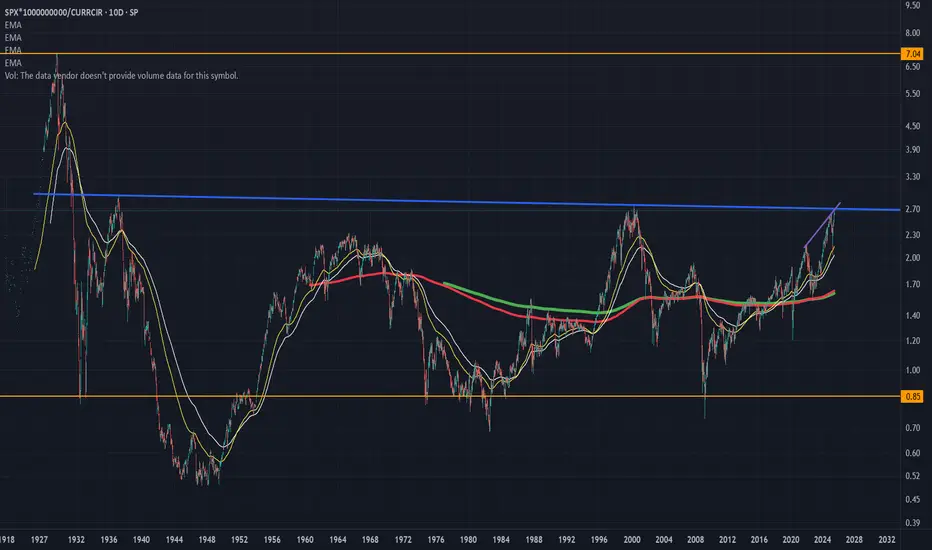
Entire S and P history in one chart. Approaching a neck-snapper!Here is a chart of the entire S and P history versus total currency in circulation.
This gives bubble periods (anytime the value is over 2) and times when the market crashed after being in a bubble.
If you notice we are fast approaching the line that broke the neck of the market in the 60s and 2000 dotcom bust.
If we clear that line, hold on to your hats because we are going into full blown speculative mania like just before the Great Depression!
In fact maybe the AI-crypto bubble will be exactly like the Great Depression, AI causing mass unemployment and global poverty.
Structural and Technical Analysis of Crypto + BTC + Altcoins + TStructural and Technical Analysis of Crypto + BTC + Altcoins + Totals + Dominance
🔔 Follow me & smash that rocket 🚀 if you find this useful! Let's ride the next wave together!
🕒 Timeframe: 4H
🧠 Strategy: Customized Dow Theory + Structural
---
🟡 A critical moment for the market:
Many coins, including top 10 alts, are currently sitting on major key levels. Yes, you can go long — but only IF volume supports the move.
📈 That means we must keep an eye on:
TOTAL, TOTAL2, TOTAL3
BTC.D, USDT.D
---
💎 Bullish Trigger Conditions:
✅ BTC.D must show strong red candles (dominance falling)
✅ USDT.D must break below 4.22-4.23 (money flowing out of stablecoins)
✅ TOTAL must break 3.85T
✅ TOTAL2 must break 1.48T
✅ TOTAL3 must break 1.05T
🔴 If all these confirm, it could be a great trigger to enter alt positions.
---
🔍 BTC Outlook
As previously mentioned:
🟥 If sellers want BTC below $115K, they need to break it fast and sharp — slow breakdowns won’t work due to buyer activity.
🟨 Bullish trend requires a break above $120K.
📊 Most likely scenario? Ranging between $115K - $120K
⚠️ BTC Dominance plays a key role here. If dominance drops while BTC ranges, alts could explode.
---
💸 USDT.D Critical Level:
A clean breakdown of 4.23 on USDT.D = 🚀 Funds rotating into alts
---
✅ Coins To Watch (Long Setup Only IF Above Conditions Hold):
♦️BNB
enter:741.00
Sl: 786.13
♦️ETH
enter:3750
Sl: 3480
♦️SUI
enter:4.10
Sl:3.40
♦️XRP
enter:3.25
Sl:2.92
♦️LINK
enter: 18.60
Sl: 17.4
♦️AAVE
enter:295
Sl:276
♦️ADA
enter:0.8405
Sl: 0.7628
♦️SOL
enter: 192.40
Sl:177
♦️DOGE
enter:0.249
Sl:0.220
🔁 Note: First SUI trigger was 3.80 — next key level is 4.10.
---
⚠️ Important Notes:
Today is Saturday, expect low volume
Manage risk ⚠️ and avoid aggressive Martingale strategies
High chance of fake breakouts
Levels being tested might just be lower highs in a bearish structure
❗️Even for bearish continuation, volume increase is key
---
🟢 If you liked this post, don’t forget to Follow & Hit the 🚀 Rocket to stay updated on live setups and strategic insights!
XLM 300+ RRXLM ridiculous RRR. 3D timeframe HVF 1.618 fib at 4.40$. Could XLM rip up to XRP prices?? Smaller timeframe W pattern with a bullish three impulse flag on the 15m. Looking for a tight stop. MEGA MOVES (usually don't work) but lets see...
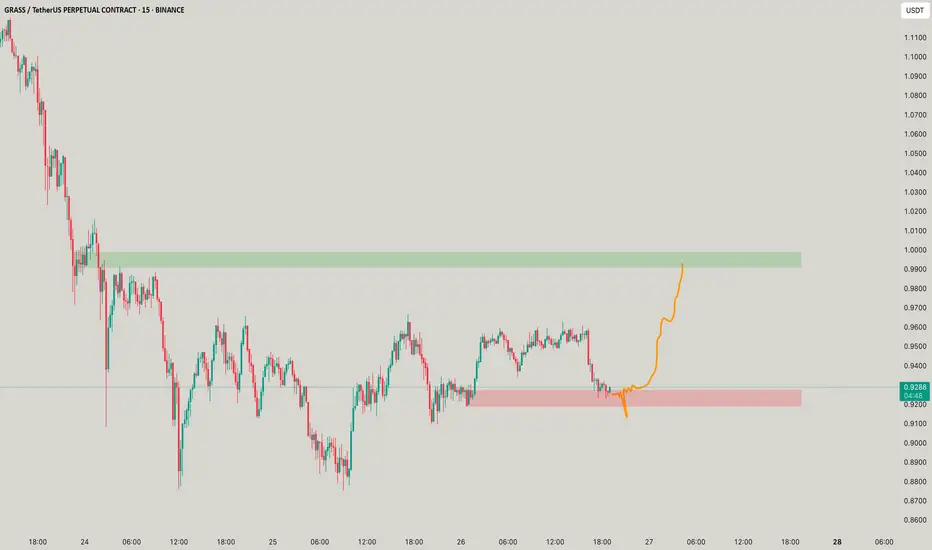
Are you cow to eat GRASS?GRASSUSDT looks a perfect trade, too perfect to be true! Just wait for the right buys!
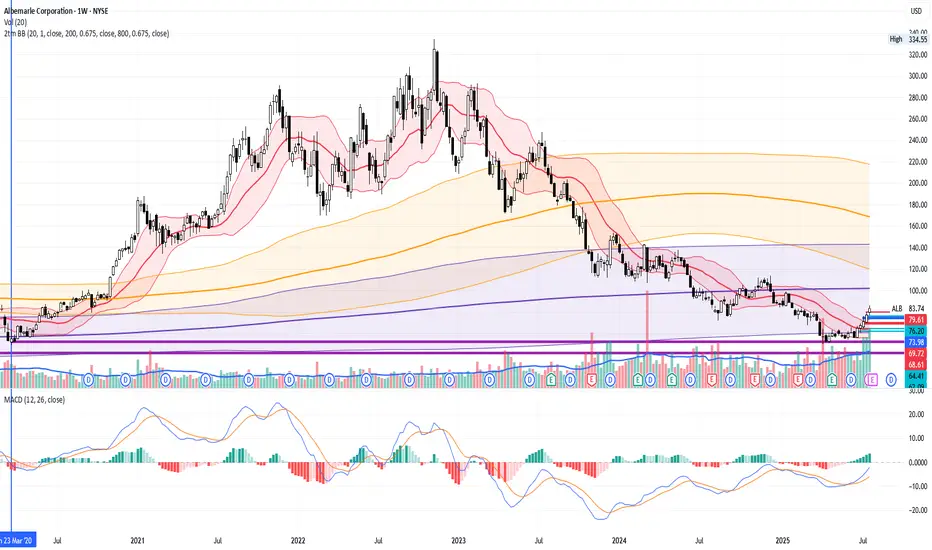
ALB Long, Resurrection of lithium trendALB have started to rise in recent weeks. It's price stays near 5-year lows.
Long-term Price Levels already have worked to bounce the stock by around 50%+.
Most likely funds have started to trade it in Mean Reversion strategies. So, the movement back to 200MA and 800MA on Weekly time-frame is quite possible.
As fast as banks would start to rise stock's rating - it will go sky high.
Recently UBS already cut it's rating to "Sell". Yet, trend already is mighty enough and just kept going higher.
Full margin on every black 1D candle!

GOLD gartely , XAUUSD ShortLooks like a perfect gartely pattern here on 4h frame , gold might go bearish to 3260
