EURJPYA sell signal has appeared on EURJPY. Traders should watch for confirmation to enter short positions in line with bearish momentum.
Community ideas

TSLA 1D Time frame Tesla (TSLA) Daily Snapshot
Current Price: $346.97
Change: +0.61% from the previous close
Intraday Range: Not specified
Trend: Bullish continuation
🔎 Key Levels
Resistance:
R1: $347.17 – $350.85 (short-term resistance zone)
R2: $360.56 – $362.90 (medium-term resistance zone)
Support:
S1: $324.94 – $330.14 (short-term support zone)
S2: $313.64 (trendline support)
S3: $302.62 (horizontal support)
📈 Technical Indicators
RSI (14): 57.10 — Neutral
MACD: 5.23 — Sell signal
Moving Averages:
5-day EMA: $339.84 — Buy
50-day SMA: $324.49 — Buy
200-day SMA: $330.33 — Buy
📌 Market Sentiment
Catalysts: Positive market sentiment, with TSLA outperforming key competitors in recent sessions.
Sector Performance: Tech sector showing strength, with TSLA leading gains among peers.
📅 Outlook
Bullish Scenario: A breakout above $347.17 could lead to a push toward $360.56–$362.90.
Bearish Scenario: A drop below $324.94–$330.14 may test support around $313.64.
Overall Bias: Moderately bullish, with positive momentum but facing near-term resistance.

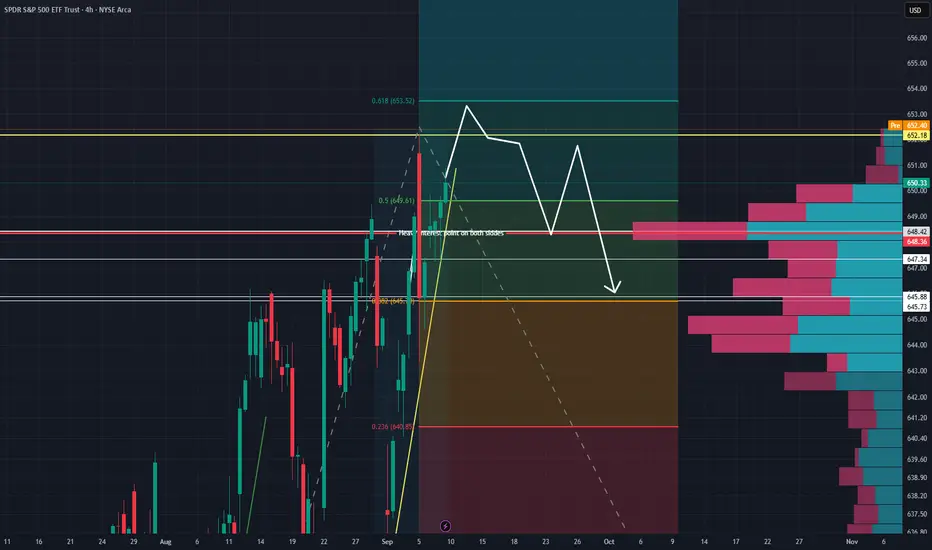
Impending bearish pushBear: looking at the adx indicator, we are very low on trend strength on the daily and 4h timeframe of AMEX:SPY . There is room for some more upside to possibly test ath around 652. I believe it will go up to test before it has a pullback again but that being said, adx is low, there are many touches of bearish divergence (lower rsi peaks : higher price points), and we have not seen much drastic big candles in a while. Its important to note that rate cuts are ALREADY priced in. We are forward looking ALREADY. I do not think it impossible that we see a pullback around rate decision or sooner. The current immediate 4h and 1h trend is steep (showing possible exhaustion incoming) especially with all the indicators showing momentum consolidating or slowing down - which could be a possible reversal signal. WATCH ath and the immediate reaction in the days coming.
Bull: Fib extension gives upward price points at 653.52 and even up at 659.09. I think its more possible to combine bearish with bullish thesis and say we will hit the 653.52 then drop- we might just bounce after the drop (which may not be very big). We are in a unique environment with policy and an administration that favors the biggest players in our market. It's silly to expect any SIGNIFICANT downside unless something fundamental *global or political happens. I see pullbacks but nothing like April.
simply put, we are going up there's no stopping that the market is A-symmetrical. However, there are points where I can predict high probability exhaustion and reversals in the coming days and week. aka pullback incoming. Watch all time highs and the adx once it starts to curve up.
CURRENT CONTEXT📌 CURRENT CONTEXT
- Gold price is now moving around 3640–3650, after bouncing strongly from the Demand Zone 3620–3625.
- The uptrend line is still intact, showing that the Higher High – Higher Low structure continues.
- Volume Profile shows VAH 3635 and POC 3629 still provide support below, while the Supply Zone 3668–3670 is the key resistance target.
🎯 TRADING SCENARIOS (FOLLOWING CURRENT PRICE)
🔹 SCENARIO 1 – BUY RETEST
Entry: 3635–3637 (previous VAH + trendline + volume support)
SL: Below 3620
TP: 3668–3670 (Supply Zone)
Conditions:
Price pulls back slightly but does not break the trendline
Bullish Engulfing or Pin Bar on M15/M30 at VAH zone
Low volume on pullback, strong volume when price bounces
🟢 This is a trend-following scenario, safer according to System X.
🔹 SCENARIO 2 – BUY BREAKOUT
Entry: When H1 candle closes above 3655–3658 with strong breakout volume
SL: Below breakout candle
TP: 3670–3675
Conditions:
Breaks out of the 3645–3655 consolidation zone
Breakout confirmed by high volume (large candle, strong volume)
🟢 For momentum traders, but requires clear confirmation.
🔹 SCENARIO 3 – SELL REACTION (LIMIT AT SUPPLY)
Entry: 3668–3670 (Supply Zone)
SL: Above 3675
TP: 3635–3638
Conditions:
Price quickly touches supply zone without strong breakout volume
Reversal signal appears (Bearish Pin Bar / Engulfing on M15/H1)
RSI overbought / short-term divergence
🔴 A reaction scenario, higher risk, SL must be tight.
🔹 SCENARIO 4 – SELL ON TRENDLINE BREAK
Entry: When price breaks 3620 + uptrend line
SL: Above 3630
TP: 3590 – 3570
Conditions:
Break of uptrend line + H1 candle closes below support
Strong selling volume pushing down
Clear reversal momentum
🔴 Short-term trend reversal scenario, volume needs to be monitored carefully.

EURUSD 4Hour Time frame📊 EUR/USD Snapshot
Current Price: ~1.1706
Recent Range: ~1.1685 – 1.1739
Intraday Change: Slightly negative (~-0.03%)
🔎 Key Levels (4H Focus)
Pivot Point: ~1.1702
Resistance:
R1: ~1.1712
R2: ~1.1729
R3: ~1.1739
Support:
S1: ~1.1685
S2: ~1.1675
S3: ~1.1658
📉 Technical Indicators
RSI: Neutral (~50) → no overbought/oversold condition.
MACD: Slightly positive → mild bullish momentum.
Moving Averages: Price is holding above the 20-period SMA (~1.1710), which acts as short-term support.
📌 4-Hour Outlook
Bullish Scenario: If EUR/USD stays above 1.1700–1.1710, it may push toward 1.1780 and higher levels like 1.1825–1.1850.
Bearish Scenario: If it drops below 1.1700, short-term weakness could test 1.1685 → 1.1675.
Bias: Moderately bullish, but momentum depends on breaking above 1.1780.
✅ Conclusion: On the 4-hour chart, EUR/USD is holding a cautious bullish tone, supported by short-term moving averages. The key battleground is around 1.1700 support and 1.1780 resistance — whichever side breaks first will guide the next move.

upward trendThe price is expected to fluctuate above the current support range and then we will see the beginning of the upward trend.

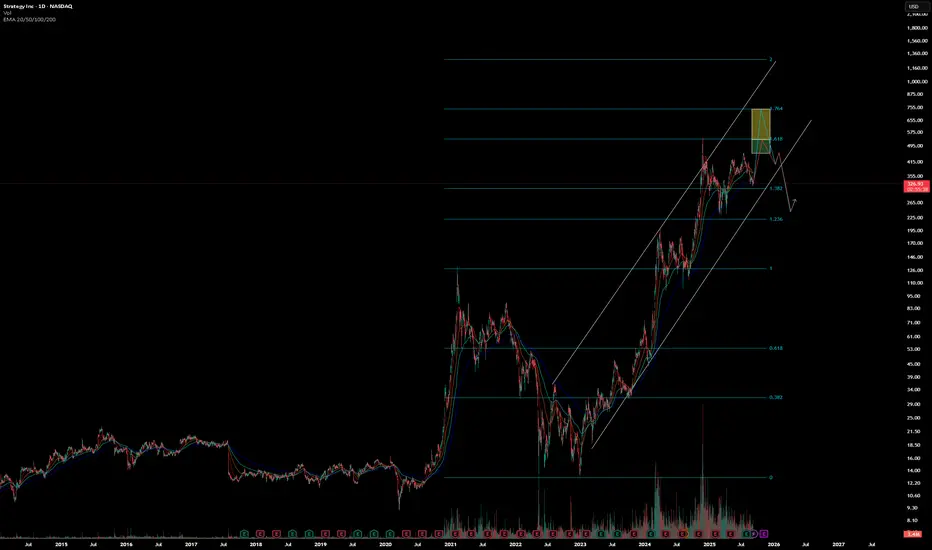
Do or Die - Q4 EditionNot stirring controversy with this take.
Higher in Q4 followed by a year-long bear market.
Using Fibonacci extensions from last cycle's top & bottom to hit a maximum of a 1.618 target by EOY.
Open to the possibility of price targets from most recent ATH ($550) and up to the 1.618 fib level.
This calls for aggressive appreciation within the next 3.5 months.
Price targets will be invalidated by immediate downward move or sideways chop, with the latter scenario resulting in a lower price target.
Stated differently, price needs significant upward volatility by the end of September/early October this forecast will not play out
Either scenario, this is nearly the end before the an imminent correction lasting a year or more.
I predict the next bear market for MSTR will be aggressive, with BTC price likely to fall beneath the Strategy's bitcoin dollar-cost-average of $73k as of 9/8/25.
FFL Cup & HandleBeautiful cup and handle formation completed. Next target as per cup and handle is mentioned in chart. This is not a buy/sell call.

NIFTYNifty levels are based on imbalances
1. gapup 24980 long
2. 24980-24920 trade breakout
3. gapdown 24920 short

BNBUSDT 1H coin holding the channelBinance Coin keeps moving inside its upward channel, once again confirming support at the lower boundary. EMAs are aligned below price, creating a local cushion, while the volume profile highlights accumulation around 860–870.
As long as price holds above 838, the structure stays bullish with the next upside target around 920–940.
Fundamentally BNB still carries the weight of the largest exchange behind it, which adds long-term confidence for buyers.
Right now BNB looks like a train on its rails
the direction is clear, only the speed of the ride remains in question.

WLDUSDTAccording to the previous analysis, it completed its second leg with good momentum, but it was only slightly involved in a time correction. Now, if it maintains this momentum and stabilizes, it can see the next levels.

XAUUSD | Bullish Setup from Demand Zone towards HTF LiquidityPrice is currently respecting a higher timeframe demand zone (3638–3642) after a sweep of liquidity (SSL) and a confirmed break of structure (BOS).
This indicates potential continuation to the upside targeting higher liquidity levels.
Plan:
• Looking for buy opportunities within the demand zone.
• Stop Loss: Below the zone (invalidates setup).
• Take Profit 1: 3652 (intra-day liquidity).
• Take Profit 2: 3676 (HTF BSL target).
Risk-to-Reward:
Approx. 1:2 to TP1 and up to 1:6 if extended to TP2.
Notes:
• Partial profits at TP1, then move SL to breakeven.
• Setup invalid if price closes below 3634 demand zone.

$NIO - $3.40 Price TargetNio is in extremely overbought territory on both the daily and weekly chart all while trending lower on its bearish downward channel. Short at the top of channel for a price objective at first support at $3.40.

Bitcoin targets liquidity at 117K before CPI data impact📊 On the daily timeframe, BTC has broken above the key resistance zone around 113K–114.5K, showing strength. Currently, the market is eyeing the 117K liquidity zone as the next potential target.
🔍 On shorter timeframes, the structure suggests momentum is tilted upward, while the longer timeframe still hasn’t confirmed a higher high. This makes the upcoming move critical in deciding whether BTC can finally establish a new higher high or not.
💡 The outcome hinges on today’s CPI inflation data. A favorable CPI print could fuel a rally toward 122.5K, while a neutral or weak print might only push BTC to test liquidity near 117K.
⚡ All eyes are now on September 17th when the Federal Reserve interest rate decision will follow this CPI release. That verdict will set the broader direction for BTC and the entire market.
As of now, probability leans toward liquidity grab around 117K, with extended potential toward 122.5K if macro data aligns bullishly.

AUDUSD Daily Forecast Q3 | W37 | D11| Y25📅 Q3 | W37 | D11| Y25
📊 AUDUSD Daily Forecast
🔍 Analysis Approach:
I’m applying Smart Money Concepts, focusing on:
Identifying Points of Interest on the Higher Time Frames (HTFs) 🕰️
Using those POIs to define a clear trading range 📐
Refining those zones on Lower Time Frames (LTFs) 🔎
Waiting for a Break of Structure (BoS) for confirmation ✅
This method allows me to stay precise, disciplined, and aligned with the market narrative, rather than chasing price.
💡 My Motto:
"Capital management, discipline, and consistency in your trading edge."
A positive risk-to-reward ratio, paired with a high win rate, is the backbone of any solid trading plan 📈🔐
⚠️ Losses?
They’re part of the mathematical game of trading 🎲
They don’t define you — they’re necessary, they happen, and we move forward 📊➡️
🙏 I appreciate you taking the time to review my Daily Forecast.
Stay sharp, stay consistent, and protect your capital
— FRNGT 🚀

AUDUSD Daily Forecast - Q3 | W37 | D11 | Y25📅 Q3 | W37 | D11 | Y25
📊 AUDUSD Daily Forecast
🔍 Analysis Approach:
I’m applying Smart Money Concepts, focusing on:
Identifying Points of Interest on the Higher Time Frames (HTFs) 🕰️
Using those POIs to define a clear trading range 📐
Refining those zones on Lower Time Frames (LTFs) 🔎
Waiting for a Break of Structure (BoS) for confirmation ✅
This method allows me to stay precise, disciplined, and aligned with the market narrative, rather than chasing price.
💡 My Motto:
"Capital management, discipline, and consistency in your trading edge."
A positive risk-to-reward ratio, paired with a high win rate, is the backbone of any solid trading plan 📈🔐
⚠️ Losses?
They’re part of the mathematical game of trading 🎲
They don’t define you — they’re necessary, they happen, and we move forward 📊➡️
🙏 I appreciate you taking the time to review my Daily Forecast.
Stay sharp, stay consistent, and protect your capital
— FRNGT 🚀
FX:AUDUSD

Nasdaq 100 Eyes New ATH if CPI Undershoots ExpectationsUSNAS100 – Overview
The Nasdaq will trade under CPI pressure today, with volatility expected around the release.
📉 Bearish scenario: While below 23,870, momentum favors a move toward 23,695, with further downside risk to 23,510 → 23,280.
📈 Bullish scenario: A reversal and stabilization above 23,870–23,940 would open the path toward 24,090 and a new ATH near 24,240.
⚠️ CPI impact:
Below 2.9% → supports bullish continuation for indices.
Above 2.9% → likely triggers bearish momentum.
Key Levels
Pivot: 23,870
Resistance: 24,090 – 24,240
Support: 23,695 – 23,510 – 23,280

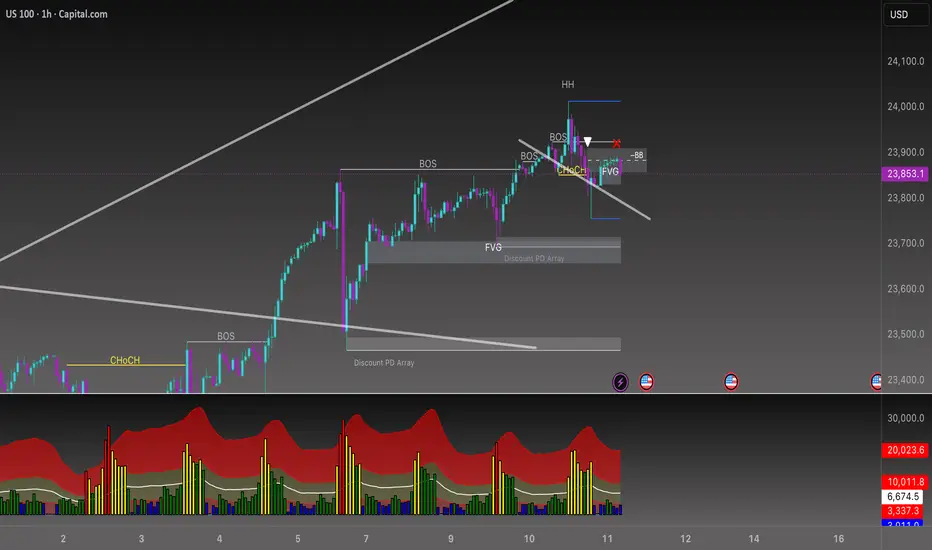
Beyond the Chart – NAS100 Through Technicals & Fundamentals⚖️ CAPITALCOM:US100 Fundamental Impact today
• The core driver is the US CPI (inflation) + Unemployment Claims at 3:30 pm.
• Expect increased volatility on NAS100 around that time:
• ✅ Lower CPI + weaker jobs → Bullish NAS100 (rate cut hopes).
• ❌ Higher CPI + strong jobs → Bearish NAS100 (higher for longer Fed).
1. Bearish Continuation (Main Scenario)
• Rejection from the bearish FVG + BB zone → downside continuation.
• Targeting:
• 23,750 short-term liquidity sweep.
• Then 23,700–23,650 (discount FVG).
• Extended target: 23,540 (major discount PD array).
2. Deeper Retracement / Liquidity Sweep (Alternative Scenario)
• Price might push slightly above the bearish FVG / BB zone (~23,900–23,930) to sweep late shorts.
• Then reversal down, same targets as scenario 1.
3. Bullish Recovery (Less Likely for Now)
• If price reclaims above 23,950–24,000, structure shifts bullish again.
• Potential revisit of 24,100+ liquidity above the HH.
⸻
⚖️ Bias
• For now, bias is bearish unless 23,950–24,000 is broken with strength.
• Volume histogram also shows selling momentum increasing after the rejection.
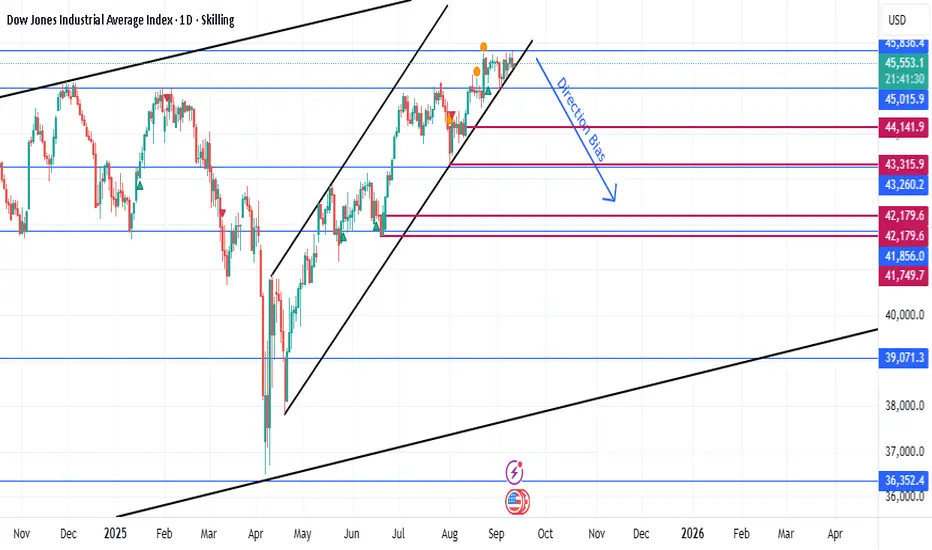
US 30 INDEX 11 SEPTEMBER 2025 TRADE IDEAThe US30 is currently trading near the top of an ascending channel, showing signs of exhaustion after a strong bullish run since April. Price is struggling to hold above the 45,500 area, suggesting the possibility of a pullback as liquidity builds up beneath recent higher lows. From a Smart Money Concepts perspective, the market structure remains bullish on higher timeframes, but with equal lows and inefficiencies below, a corrective move is likely. A clean break of the channel support could trigger a retracement toward key demand zones around 45,015, 44,141, and possibly deeper into 43,315–43,260, where institutional buyers may re-enter for continuation to the upside. Fundamentally, the short-term outlook is cautious, as traders await fresh US inflation and labor market data; softer economic releases would strengthen the case for Fed rate cuts later in 2025, which supports equities, while stronger-than-expected figures could put pressure on risk assets and fuel a temporary correction. Overall, the directional bias for the week is leaning bearish in the short term as price tests the upper channel, with expectations of a corrective dip into demand before resuming the broader bullish trend.
GBP/USD Stalls at 1.3390 Resistance - What Next?GBP/USD is trading around 1.3528, consolidating within a clear range defined by resistance at 1.3589 and support at 1.3365. The pair has been oscillating inside this zone, with no decisive breakout yet.
Key technical observations:
Support and Resistance: The lower boundary at 1.3365 has acted as a strong demand zone, while repeated tests of 1.3589 highlight firm resistance. Until either level is breached, the pair remains range-bound.
Moving Averages: Price is hovering above both the 50-SMA (1.3489) and the 200-SMA (1.3442), suggesting underlying bullish bias, though momentum is subdued.
Momentum Indicators: RSI is steady at 53, reflecting balanced momentum. The MACD is slightly positive but flattening, in line with consolidation.
Overall, GBP/USD is in a sideways phase with a bullish tilt as long as it holds above the 200-SMA. A break above 1.3589 would confirm upside continuation, while a drop below 1.3365 would expose the downside. -MW

GBPUSD-bias short Bearish indications:
HS formation in 5 min and 4 hr as well
Previous day's low broken
MA 21 being respected in 1 hr
trend line support broken
Bearish diverggence in 4 hr
Trade plan bias short @ 1.35236
SL:1.3544
TP1:1.3501
TP2:1.348

PYPL watch $64.77-65.12: Dual Golden zone would be ideal BOTTOMPYPL has been drifting lower since rejecting at $70.20
Now approaching a Double Golden fib zone $64.72-65.12
Bulls need to hold this major support or face $60.00 next.

NZDUSDBullish Flag found in NZDUSD 1H time frame with PRZ, expecting loosing its upwards strength after creating bearish divergence, which looks like bearish, expected entry point and stop loss mention with TP.
