Fibonacci Retrace Strategy NAS100 Trade Idea📈 NASDAQ 100 (NAS100) is holding a strong bullish trend 🚀. After a weekend gap-up 🕳️➡️📈, price retraced back into the gap zone—exactly what you'd expect in a healthy trending market.
🔍 I'm applying my Fibonacci Expansion + Retrace Strategy 🔢, watching closely for a pullback into equilibrium ⚖️ within the previous price swing. That’s where I’ll be waiting for a bullish market structure break 🔓📊 to confirm my long bias.
🧠 Patience is key here—let the setup come to you.
📌 As always, this is not financial advice!
Community ideas

Ethereum Long: Using Log Chart to Analyze, Target $6600In this video, I go through the analysis using the log chart for Ethereum and shows the potential of this cryptocurrency where I expect the price to reach new high in the coming days with a longer-term target of $6600.
For shorter-term trading, I recommend placing the stop a distance below recent support on the daily chart, around $3372.
Good luck!

XMRUSD - Monero And It's Warning-LinesToday we’re analyzing Monero, with a focus on a new aspect of Median Lines — the Warning Lines, or WL for short.
Warning Lines are simply extensions of the distance between the Center Line (CL) and one of the Median Line’s outer boundaries, either the Upper Median Line Parallel (U-MLH) or the Lower Median Line Parallel (L-MLH).
So why are they important for us in our trading?
As you can see, WL1 and WL2 mark important price levels. WL2 is where price reversed, while WL1 acts as resistance.
Just like with the standard lines, our full trading rule set applies to Warning Lines too. This includes scenarios like a Hagopian, a breakout or "Zoom Through," and the Test and Re-Test.
Now, looking at the current analysis:
The price was rejected at WL1 after falling from WL2. This shows strong resistance at WL1, and now the price is heading toward the U-MLH.
If the price breaks below the U-MLH and starts opening and closing within the Fork again, there’s a strong chance it will move back toward the Center Line in the near future.
That could be your signal to take more profits, close the position, or possibly even short Monero.
Personally, I find it difficult to short crypto due to the high risk of manipulation by whales in the market. I prefer not to get caught in a short position if the price suddenly gaps to the upside. So I probably look to take a new position or add to an existing one, since it is a fair level where price found it's center.
That’s it for today.
Did you learn something new?
Great. See you next time, and trade safe.

Downward Pressure Resumes After Channel BreakdownXAUUSD OANDA:XAUUSD – Downward Pressure Resumes After Channel Breakdown: Key Levels and Strategy for Today
As of the July 29 session, gold (XAUUSD) remains under short-term bearish pressure, having broken below the descending price channel on the 1H timeframe. The market structure confirms a dominant bearish trend as price continues to trade below the EMAs cluster.
1. Price Action and Market Behavior
XAUUSD is forming a clear sequence of lower highs and lower lows, confirming a short-term downtrend.
Price is currently hovering around $3,316 after breaking below the lower boundary of the channel, signaling potential continuation of the sell-off.
2. Key Resistance and Support Levels
Immediate resistance: 3,337 – 3,346 USD (aligned with EMA20, EMA50 and prior channel resistance).
Major resistance: 3,378 – 3,385 USD (confluence of Fibo and former high).
Near-term support: 3,300 USD (psychological level).
Major support: 3,248 USD (projected target based on measured move from channel height).
3. Technical Indicators
EMA20 and EMA50 are both below EMA200, forming a classic “death cross” – a strong bearish signal.
Volume increased on the breakdown, reinforcing the strength of bearish momentum.
RSI remains below 50, indicating weak bullish retracements and room for further downside.
4. Trading Strategy
Primary Strategy: Sell on Rally
Ideal entry zone: 3,331 – 3,346 USD.
Stop Loss: Above 3,353 USD (above key resistance zone).
TP1: 3,300 USD.
TP2: 3,248 USD (extended target based on breakout structure).
Alternative Strategy: Countertrend Long
Only consider buy setups if strong reversal candles and bullish RSI divergence appear near 3,248 USD.
XAUUSD continues to face downside risk after the channel breakdown. Unless bulls reclaim the 3,337 – 3,346 zone, price is more likely to drift lower toward 3,300 and potentially 3,248. Traders should remain patient and wait for clean setups around these key zones.
Follow for more strategies and remember to save this post if you found it helpful.
Let me know if you'd like a short version for the TradingView caption or hashtags suggestion.

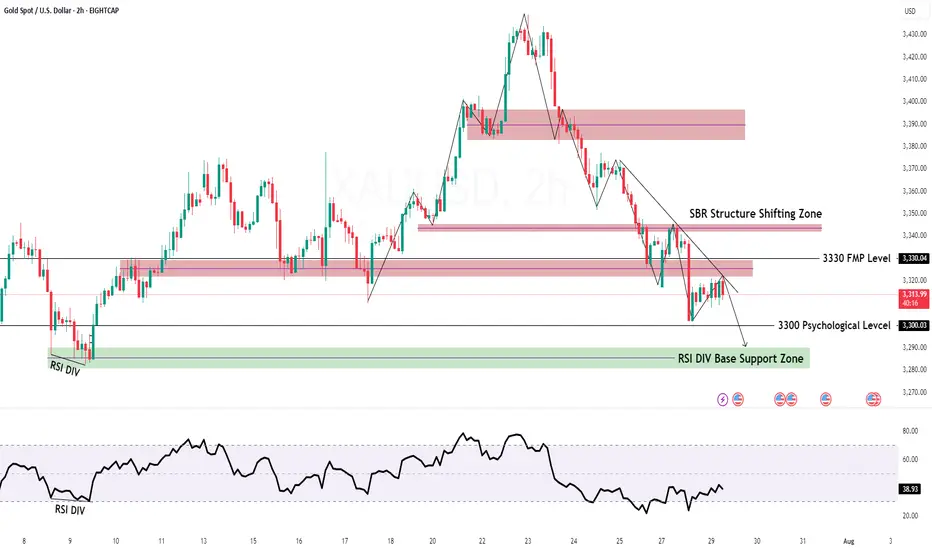
GOLD H2 Intraday Chart Update For 29 July 2025Hello Traders, Welcome to new day
we have US JOLTS high impact news today, for market sustains above 3300 psychological level
if market successfully break 3280 level then it will move towards 3280 or even 3270
if market crosses 3330 level successfully then it will move towards 3345 or even 3360
All eyes on FOMC & NFP news for the week
Disclaimer: Forex is Risky
USDJPY – Strap in For the Central Bank Rollercoaster The next 4 trading days could be crucially important for FX markets, with traders bracing for the outcomes of a variety of different events including several central bank meetings, economic data readings and trade deal/tariff negotiations. No currency pair within the majors is likely to feel the impact of these events more than USDJPY, given that both the Federal Reserve (Fed) and Band of Japan (BoJ) interest rate decisions take place within a 9-hour window late on Wednesday evening and early Thursday morning, UK time (Fed 1900 BST Wed, BoJ 0400 BST Thurs).
The first move in USDJPY at the start of this week has been higher. This was in response to the announcement of a trade deal between the EU/US, which sees tariffs of 15% on most EU goods imported into the US and has been taken as a success for President Trump and his trade team. (general USD positive). When coupled with the political uncertainty surrounding Japanese PM Ishiba, who is fighting to keep his job, (potential JPY negative) USDJPY has traded from opening levels at 147.51 on Monday up to a high of 148.71 earlier this morning in Asia.
Looking forward, both the Fed and BoJ are expected to keep interest rates unchanged. This could make what is said at the accompanying press conferences by Fed Chairman Powell (1930 BST Wed) and BoJ Governor Ueda (0730 BST Thurs) on the timing of their next respective interest rate moves potentially pivotal for the direction of USDJPY into the weekend.
Tier 1 US economic data may also be important, with the Fed’s preferred inflation gauge (PCE Index) due for release at 1330 BST on Thursday, and the next update on the current health of the US labour market due on Friday at 1330 BST in the form of Non-farm Payrolls. Sentiment may also be impacted on Friday by any headlines or social media posts from President Trump regarding trade deals and updates on whether he may extend or hold certain countries to his current deadline of August 1st.
Technical Update: Focus on Fibonacci Retracement Resistance at 149.40
On July 16th 2025, USDJPY traded to a price high of 149.19, nearing what might have been considered a resistance level by traders at 149.40. This level is equal to the 50% Fibonacci retracement of the price weakness seen from 158.88 on January 10th down to 139.88, the April 22nd low. Having been capped by this resistance level, a setback in price developed last week.
However, this phase of price weakness encountered buying support around the Bollinger mid-average, currently at 146.98, from which fresh attempts at price strength have emerged. As a result, it might be argued that this type of price action is more constructive in nature, especially as since the April 22nd low was posted a pattern of higher price lows and higher price highs has so far materialised, as the chart above shows.
That said, with potential for a sustained period of USDJPY volatility in the week ahead let’s consider what may be the important support and resistance levels that could influence the direction of prices moving forward.
Potential Resistance Levels:
Having previously capped price strength, the 149.40 retracement level may prove to be successful in doing so again, meaning closing breaks above 149.40 might now be required to suggest a further period of price strength.
As the chart above shows, if successful breaks above 149.40 do materialise, potential may then turn towards tests of the next resistance at 151.21, the March 28th session high, even 151.65, the higher 61.8% Fibonacci resistance level.
Potential Support Levels:
Having seen it offer support to recent price declines, traders may still be focusing on the 146.98 Bollinger mid-average as an important level that if broken on a closing basis, might lead to a further phase of price weakness.
Closing breaks under the 146.98 support while not a guarantee of further declines, could suggest potential to test 145.85, the July 24th session low and rally point, even towards 142.68, the July 1st low.
The material provided here has not been prepared accordance with legal requirements designed to promote the independence of investment research and as such is considered to be a marketing communication. Whilst it is not subject to any prohibition on dealing ahead of the dissemination of investment research, we will not seek to take any advantage before providing it to our clients.
Pepperstone doesn’t represent that the material provided here is accurate, current or complete, and therefore shouldn’t be relied upon as such. The information, whether from a third party or not, isn’t to be considered as a recommendation; or an offer to buy or sell; or the solicitation of an offer to buy or sell any security, financial product or instrument; or to participate in any particular trading strategy. It does not take into account readers’ financial situation or investment objectives. We advise any readers of this content to seek their own advice. Without the approval of Pepperstone, reproduction or redistribution of this information isn’t permitted.

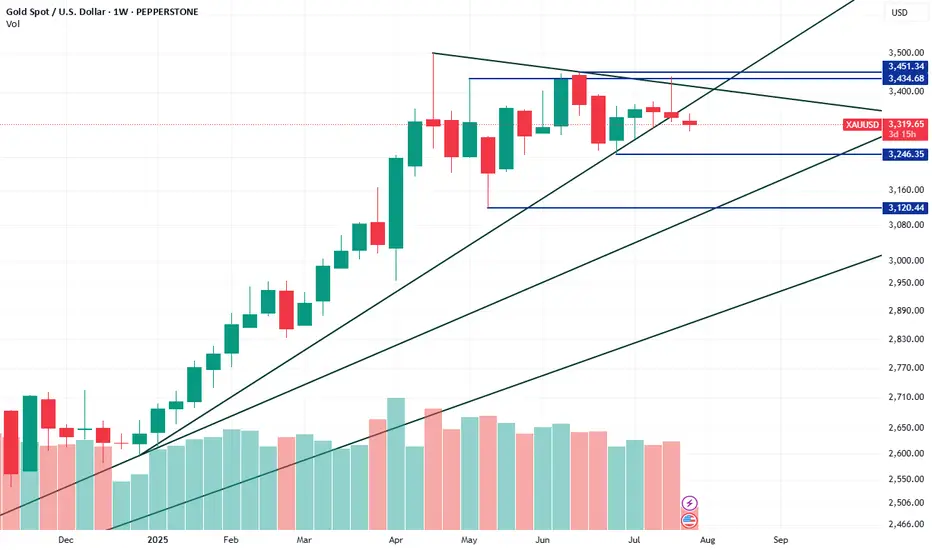
XAUUSD could potentially drop down to 3120XAUUSD has broken its most recent descending trendline on the Weekly chart, signaling a possible short-term reversal. It’s now approaching a higher-timeframe descending trendline, which could act as resistance. The next key demand zone is around 3246; if that fails, the more significant demand lies at 3120. Despite this pullback, the macro trend remains bullish. Notably, institutional traders increased their net long positions by over 40,000 contracts last week, bringing the total to more than 253,000, reflecting a potential shift in sentiment.
Zee entertainment - portfolio buy (long term)This is a slightly high risk long term buy suggestion on Zee
Was looking at a pullback to buy. Decent retracement has happened

RECTANGLE CHANNELHello awesome traders! 👋
Hope you’ve managed to grab some solid pips from the markets this week. As we head into the weekend, I’m wrapping things up by dropping a few clean chart setups for you to review and reflect on.
Enjoy the weekend, recharge well — and I’ll see you sharp and ready next week for more structure-led opportunities.
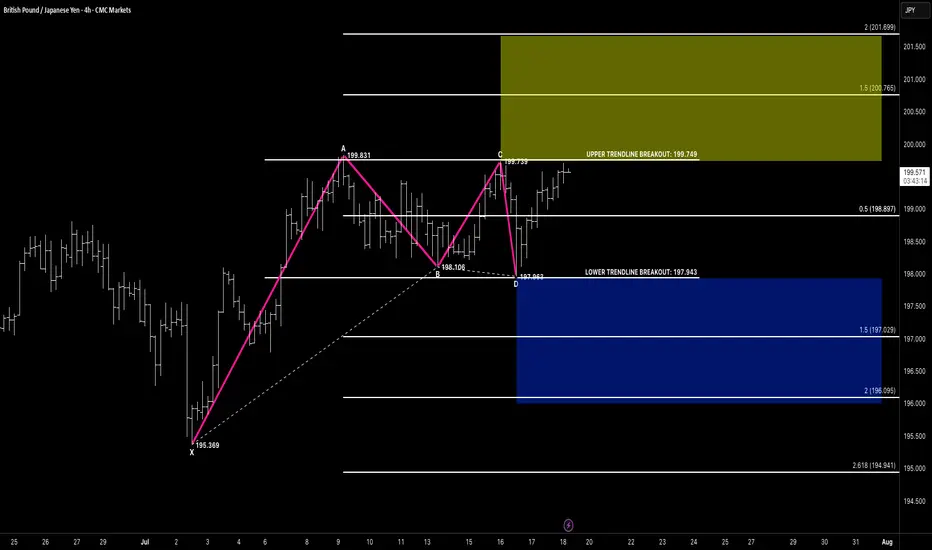
📌 Pattern Breakdown
We’ve been tracking a developing rectangle channel between 197.94 (support) and 199.74 (resistance):
🔹 Price formed a clear 4-leg compression
🔹 CD leg bounced off lower support near 197.96
🔹 We’re now approaching the upper edge of the channel at 199.74
🔹 Compression structure suggests breakout potential is building
🚨 Breakout Setup in Focus
🔸 A breakout above 199.75 opens the door toward:
✅ Target 1 Zone:
• 1.5 extension = 200.76
✅ Target 2 Zone:
• 2.0 extension = 201.69
📌 Flip-side: A failed breakout and close back below 197.94 would shift structure toward:
🔻 Bearish Breakdown Targets:
• 1.5 = 197.02
• 2.0 = 196.09
• 2.618 = 194.94
We stay flexible — trade the breakout, not the anticipation.
🧠 Key Concepts in Play
✅ Rectangle consolidation
✅ Breakout-ready structure
✅ Defined upper/lower breakout levels
✅ Volume and reaction at edges = trigger
🗝 Final Thoughts
GBPJPY is boxed in tight — but momentum is clearly leaning bullish.
If we get that clean break above 199.75 with confirmation (volume, close, continuation), the 200.76+ range is firmly in sight. No breakout? No problem — structure has a plan either way.
“Boxes don’t trap the market — they build the tension. Breakouts reward the patient.”

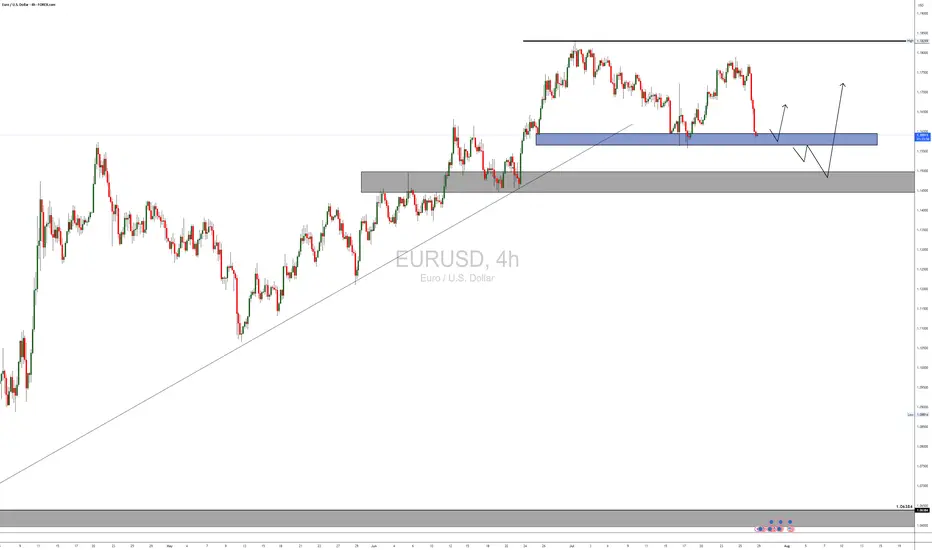
Sell,Buy,Sell!Hello all. as you see market structure Talks. it is so beautiful move is running right here. be happy(wink)

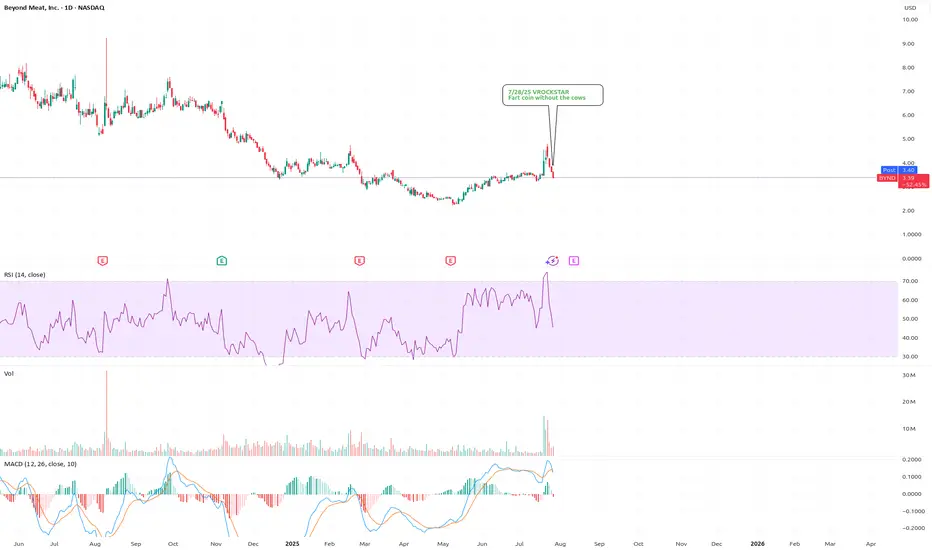
7/28/25 - $bynd - Fart coin without the cows7/28/25 :: VROCKSTAR :: NASDAQ:BYND
Fart coin without the cows
- over a $1 bn enterprise value
- no sales growth
- bill gates
- burns 100 mm a year
- nobody eats this product
- same valuation as fartcoin but fartcoin doesn't burn cash
- almost obviously going to zero
- but it's impossible to short
- if i owned it, i'd probably need an intervention, but beyond that... i'd dump it for anything *literally* treasuries, even XRP...
- just a PSA
- while not related... take NASDAQ:GAMB for instance.
- trades at less than 1/4 of the valuation. has 2/3 of the sales. 3x the gross profit. 15% fcf yield next year. but, this market is currently in the look here, over there, "it's only $3 and that one is $11" phase.
- this too... shall... pass.... and... "yes it's your fault you own this" at this stage, nobody else to blame.
V
SPX500USD | Bulls Lose Steam at 6,424.5 ResistanceThe S&P 500 Index showed strong bullish momentum but is now pulling back after tagging resistance at 6,424.5. Price is currently hovering near 6,374.6, where previous structure may act as support.
Support at: 6,374.6 / 6,340.0 🔽
Resistance at: 6,424.5 🔼
🔎 Bias:
🔼 Bullish: Bounce from 6,374.6 and reclaim of 6,424.5 signals continuation.
🔽 Bearish: Break below 6,374.6 exposes 6,340.0 and lower zones.
📛 Disclaimer: This is not financial advice. Trade at your own risk.

ORCL heads up at $212 then 220: Double Golden Fibs may STOP runORCL has been flying off the last Earnings report.
About to hit DUAL Golden fibs at $212.67-220.21
Ultra-High Gravity objects in its price-continuum.
It is PROBABLE to consolidate within the zone.
It is POSSIBLE to reject and dip to a fib below.
It is PLAUSIBLE but unlikely to blow thru them.
.
My last Plot that caught the BreakOut EXACTLY:
=================================================
.

CCJ eyes on $45.37: semi-major Fib may dip to $42 for long entryCCJ trying to recover from the nuclear bubble burst.
Currently testing a semi-major Covid fib at $43.37
If it dips then watch the support zone $42.31-42.91

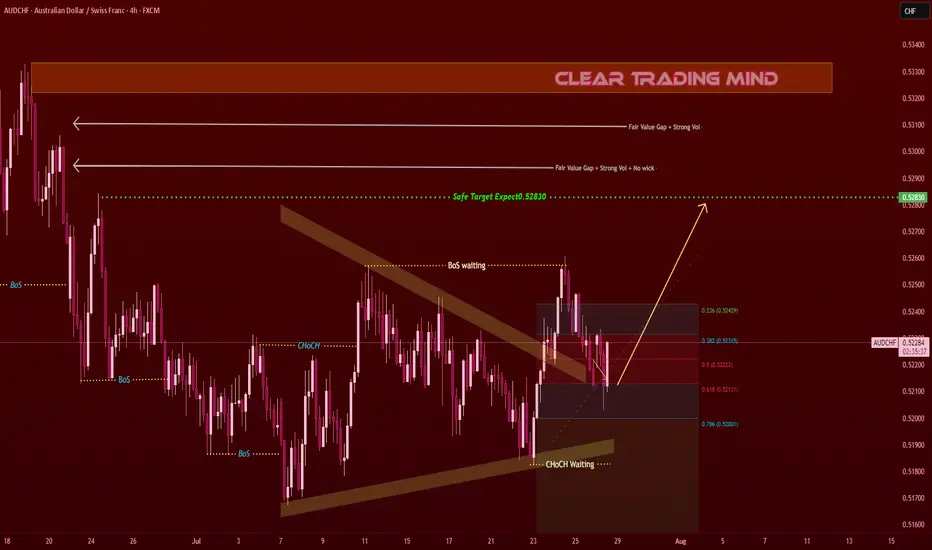
AUDCHF Triangle Breakout – Targeting 0.52830AUDCHF on the 1-hour chart is respecting a contracting triangle pattern 🔺 and showing bullish intent.
From a 4hr perspective:
- Fair Value Gap + Strong Volume Zone 🟧 above price
- Safe Target: 0.52830
Key Observations:
- CHoCH waiting for confirmation (bullish structure)
- BoS expected above the triangle top
- Current pullback holding near Fib 0.382 – 0.5 (0.52300 – 0.52220)
Plan:
- Watching for bullish breakout and continuation to 0.52830 (≈ 60 pips) 🎯
- Support area near 0.52000 – 0.52100 should hold for bullish scenario
- Break below 0.52000 invalidates
Reasoning:
- Contracting triangle breakout pattern 🚀
- Strong volume-based Fair Value Gap above
- 4hr structure supports bullish continuation
(Personal chart study, not financial advice)
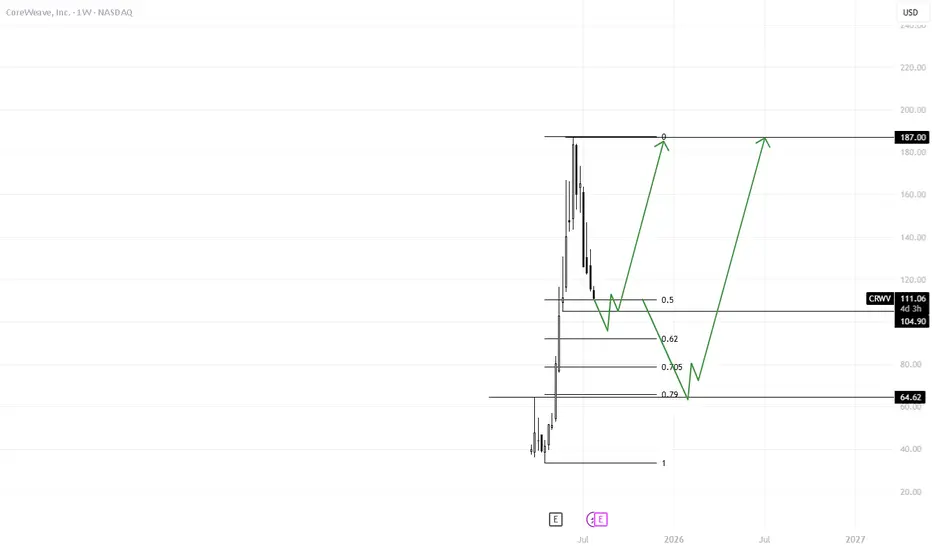
CRWVExpecting Bullish price action at 100$ level. If break of structure is noted and maintained I see upside targets remaining 189$. Second Scenario is Price falls to the 60$ level then shows bullish price action.
GBPUSD Will Go Down!
HI,Traders !
#GBPUSD keeps falling down
And broke the
Key wide horizontal level
Around 1.33938 which is now
A resistance and the breakout
Is confirmed so we are very
Bearish biased and we will
Be expecting a bearish
Continuation !
Comment and subscribe to help us grow !

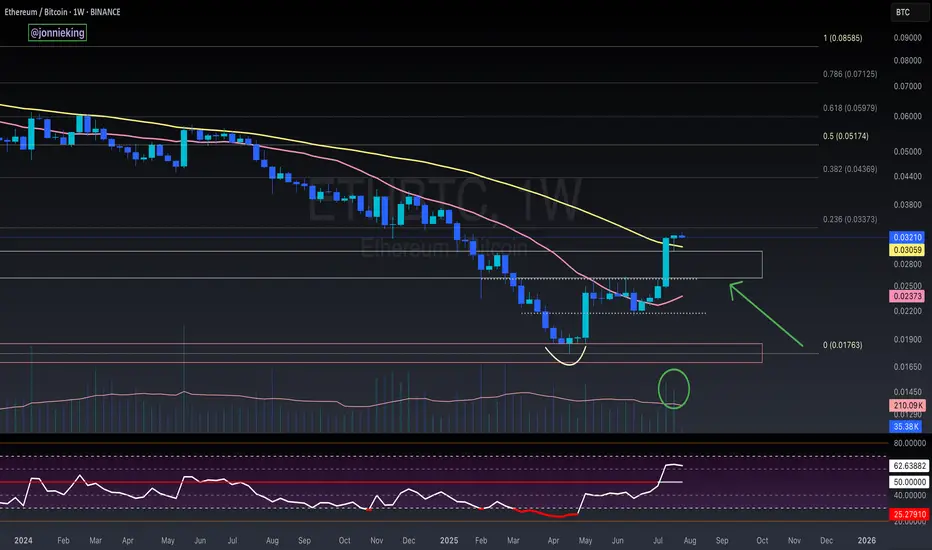
$ETH 2nd Weekly Close Above 50MA = Alt Season2nd Consecutive Weekly Close
above the 50MA for CRYPTOCAP:ETH
✅ Volume to confirm the breakout.
✅ RSI has bottomed.
WHAT TO WATCH 👀
┛Bullish Cross on the 20/50MA to confirm the next leg up.
┛Approaching some resistance ahead at the .236 Fib
┛Expect a small pullback in the next week or two so make sure to get your bids in.
Remember the rotation:
✅ BTC > ✅ ETH > Large Caps > Mid Caps > Micro Caps.
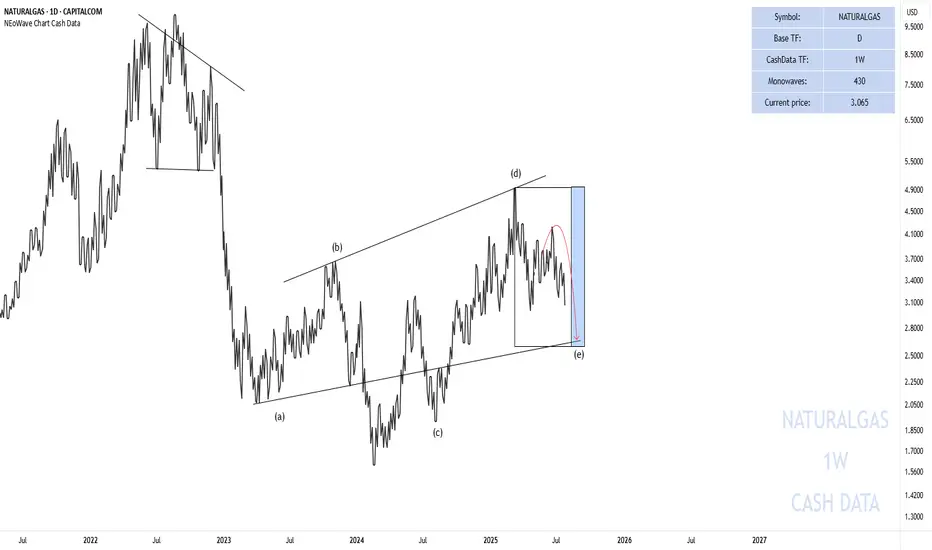
End of the Wave-(e) Natural Gas
In the previous analysis I said that:
Currently, wave-(e) is forming and I do not expect a strong upward movement until August 12-September 12 and this wave can take time until the time range I specified for it.
In the picture you can see that the price has started to decline again exactly from where we specified and has fallen by 27% so far. The price is not necessarily going to fall to 2.66 but time must pass and the price must enter the specified time range.
Good luck
NEoWave Chart
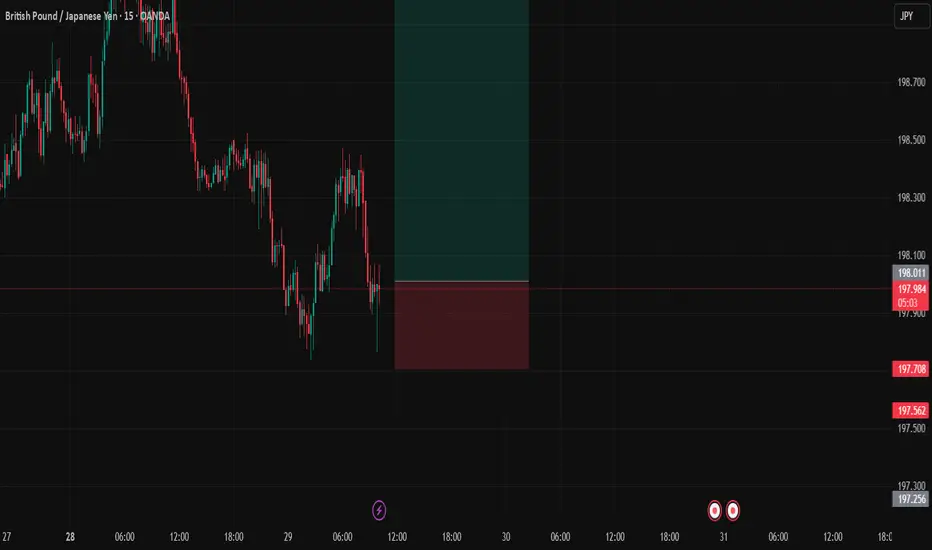
GBPJPYDate:
July 29,2025
Session:
London and New York Session
Pair:
GBPJPY
Bias:
Long
Yesterdays liquid untouched still lies. Expecting price to fill that area either by end of NY session or Asia.
Entry: 198.018
Stop Loss: 197.704
Target: 199.068
RR: 3.5
#FTX/USDT Breakout soon#FTX
The price is moving within an ascending channel on the 1-hour frame, adhering well to it, and is on track to break it strongly upwards and retest it.
We have support from the lower boundary of the ascending channel, at 0.8800.
We have a downtrend on the RSI indicator that is about to break and retest, supporting the upside.
There is a major support area in green at 0.8760, which represents a strong basis for the upside.
Don't forget a simple thing: ease and capital.
When you reach the first target, save some money and then change your stop-loss order to an entry order.
For inquiries, please leave a comment.
We have a trend to hold above the 100 Moving Average.
Entry price: 0.8932
First target: 0.9584
Second target: 1.0267
Third target: 1.105
Don't forget a simple thing: ease and capital.
When you reach your first target, save some money and then change your stop-loss order to an entry order.
For inquiries, please leave a comment.
Thank you.
