DOGE Can it reach $0.20 again before resuming the downtrend?Dogecoin (DOGEUSD) has been trading within a Channel Down since its December 02 2024 weekly High, which turned out to technically be the top of its Bull Cycle.
The latest Lower Low of that pattern was on the October 06 2025 weekly flash crash but since then it retraced back into the 1W MA50 (blue trend-line) - 1W MA200 (orange trend-line) range. The 1W MA200 has been the market's Support throughout the whole 2025. The 1W MA50 typically assumes the role of the long-term Resistance during Bear Cycles.
As a result, we expect a short-term rebound now for Doge, but that should be limited by the 1W MA50. This is also where the 0.618 Fibonacci retracement level is from the October 06 Low, a Fib level where he September 08 2025 Lower High was priced.
Based on that, Doge could target $0.20 (Fib 0.618) and then resume the downtrend on the Channel's new Bearish Leg. If it follows the -7% decreasing rate of the previous Bearish Leg, we can see it bottom after a 59% decline, which should be around $0.085.
Notice also that last week's Low, wasn't only on the 1W MA200 but also on the 1W RSI's Support Zone. A Zone that has been holding since June 05 2023, essentially the major Support of the Bull Cycle, and has provided four perfect buy entries already.
---
** Please LIKE 👍, FOLLOW ✅, SHARE 🙌 and COMMENT ✍ if you enjoy this idea! Also share your ideas and charts in the comments section below! This is best way to keep it relevant, support us, keep the content here free and allow the idea to reach as many people as possible. **
---
💸💸💸💸💸💸
👇 👇 👇 👇 👇 👇
Community ideas

EURUSD Today – Market Moved Exactly as Predicted!EURUSD Analysis – Thursday, November 27
Welcome traders! 👋
I’m glad to have you here — we’re all learning and growing together in this amazing trading journey.
Let’s dive into today’s analysis on EURUSD 👇
As I mentioned in previous analysis, yesterday’s price movement played out exactly as expected — sweeping liquidity and reacting precisely to the levels identified. ✔️
On the weekly timeframe, EURUSD remains in a bearish macro trend 📉.
However, on the daily and 4H timeframes, the structure is still bullish, with price maintaining higher lows and pushing upward from discount levels 📈.
⚠️ Important Note:
Today is a bank holiday, so volatility may be reduced and price movement may be slower or more consolidated.
Scenarios for Today
Scenario 1 (More Likely) 🟢
Price sweeps the liquidity level I identified, taps into the POI below, and from there initiates a bullish reaction.
This would align with the internal bullish structure on lower timeframes.
Scenario 2 (Less Likely but Possible) 🟡
Price first taps into the OBS above, grabs Asia-session liquidity, then declines toward the POI.
From the POI reaction, bullish continuation may start.
Both scenarios point toward a potential upward continuation, but only after proper liquidity collection and mitigation.
🚨 Risk & Confirmation
The market is never 100% certain.
Wait for strong confirmation before entering any trade and always practice strict risk management.
If you have any questions or want to share your perspective, drop your comment below 👇
Let’s grow together.
#EURUSD #ForexAnalysis #SmartMoneyConcepts #SMC #Liquidity #OrderBlock #POI #OB #FXEducation #PriceAction #ICTConcepts #ForexTrader #DayTrading #MarketStructure #4HAnalysis #DailyAnalysis #TradeSmart #parisa_tl

SPX500: Thanksgiving Range — 6815–6842 Controls the MarketOANDA:SPX500USD continued to push higher exactly as projected yesterday.
Market activity is expected to be quieter today due to the Thanksgiving holiday, which typically reduces volatility across U.S. indices.
Technical Outlook
For today, the price is likely to consolidate between 6815 and 6842 until a breakout occurs.
Bearish Scenario:
A 1H close below 6813 will open the path toward 6771, with 6797 acting as the first reaction zone.
Bullish Scenario:
While trading above 6813, the price may retest 6842, and a break above this level could extend toward 6870.
Pivot Line: 6813
Support: 6797 · 6771
Resistance: 6842 · 6870

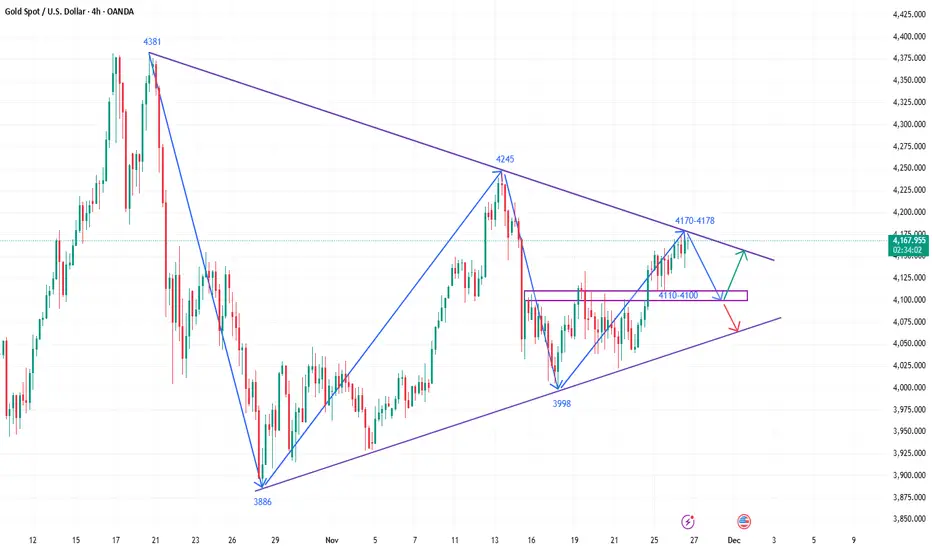
How to grasp the convergence of the golden triangle pattern?Gold Price Trend Analysis: After rising on Monday, gold closed with a doji on Tuesday and continued its upward trend today, reaching a high of around 4173. Overall, the market remains relatively strong. On the larger timeframe, the weekly chart shows solid support at the MA10 level, while the daily chart shows a tendency to form a triangle pattern. The upper edge of this triangle, around 4170-4180, will likely provide short-term resistance. Furthermore, considering the Thanksgiving holiday in the US market later this week, market activity is expected to be low. Therefore, range-bound trading is currently a suitable strategy for gold, but it may not be ideal for trading. This special timeframe could easily trigger a high degree of market manipulation, leading to abnormal price fluctuations.
Gold Technical Analysis: Looking at the 4-hour chart, the triangle consolidation pattern for gold remains unchanged. The downward trendline resistance is around 4170-4180. Only a decisive break above this trendline resistance will allow for further upward movement and a new round of opportunities. Otherwise, it will remain in a consolidation phase. On the 1-hour chart, gold is expected to continue its high-level consolidation today. The key support level to watch is the 5- and 10-day moving averages around 4110-4100. On the upside, the first resistance level to watch is 4170-4180. The possibility of testing 4200 depends on both technical and fundamental factors. Specifically, if gold holds above the moving averages throughout the second half of the week and provides further bullish fundamental catalysts, it might attempt to reach 4200 in the second half of the week. However, the uncertainty brought by the holiday season should be carefully considered in the second half of the week. In summary, today's gold trading strategy is to primarily sell on rallies and secondarily buy on dips. The key resistance level to watch in the short term is around 4170-4180, while the key support level is around 4110-4100. Traders must follow the trend, manage their positions and stop-loss orders carefully, strictly set stop-loss orders, and avoid holding losing positions.
BTCUSDT (bitcoin) toward $91k?Hi!
BTC has finally broken its major descending trendline, signaling a shift in market sentiment after a long period of selling pressure. Following that break, price formed a clear inverse head and shoulders pattern, showing that buyers stepped in aggressively after the final liquidity sweep at the Head. Since then, BTC has been moving inside a well-defined ascending channel, consistently printing higher highs and higher lows, which confirms bullish momentum.
As long as price respects the lower boundary of this channel, the upside structure remains intact. The next significant resistance sits at 92,500–93,000, which also aligns with the previous breakdown zone you highlighted. This area is likely to attract sellers, making it a logical target for the current move.
Overall, the chart supports continued upside toward 93K, unless price breaks below channel support, which would weaken the bullish reversal setup.

USD/CHF: Looking for BuyUSD/CHF: Looking for Buy Entry Points from Institutional Levels
Current Situation:
On the USD/CHF chart, price has reached a level where it encountered strong resistance to downward movement. The nature of this halt indicates the presence of a limit player — such reversals are rarely random coincidences.
Primary Scenario:
A price reversal upward is expected from current levels with the formation of buying positions. Potential reversal points are marked on the chart — these are high volume zones where large participants previously showed activity.
Trading Plan:
Consider opportunities to open long positions from the high volume zones displayed on the chart
Entry points form in areas where institutional activity was previously recorded

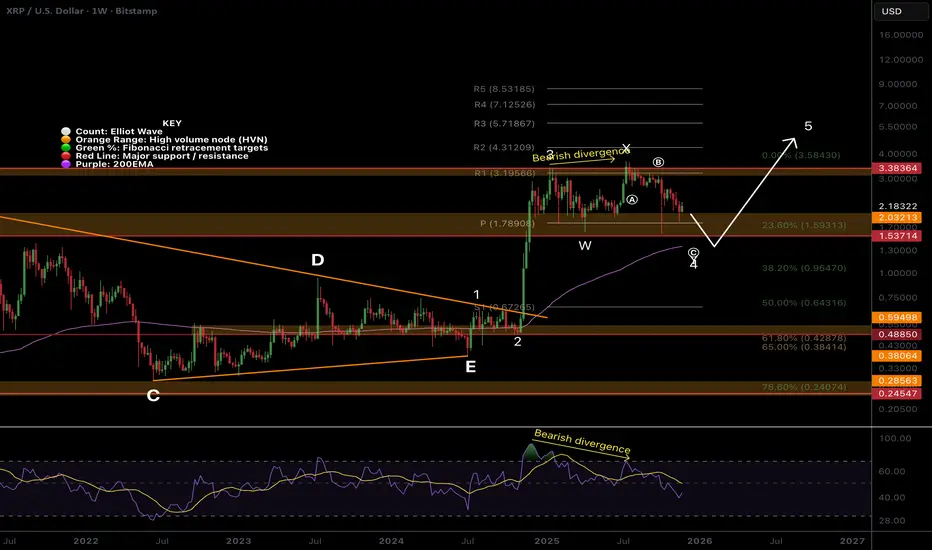
$XRP count changed, wave 4 underwayCRYPTOCAP:XRP Wave 4 appears to be a flat correction defined by the poke above the all-time high. Wave 4 is expected to end at the 0.382 Fibonacci retracement, also the weekly 200EMA ~$1.2.
The multi-year triangle is a penultimate move, so continuation in wave 5 to price discovery is my preferred count. For no,w price is stuck in a range aboev the weekly pivot.
🎯 Terminal target for the business cycle could see prices as high as $4.31 based on the weekly pivots
📈 Weekly RSI is bearish with room to fall after printing bearish divergence
👉 Analysis is invalidated if we fall below $0.64, as wave 4 can not go below 0.55 Fibs
Safe trading
GBPJPY - D11. Market Structure Overview
✔ Higher timeframe bias:
Still bullish, but price is now entering a premium zone where long-term sellers may activate.
✔ Current behavior:
Price has pushed into a daily supply + Fibonacci 1.272 extension near 207.20–208.00.
This is an area where smart money typically seeks distribution or liquidity grabs → then a correction.
2. Key Levels From the Chart
🔴 Major Supply / Sell Zone
206.88 – 207.21 – 208.07
Strong bearish reaction wick shown in your chart
Inside premium pricing
Alignment with the rising channel upper boundary
Previous liquidity pool above highs, now swept
→ Perfect area for a D1 distribution → bearish reversal
🔵 Support Zones / Downside Targets
205.39 — first support → likely to break if major reversal begins
204.30 — classic mid-range support
202.40 — key swing support
200.95 — your main target & trendline confluence
This aligns perfectly with your downward projection.
3. Expected Price Path (Matches Your Drawn Arrow)
Primary Scenario – Bearish Reversal from Supply
Price rejects from 207.0–207.2 zone
Short-term pullback
A lower high forms
Strong D1 bearish leg begins
Targets support layers:
205.39 → 204.30 → 202.40
Final target:
200.95 (trendline support)
This scenario aligns 100% with your chart projection.
4. Why a Deep Correction is Likely
Price is in clear premium relative to the entire 2024–2025 range
D1 supply + strong rejection wick → momentum slowing
Overextended wave structure
RSI / OBV on higher timeframes typically diverge near such peaks
Perfect confluence with the upper diagonal resistance
This makes a correction toward the 200.95 zone not only possible but probable.

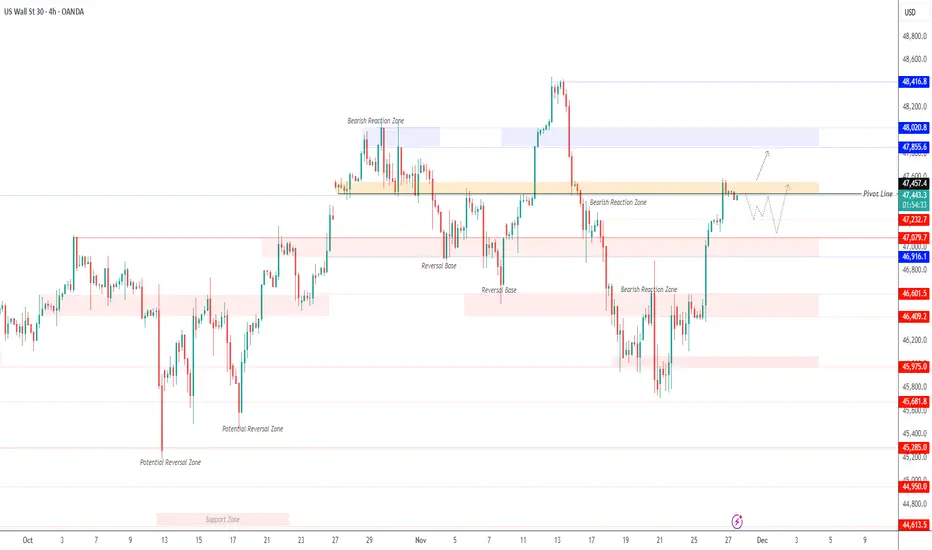
US30: Low Volatility Ahead — Watching 47460 for DirectionOANDA:US30USD pushed up exactly as expected—about 350 points.
Today and tomorrow are expected to remain low-volatility, low-liquidity sessions due to the Thanksgiving holiday in the U.S., which may limit strong directional moves.
Technical Outlook
As long as the price trades below 47460, US30 may continue a bearish correction toward 47240 and 47080.
However, if the market reverses and closes a 1H or 4H candle above 47560, this will signal a continuation of the bullish trend, targeting 47860.
Pivot Line: 47560
Support: 47240 · 47080
Resistance: 47710 · 47860

Gold at a Crossroads( OANDA:XAUUSD XAUUSD) trading inside a descending channel, respecting both the upper and lower trendlines. Price is currently reacting from the upper boundary of the channel, suggesting potential short-term bearish pressure.
1. Price Structure
The market is forming lower highs inside a well-defined downward sloping channel, indicating a controlled corrective structure.
Price recently tested the upper trendline and rejected it, showing sellers defending this zone.
🟡 2. Key Resistance Area (Cluster Zone: 4210–4240)
At the top, there is a strong Fibonacci extension cluster:
1.414 (4212)
1.618 (4240)
This creates a heavy resistance zone, highlighted on your chart as a "Cluster".
If price ever breaks above the descending channel, this area becomes the major upside target, and also a strong potential reversal zone.
🟠 3. Support Zone (4120–4135)
The highlighted rectangle around 4120–4135 represents:
Prior demand zone
Confluence with internal Fibonacci levels
The midpoint area of the channel
This zone is critical.
A break below could open the way toward 4088 / 4068 (your blue levels).
🔵 4. Fibonacci Confluences
Multiple Fibonacci levels align with the current structure:
1.13 (4174) and 1.272 (4193) → Mid-range resistances inside the channel
0.786 (4128) → Matches the support box
0.618 (4105) and 0.5 (4086) → Targets if the market continues downward
These Fibonacci overlaps confirm the importance of the 4120–4135 zone as a turning point.
📉 5. Expected Scenarios
Bearish Scenario (More Likely Short-Term)
Because price rejected the channel top:
Expected drop toward 4128 → 4120 support zone
If broken, continuation toward 4088 → 4068
This matches your hand-drawn orange projection
Bullish Scenario
For bulls to take control:
Price must break the descending channel
Sustain above 4174 → 4193
Target the 4210–4240 cluster
This would be the beginning of a larger bullish structure.
🎯 6. Summary
Gold is currently bearish within a downward channel.
4120–4135 is the key support to watch; its reaction determines the next move.
If it holds → price may bounce inside the channel.
If it breaks → downside continuation toward 4088 → 4068.
If price breaks upward → 4200+ becomes the target zone.


BTC – Price Channel Technical Outlook (1H)1️⃣ Market Structure
- BTC continues to move inside a clean ascending price channel.
- Price has just reached the upper boundary of the channel, which overlaps with a major resistance zone.
- The internal swing structure shows progressively weaker highs, typical of a rising wedge losing momentum.
- Current area is historically where bull traps often form.
2️⃣ Key Zones
🔴 Resistance Zone: 92,000 – 93,000
This zone aligns with the upper channel line → high probability of rejection.
🟩 Support Zone: 86,500 – 87,200
This zone aligns with the bottom channel line → key area for bounce or breakdown.
3️⃣ Main Trading Scenario (Preferred)
🟠 Bearish Wedge Breakdown (High Probability)
- Price gets rejected at channel top / resistance.
- A breakdown occurs through the midline of the channel.
- Price retests the broken channel support → now acting as new resistance.
- Strong continuation down toward the support zone.
- If the wedge fully breaks, larger drop toward 82,000 – 80,000 becomes possible.
➡️ This matches the orange path drawn in your chart.
4️⃣ Alternative Scenario (Low Probability)
🔵 Bullish Breakout Above Channel
Only valid if price closes strongly above 93,000 and holds.
BTC may extend into new highs, forming a short-term parabolic leg.
➡️ This is the light-blue dotted path on your chart.
5️⃣ Additional Signals (As You Requested)
📉 SELL Signals
- Rejection at 92,000–93,000 (red arrow region).
- Break + retest of the channel support (your blue arrow).
- RSI divergence on H1 forming at channel top.
- Weak volume on pushes upward.
📈 BUY Signals
- Bounce from 86,500–87,200 support zone.
- Bullish engulfing candle at the lower boundary of the channel.
- Confirmation only if structure remains inside channel.
6️⃣ Summary
- Structure remains intact inside the price channel, but momentum is weakening.
- The current region is ideal for short setups, especially after a retest.
- Breakdown of the channel could open a large downward move consistent with the rising-wedge pattern you are teaching.
What are your thoughts on BITCOIN? Comment now or join my group to trade with me on description.

CAD/CHF SELLERS WILL DOMINATE THE MARKET|SHORT
CAD/CHF SIGNAL
Trade Direction: short
Entry Level: 0.573
Target Level: 0.570
Stop Loss: 0.575
RISK PROFILE
Risk level: medium
Suggested risk: 1%
Timeframe: 6h
Disclosure: I am part of Trade Nation's Influencer program and receive a monthly fee for using their TradingView charts in my analysis.
✅LIKE AND COMMENT MY IDEAS✅

Bearish reversal for the Fiber?The price has rejected off the pivot and could drop to the 1st support which is a pullback support.
Pivot: 1.1597
1st Support: 1.1512
1st Resistance: 1.1669
Disclaimer:
The opinions given above constitute general market commentary and do not constitute the opinion or advice of IC Markets or any form of personal or investment advice.
Any opinions, news, research, analyses, prices, other information, or links to third-party sites contained on this website are provided on an "as-is" basis, are intended to be informative only, and are not advice, a recommendation, research, a record of our trading prices, an offer of, or solicitation for, a transaction in any financial instrument and thus should not be treated as such. The information provided does not involve any specific investment objectives, financial situation, or needs of any specific person who may receive it. Please be aware that past performance is not a reliable indicator of future performance and/or results. Past performance or forward-looking scenarios based upon the reasonable beliefs of the third-party provider are not a guarantee of future performance. Actual results may differ materially from those anticipated in forward-looking or past performance statements. IC Markets makes no representation or warranty and assumes no liability as to the accuracy or completeness of the information provided, nor any loss arising from any investment based on a recommendation, forecast, or any information supplied by any third party.

Sol continues to hold up strongCRYPTOCAP:SOL is holding up well with only a shallow retracement to the 0.382 for wave (4)- the weekly 200EMA.
Price is above the weekly 200EMA, which is bullish, but lost the pivot, which is bearish, giving the overall pattern ambiguity. Wave C is underway, but looks near completion at wave 4’s expected Fib targets.
🎯 Terminal target for the business cycle could see prices as high as $660 based on weekly pivots
📈 Weekly RSI is bearish with room to fall, but doesn’t often reach oversold.
👉 Analysis is invalidated if we close back below $50, as wave 4 can not go below the 0.5 Fib.
Safe trading

ETH hit my downside target now what?Wave 1 appears to have completed a leading diagonal with a poke above all-time high- what we expect from wave 1. Wave 2 is underway, testing the weekly 200EMA so far, and an expected reversal point- also the 0.382 Fibonacci retracement.
The retracement has been shallow, but ETH was beaten down and undervalued, making a shallow pullback expected. The 0.5 Fibonacci retracement is the next downside target at the S1 pivot.
🎯 Terminal target for the business cycle could see prices as high as $9000
📈 Weekly RSI was oversold with bearish divergence and has now reset below the channel EQ.
👉 Analysis is invalidated only if we get below the wave (4) bottom $1365
Safe trading

BULLISH MOMENTUM ACCELERATES AS DECEMBER RATE-CUT ODDS RISEGold is currently trading around 4140, showing steady bullish momentum as markets increasingly price in a December rate cut. The shift in interest-rate expectations has boosted demand for non-yielding safe-haven assets, and gold is reacting accordingly with firm bidding near key technical levels.
Technical Overview
Support
Key Support: 4109
This zone has been holding well, confirming buyer strength on every dip. As long as price remains above 4109, the short-term structure remains intact and favors continued upside.
First Resistance: 4159
Price is already testing this zone. A clean breakout and candle close above 4159 would open the door for higher targets.
Second Resistance: 4200
This is the next major hurdle. A sustained move above this psychological and technical barrier would indicate strong bullish continuation.
Upside Target
Primary Target: 4220
If gold breaks above 4200 with volume and maintains momentum supported by macro fundamentals, a push toward 4220 is highly probable.
Fundamental Overview
Growing expectations of a Fed rate cut in December are providing strong tailwinds for gold. Lower interest rates reduce the opportunity cost of holding gold, while also putting downward pressure on the dollar—both factors that typically support higher gold prices.
Investor sentiment has turned decisively bullish as they reposition into safe-haven assets amid evolving macro conditions. The combination of softening yields, rate-cut bets, and continued geopolitical uncertainty is strengthening the overall bullish bias.

1:6 Long on BDL BDL is currently sitting on 200EMA which is a long term support, plus near bottom of a tight range. if it breaks out of this range it can quickly move up and reach all time high. Risk is very low compared to reward (We get 1:6 compared standard minimum of 1:2)

Potential 500pips Drop on GBPUSDGBPUSD looks set for what may become its final bearish correction of the year.
Price is currently reacting from a high value supply zone, and the region between 1.3295 – 1.3330 stands out as a refined area to build swing-short positions. From here, I’ll be watching for bearish rejection and intraday confirmations to engage.
My downside projection remains at 1.2870 – 1.2720, which aligns with the next major liquidity pocket and completes a clean corrective leg.
The move is expected to develop from 1st December 2025, with potential continuation through the month and into early next year.
At the moment, I’m short one key confirmation, so I’ll only be risking 60% of my usual position size. If price breaks and closes below 1.3121, I’ll look to add more positions with full confidence.
This setup carries an estimated 7R potential when executed with refined entries.
Trade Safe.
Patience is the Way!
Ieios

NZD Looks Bullish (1D)Considering that the price has tapped an important level, collected a large liquidity pool, and formed an internal CH (iCH), on the pullback toward the lower zones which act as supportive order blocks—we will look for long buy positions.
The entry point, targets, and stop-loss are marked on the chart.
Note that this is on the daily timeframe and may take some time
Do not enter the position without capital management and stop setting
Comment if you have any questions
thank you

A Perfect Buy sentiment is here This is the USDJPY with a good Bullish flag pattern on it ... Before the New York session I believe it's the perfect time to scale in and hold...
Let's envisage bullish move today and tomorrow.

Nifty levels - Nov 28, 2025Nifty support and resistance levels are valuable tools for making informed trading decisions, specifically when combined with the analysis of 5-minute timeframe candlesticks and VWAP. By closely monitoring these levels and observing the price movements within this timeframe, traders can enhance the accuracy of their entry and exit points. It is important to bear in mind that support and resistance levels are not fixed, and they can change over time as market conditions evolve.
The dashed lines on the chart indicate the reaction levels, serving as additional points of significance to consider. Furthermore, take note of the response at the levels of the High, Low, and Close values from the day prior.
We hope you find this information beneficial in your trading endeavors.
* If you found the idea appealing, kindly tap the Boost icon located below the chart. We encourage you to share your thoughts and comments regarding it.
Wishing you success in your trading activities!
