SILVER USDHI GUYS,
well yesterday sells were rejected as there was no entry due to a sudden growth or bullish move.
Today i expect sell soon.
There is a (possible) repetition of the same structure only this time it has to sell on a Wednesday (wed) in 2weeks time.
Community ideas

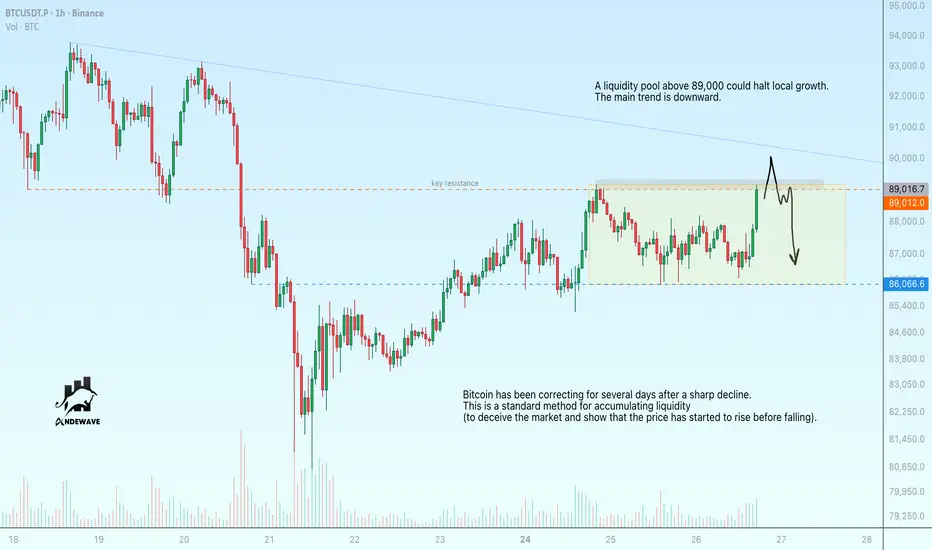
Bitcoin is testing 89,000. False breakout?Bitcoin is testing 89,000
A liquidity pool above 89,000 could halt local growth. The main trend is downward.
Bitcoin is undergoing a correction over several days after a sharp decline.
This is a standard tactic for accumulating liquidity (to deceive the market and show that the price has started to rise before falling).
A false breakout could reverse the local movement from upward to downward and send the price to 86K-83.5K
BTC, ETH, XRP market snapshotBTC — key levels: $82,000 and $98,000.
If we break above $98K, a new all-time high becomes likely. If we move below $82K, there’s a high probability of revisiting the $60K area and entering a crypto winter. For now the market looks uncertain today, so I want to see how things develop. The monthly close is crucial.
ETH — possible local H&S pattern, target around $3,500 (which also aligns with the daily MA50/200 — a trend-change signal). It’s important to hold $2,960 to continue the move.
Strong resistance is at $3,800. Support sits in the $2,500–2,700 zone, which has already been tested — if we revisit it again, the next level opens up around the $2,000 area.
There’s a divergence forming on the 4h timeframe, so a local trend break is possible. For now I’m watching my long positions, with the stop moved to breakeven around $2,800.
XRP still hasn’t played out the divergence on the monthly timeframe. There’s a strong risk of forming a double top if we close below $2, although market makers are still fighting here and we can see a long signal on the daily.
But I still have the feeling we may see another low — and not only on XRP.

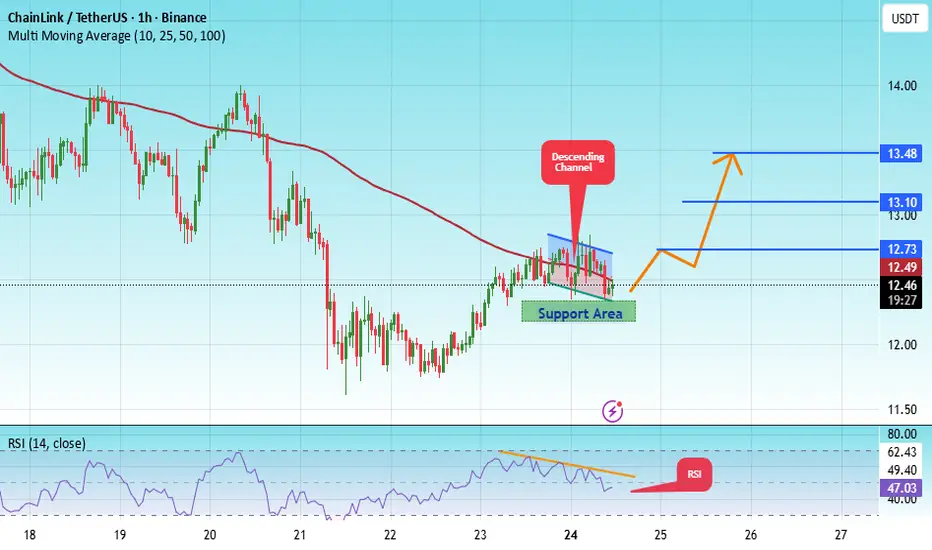
#LINK/USDT LONG SIGNAL#LINK
The price is moving within an ascending channel on the 1-hour timeframe and is adhering to it well. It is poised to break out strongly and retest the channel.
We have a downtrend line on the RSI indicator that is about to break and retest, which supports the upward move.
There is a key support zone in green at 12.27, representing a strong support point.
We have a trend to stabilize above the 100-period moving average.
Entry price: 12.48
First target: 12.73
Second target: 13.10
Third target: 13.48
Don't forget a simple money management rule:
Place your stop-loss order below the green support zone.
Once the first target is reached, save some money and then change your stop-loss order to an entry order.
For any questions, please leave a comment.
Thank you.
volatility clustering"high volatility is often followed by high volatility (and low by low) rather than being randomly distributed"
Markets move in cycles. Using this principle you could some times predict outcomes (regime changes).

Novo Nordisk: The European Giant Challenging Alphabet Novo Nordisk: The European Giant Challenging Alphabet in the Debt Market
By Ion Jauregui – Analyst at ActivTrades
The European corporate debt market closes 2025 with a surprise: Alphabet becomes the largest issuer of euro-denominated bonds of the year, with €13.25 billion placed and 3.1% of the total issued volume. However, the Danish company Novo Nordisk, Europe’s capitalization leader, positions itself as its main competitor, with €12.7 billion in issuances. Interest in both companies reflects the search for defensive and growth assets, but in the case of Novo Nordisk, the fundamentals provide unmatched strength.
Fundamentals: Solid Growth and Structural Demand
Novo Nordisk continues to expand, driven by its flagship drugs for diabetes and obesity (Ozempic and Wegovy), consolidating a business model with exceptional margins.
• Annual growth: over 20%
• Operating margin: above 44%
• Solid cash position: even after investments in production capacity
• Future market: obesity could exceed 1 billion global patients by 2030
The biopharmaceutical company does not issue debt out of necessity, but to finance industrial expansions and capture a rapidly growing healthcare market.
The Debate: Bubble in the Debt Market?
The rise in European issuances, especially from technology and pharmaceutical companies, has led some fund managers to warn of a possible bubble due to concentration rather than valuation.
Unlike other issuers, Novo Nordisk maintains solid fundamentals that justify demand for its bonds, placing it among the safest issuers in Europe.
Technical Analysis: Consolidation with Bullish Bias
Since its all-time highs in June 2024, when it reached €134.14, the company’s stock corrected to a low in August 2025 around €38.09. This Monday, the price showed a technical rebound, closing yesterday at €42 after a week of bullish performance. If the price manages to retake the previous consolidation range, between €53.46 and €61.11, we could anticipate a more significant advance. For now, the stock is near the €42.5 consolidation zone, coinciding with the point of control (POC), a key accumulation and support level.
Technical indicators show mixed signals: the RSI is recovering at 45.06%, while the MACD confirms a positive evolution with the histogram in positive territory. However, the moving average crossover does not yet fully support the bullish trend: the price remains around the 50-day moving average, while the 100- and 200-day moving averages are still sloping downward. In terms of scenarios, if the price fails to hold the annual low, we could see a bearish continuation toward €30. Conversely, if the support, which has been tested three times, holds, a clear upward rebound is possible. According to ActivTrades Europe Market Pulse, market sentiment shows a risk-on bias, although the overall situation remains neutral for now, reflecting caution among investors.
European Benchmark
Novo Nordisk confirms its position as one of the most solid European benchmarks, both in the debt and equity markets. Its structural growth, sustained demand for its treatments, and financial discipline distinguish it from competitors such as Alphabet and Volkswagen. Although technical analysis shows critical support levels that will condition the next price movement, the stock maintains a bullish recovery bias, supported by positive indicators and a market still favorable to controlled risk. Overall, Novo Nordisk combines stability and growth potential, consolidating itself as a defensive and strategic investment for investors seeking exposure to a leading European biopharmaceutical company.
*******************************************************************************************
The information provided does not constitute investment research. The material has not been prepared in accordance with the legal requirements designed to promote the independence of investment research and such should be considered a marketing communication.
All information has been prepared by ActivTrades ("AT"). The information does not contain a record of AT's prices, or an offer of or solicitation for a transaction in any financial instrument. No representation or warranty is given as to the accuracy or completeness of this information.
Any material provided does not have regard to the specific investment objective and financial situation of any person who may receive it. Past performance and forecasting are not a synonym of a reliable indicator of future performance. AT provides an execution-only service. Consequently, any person acting on the information provided does so at their own risk. Political risk is unpredictable. Central bank actions can vary. Platform tools do not guarantee success.

NIfty Probable price projectionIt is clear from the chart that diamond pattern is formed
1. if breaks above may respect the above levels
2.if breaks below may respect the lower levels


TODAY is the day Bitcoin Needs to React and has the strength to HEIKEN ASHI candles on the charts, take out the noise of change and show Trends better.
Bitcoin Daily Chart showing VRVP on the right. The lines mentioned below can offer Resistance, Support.
Horizontal Dashed Yellow - Value Area High VAH currently around 128K usdt
Horizontal Dashed Red - Value area Low VAL currently around 95K usdt
Horizontal Dotted Red line - POC, Point of control currently around 110k usdt
Horizontal Dashed Blue line - Current ATH
Notice the "Pocket" on the right, in the VRVP, just above the VAL. This is a price range that has little Trading volume and tends to attract PA. We are also currently in a little one and PA has risen in it.
The one just above us now, after the VAL line Could Take PA up to the POC around 110k
Likely to meet strong resistance there but PA is Very oversold right now..PA has the ability to push a lot higher
But it is TODAY that we really need to pay attention to.
See the Diagonal lines dropping down from left to right.
These Are FIB CIRCLES> and that Red one is a 236. Those that follow me will understand that I have always said to be careful of them.
And it is THAT that has been dropping PA since ATH.
And TODAY, we need to break through it or face a Stiff push lower.
I think we will break through but that VAL line could be a problem. Nervous day BUT with confidence.
DAILY MACD
MACD has crossed Bullish. WE do need to keep this going to renew sentiment but, as you can see, There is a long way to go before PA become OverBought..THIS alone could take PA back up to the 120k + zone..But there is a LOT of resistance en-route.
But this is a good sign
DAILY RSI
VERY Strong push up from OverSold on the RSI and, again, this shows some very good possibilities ahead as we come to month end.
So, Bitcoin PA has the ability to push high.
The 4 hour Bitcoin chart shows the shorter term
So, here it is...PA pushing up against that 236 Fib Circle, right where the VRVP has a line of resistance.
THIS is why today is so important. WE NEED TO BREAK THROUGH
On this 4 hour chart, you can see how PA is above the POC..that is support if we get rejected off the 236 fib circle.
The VAL is just below that and we bounced off that once before already
So, TODAY, watch this carefully....
In th elonger term, I do not expect BTC PA to Roar up just yet. Thge November candle will close RED, December will be Green as confidence returns and I am thinking that January will be EPIC.
But..we need to break this resistance today...
Hang on You Lot

Is This the Beginning of a New Bull Cycle?Ladies and gentlemen, Bitcoin’s conditions have completely flipped, and if you don’t adapt to the new reality fast, you’re about to leave a lot of profit on the table.
In this analysis, we’re going to look at Bitcoin with zero bias, pure objectivity, and open positions together.
I’m Skeptic, founder of Skeptic Lab . If you want to take your long-term performance to the next level using real psychology, data, and strategy, you’re in the right place.
Let’s start with the daily timeframe 📉
it looks like the pullback is completing. Yesterday’s candle closed extremely bullish, and the odds of the next two daily candles also closing bullish are honestly pretty much. btw Anything upward from here on the daily is just lower highs and a pullback toward 100k. YES, the HWC (weekly) is still in an uptrend, but the daily IS NOT. That doesn’t mean we sit on our hands—we still take longs, but only in lower timeframes and with a completely different risk-management approach (explained below).
🔍 Drop to the 1H for the real triggers.
Yesterday our long trigger fired exactly as planned and gave us a clean +4.35% move (if you missed it, go check yesterday’s analysis). We’ve now reached 91,497.25 and the upper boundary of the 4H ascending channel. From here, two main scenarios: 📍
1. Break of support at 90,892.60 → continuation down to the channel midline, then retest of 88,118.70 support.
2. Break of resistance at 91,497.25 → entry into fresh bullish momentum that can carry us all the way to the next major resistance at 96,066.89 .
Key observation: LWC momentum is strongly bullish. Volume has spiked on the rise and dropped sharply on pullbacks and during consolidation, so the probability of breaking the top is higher right now.
Risk-management difference (this is critical):
- Longs are counter-trend to the daily MWC → we take profit faster and use tighter stops so we can reach target quickly before a single daily candle potentially wipes the whole move.
- Shorts would be with the MWC → we can afford wider risk and scale out with partials.
Volume is our final confirmation here: if we had rising price but decreasing volume on the push to the top → cancel orders. Same rule applies to shorts.
Yesterday, when price rose toward 88,118.70, volume exploded—that was our confirmation, and we entered long.
If this analysis helped you, I’d really appreciate a boost. It keeps the energy coming. 🩵
Now get outta here.

BTC usdHI GUYS,
Every move seemed to work out this week.
currently we are expecting sell today as illustrated .
waiting for bear candle close

AUDJPY: Weak Market & Bearish Forecast
The charts are full of distraction, disturbance and are a graveyard of fear and greed which shall not cloud our judgement on the current state of affairs in the AUDJPY pair price action which suggests a high likelihood of a coming move down.
Disclosure: I am part of Trade Nation's Influencer program and receive a monthly fee for using their TradingView charts in my analysis.
❤️ Please, support our work with like & comment! ❤️

AUD/CAD BEST PLACE TO SELL FROM|SHORT
Hello, Friends!
We are going short on the AUD/CAD with the target of 0.910 level, because the pair is overbought and will soon hit the resistance line above. We deduced the overbought condition from the price being near to the upper BB band. However, we should use low risk here because the 1W TF is green and gives us a counter-signal.
Disclosure: I am part of Trade Nation's Influencer program and receive a monthly fee for using their TradingView charts in my analysis.
✅LIKE AND COMMENT MY IDEAS✅

Lingrid | DOGEUSDT Bearish Continuation After CorrectionBINANCE:DOGEUSDT perfectly played out my previous trading idea . Price is pulling back toward the 0.1600 resistance band, a level aligning with both the downward trendline and the ceiling of the mid-range structure. The latest pullback completed a textbook retest of the broken support-turned-resistance, with price losing momentum as it approached the confluence zone. Given the persistent bearish channel and inability to break the series of lower highs, sellers are showing signs of regaining control.
If downside pressure holds, COINBASE:DOGEUSD is poised to rotate back toward 0.1350, which sits at the lower boundary of the current channel and the origin of the latest bullish correction. This area also marks the primary liquidity pocket where buyers previously reacted aggressively. Broader sentiment remains weak.
➡️ Primary scenario: rejection from 0.1600 → decline toward 0.1350.
⚠️ Risk scenario: a breakout above channel invalidates the bearish view.
If this idea resonates with you or you have your own opinion, traders, hit the comments. I’m excited to read your thoughts!

GOLD retreats slightly, market gains bets on easing cycleOANDA:XAUUSD edged slightly lower after a strong rally yesterday, as the market continued to expand expectations that the Federal Reserve will begin its rate-cutting cycle as early as December. This development occurred despite positive U.S. economic data, indicating that the main support for gold now comes more from monetary policy expectations than from growth signals.
U.S. Treasury yields fell and the U.S. Dollar weakened, with the DXY index down 0.20% to 99.60, helping gold maintain its recovery momentum. Although initial jobless claims fell to 216,000 — the lowest since April — and durable goods orders rose more strongly than expected, these data had little impact on rate-cut expectations.
According to FedWatch, the probability of a Fed rate cut at the December meeting remains near 85%, a sharp increase from below 30% last week.
Geopolitical conditions, however, are shifting in a direction less supportive of gold. Signs suggest Russia and Ukraine are moving closer to a de-escalation agreement, with consultations in Geneva and positive remarks from both sides reducing the geopolitical risk premium that has supported gold for months. A Russian adviser told Al Jazeera that the U.S. plan contains “many positive aspects,” implying that diplomatic progress may be approaching.
Even so, the Fed’s policy outlook remains the dominant driver. JPMorgan Chase has reversed its forecast and now expects the Fed to cut rates in December instead of delaying until January. Michael Feroli’s economics team cited dovish comments from key Fed officials — especially New York Fed President Williams — as the reason for the shift. JPMorgan had previously expected the Fed to stay put after the September jobs report.
A new variable also attracting attention is the selection process for the next Fed Chair. Bloomberg reports that White House economic adviser Kevin Hassett — seen as dovish — has emerged as a leading candidate. The likelihood of a more dovish Fed leadership further strengthens expectations of rate cuts, pressuring the dollar and supporting gold. Treasury Secretary Bessant said the nomination could be announced before Christmas.
Overall, markets perceive that the key question now is how quickly the Fed can implement the rate-cutting cycle. Karl Schamotta of Corpay noted that markets are leaning toward expectations of more aggressive easing. In a similar move, Deutsche Bank raised its 2026 gold price forecast to 4,450 USD/oz, based on steady investment inflows and rising central bank gold-reserve demand.
While geopolitical risks appear to be easing, the outlook for U.S. monetary policy continues to be the primary driver shaping gold’s direction in the short and medium term.
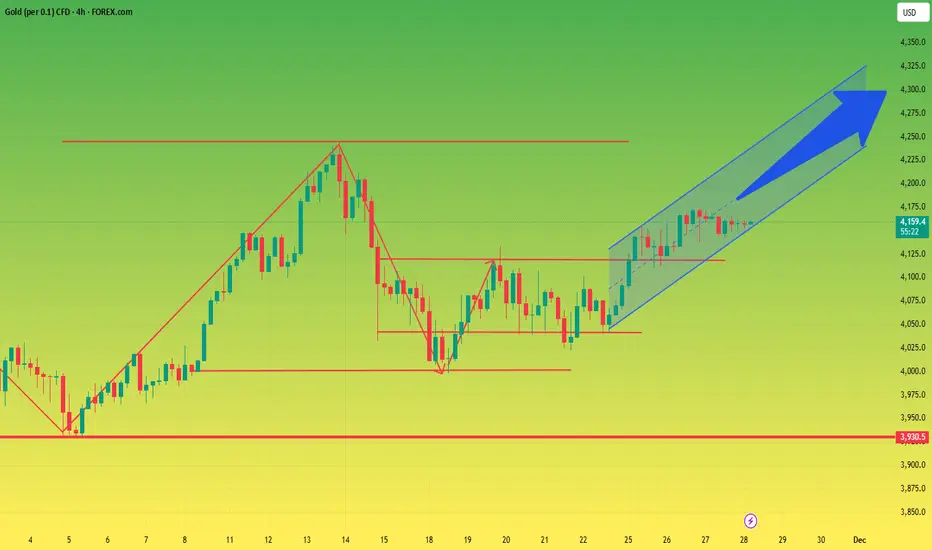
Technical Analysis OANDA:XAUUSD
Gold price is maintaining the main uptrend on the daily timeframe, still moving within the ascending channel established since August. The latest session closed around 4,147 USD/oz, trading above the short-term MA21 and approaching the technical resistance zone at 4,128 (Fib 0.236) and the major resistance at 4,216 USD.
• Structure: Series of higher lows + rising channel intact → underlying trend remains bullish.
• Key support: 3,972–4,000 USD (Fib 0.382 + channel lower boundary/MA21). If this zone holds, the bullish outlook remains valid.
• Short-term resistance: 4,128 USD (Fib 0.236). A breakout above this level opens the path toward 4,216 USD and beyond.
• Momentum: RSI rebounded from the neutral zone → buying pressure has returned but remains moderate; no clear bearish divergence.
• Conclusion: Market structure remains bullish, but confirmation is needed via a breakout above 4,128 USD to validate a new bullish cycle.
Summary:
The main trend is still upward, but the market is awaiting a confirmed breakout of the 4,128–4,216 USD zone to enter a strong bullish phase. If price falls below 3,972–4,000 USD, the plan should be reassessed due to the risk of a pullback toward the 3,846 zone (Fib 0.5).
Trading Plan
SELL XAUUSD — 4195–4193 ⚡️
Stop Loss: 4199
Take Profit 1: 4187
Take Profit 2: 4181
BUY XAUUSD — 4109–4111 ⚡️
Stop Loss: 4105
Take Profit 1: 4117
Take Profit 2: 4123

GBPJPY H1 | Bullish Continuation Off Key SupportMomentum: Bullish
Price is currently above the ichimoku cloud, and there is an ascending trendline present.
Buy entry: 205.949
- Overlap support
- 61.8% Fib retracement
Stop Loss: 205.211
- Swing low support
Take Profit: 207.170
- Multi-swing high resistance
High Risk Investment Warning
Stratos Markets Limited (tradu.com/uk ), Stratos Europe Ltd (tradu.com/eu ):
CFDs are complex instruments and come with a high risk of losing money rapidly due to leverage. 70% of retail investor accounts lose money when trading CFDs with this provider. You should consider whether you understand how CFDs work and whether you can afford to take the high risk of losing your money.
Stratos Global LLC (tradu.com/en ): Losses can exceed deposits.
Please be advised that the information presented on TradingView is provided to Tradu (‘Company’, ‘we’) by a third-party provider (‘TFA Global Pte Ltd’). Please be reminded that you are solely responsible for the trading decisions on your account. Any information and/or content is intended entirely for research, educational and informational purposes only and does not constitute investment or consultation advice or investment strategy. The information is not tailored to the investment needs of any specific person and therefore does not involve a consideration of any of the investment objectives, financial situation or needs of any viewer that may receive it. Past performance is not a reliable indicator of future results. Actual results may differ materially from those anticipated in forward-looking or past performance statements. We assume no liability as to the accuracy or completeness of any of the information and/or content provided herein and the Company cannot be held responsible for any omission, mistake nor for any loss or damage including without limitation to any loss of profit which may arise from reliance on any information supplied by TFA Global Pte Ltd.

Continue to buy gold after the market opens!After a steady rise this week, gold prices have been consolidating near resistance levels, with trading range narrowing. As market expectations rise for another Fed rate cut in December, coupled with increased anticipation of regional peace negotiations, global market sentiment has become more optimistic, prompting some funds to flow from gold into risk assets. The US economic data released this week were mixed, but overall did not change the market's judgment on the Fed's policy path. The cross-cutting performance of economic data reinforced market expectations of further Fed rate cuts in December, causing the dollar index to fall to a one-week low and continuing to be a significant supporting factor for gold.
From the combined perspective of interest rate expectations, dollar performance, and technical structure, this round of gains is very healthy. If subsequent economic data continues to support rate cut expectations, gold still has the potential to resume its upward trend after a pullback to key support. However, it should be noted that repeated fluctuations in the expected peace negotiations could bring additional volatility.
In terms of strategy, we can continue to maintain a buy-on-dips approach! After the market opens, you can buy in batches in the 4125-4150 range, with the first target at 4165. If it successfully breaks through 4170, the upside potential will be further opened up, and it is expected that the stalemate will be broken on Friday.
The above represents only my personal thoughts. If you find it helpful, please like and follow to show your support! Please note that any strategy is time-sensitive, and strategies will change as market conditions evolve. I will notify you in the channel based on the actual market situation!

BTCUSD Buy dip Price swept liquidity below support and instantly got bought up. Flip zone held strong, confirming buyers are defending this area. This is a classic retest bounce with momentum shifting bullish.
⚠️ Disclaimer: For educational purposes only. Trade at your own risk.

AUD/USD: Strong Support Fuels Bullish MomentumCurrently, AUD/USD is testing the strong support at 0.6465, with the price sitting at 0.64990. After touching this support level, the market could rebound strongly due to the solid consolidation trend and support from lower levels.
Technical Analysis:
The chart shows that AUD/USD is in a consolidation pattern, with strong support at 0.6465. If the price maintains above this support, AUD/USD could continue its bullish momentum, aiming for the next resistance level at 0.6540.
News Factor:
The weaker-than-expected CPI (Consumer Price Index) data in the U.S. has increased the likelihood that the Federal Reserve (Fed) will cut interest rates in December. This provides favorable conditions for risk assets like AUD/USD. The Australian Dollar benefits from the weakening USD as investors expect the Fed to reduce rates, boosting demand for the Australian Dollar.
Next Scenario:
If AUD/USD stays above the 0.6490 support level and does not drop below 0.6465, there is a high probability of breaking the 0.6540 resistance level and continuing upward.

(Gold) on the 1H timeframe.Price is currently trading near 4147 after rejecting multiple times from the upper resistance zone around 4170–4175 (BSL zone).
This area appears to be a liquidity region where buyers previously tried to push higher but failed to sustain momentum.
On the lower side, a strong support zone is marked around 4120–4130 (SSL zone), indicating a possible liquidity sweep if price breaks below.
Projected movement is drawn with two potential scenarios:
1. Bearish path:
Price may attempt to move lower towards 4135 → 4125 → SSL 4120, clearing liquidity before a possible reversal.
2. Bullish recovery path:
If buyers hold the mid-range and regain momentum, price could retest 4160 → back into 4170–4175 BSL zone, where further rejection or breakout will decide continuation.
Summary
• 4170–4175 = Major Resistance / BSL Zone
• 4120–4130 = Support / SSL Zone
• Market is currently in a range with liquidity targets on both sides
• Break and close outside of either zone may define the next trend leg

XAUUSD-Bullish Channel Bounce SetupGold currently moves inside an ascending channel. Price is holding above the 4,150 support zone. If this support holds, we may see a bullish bounce toward the upper channel levels 4190

I will go long on gold at $4125-$4150.With the week drawing to a close, let's review our trading performance. Overall, we've maintained a profitable trend. Since the market opened on Monday, we bought at the low point and the price of gold rose all the way up. We continued to buy on dips and the price continued to fluctuate upwards. Our trading strategy remained to buy on dips until the price approached the key resistance area and then entered a consolidation phase.
After a period of steady rise, gold prices have been fluctuating narrowly around previous highs recently, with the range of fluctuation gradually narrowing. Market expectations for a further rate cut by the Federal Reserve in December continue to rise, coupled with a positive outlook for geopolitical peace negotiations, which has boosted global risk appetite. Some funds have shifted from safe-haven assets to risk assets, putting some downward pressure on gold prices in the short term. Although the US economic data released this week showed a mixed picture, it did not significantly change the market's overall assessment of the monetary policy path. The structural discrepancies in the data reinforced expectations that the Federal Reserve would maintain its accommodative stance, causing the dollar index to fall to a one-week low and providing strong support for gold.
Considering the interplay of interest rate expectations, the US dollar exchange rate, and technical patterns, this round of price increases has strong fundamental support and a healthy structure. If subsequent economic data continues to indicate a slowdown in growth momentum, reinforcing expectations of interest rate cuts, gold prices may resume their upward trend after a pullback to test key support levels. However, we must be wary that uncertainties in geopolitical developments could trigger fluctuating market sentiment, thereby exacerbating short-term volatility.
Strategically, it is recommended to continue the approach of buying on dips. After the market opens, positions can be established in batches within the 4125-4150 range, with the first target at 4165; if the 4170 level is effectively broken, further upside potential will open up. The market is expected to break out of its current consolidation pattern on Friday and make a directional choice.
The above are my personal thoughts! If they are helpful to you or you agree with my ideas, please like and follow to support me! All strategies have a limited lifespan. While referring to them, it's also important to closely monitor market changes. I will respond flexibly based on actual market fluctuations, and I will provide specific updates in the channel!
XAUUSD – Gold scenario awaiting trend confirmation at the 4...XAUUSD – Gold scenario awaiting trend confirmation at the 4,160–4,170 zone
Currently, gold has not shown a clear enough medium-term trend. The price is fluctuating around an important resistance zone, so instead of predicting the market, I wait for price reactions at key zones before making a decision.
Today's main axis is the 4,160–4,170 zone – where the market will choose to continue the upward trend or start a deeper correction.
🎯 Scenario 1 – SELL AT RESISTANCE 4,162–4,165 (PREFERRED IF NO CLEAR BREAKOUT)
Sell: 4,162 – 4,165
SL: 4,173
TP: 4,140 – 4,122 – 4,110 – 4,100
The 4,162–4,165 zone on H1 is resistance coinciding with fibo + supply zone near the old peak, also close to the short-term uptrend line.
If the price hits this zone and shows signs of weakening (upper shadow, reversal candle, unsupported volume), I prefer to sell short down to the 4,140 zone, deeper possibly to the liquidity cluster around 4,110–4,100 as shown on the chart.
The risk for this scenario is limited to 1–2% of the account, absolutely no holding the order if the price closes above 4,173.
⭐️ Scenario 2 – BUY WHEN PRICE BREAKS THE PEAK, CONFIRMING CONTINUATION OF THE UPWARD TREND
Buy: 4,171 – 4,173 (after clearly breaking the old peak)
SL: 4,163
TP: 4,188 – 4,200 – 4,215
In case the price decisively breaks the 4,170 zone and holds above it, this is a signal confirming the buyers continue to control. At that time, I switch bias to buy according to the breakout, targeting the higher resistance zone around 4,200–4,215, further expansion possible if the upward momentum is maintained.
Note: only Buy when the breakout is real – large body candle, closing above the 4,170 zone, not a stop sweep then sharply pulling back down.
1. Basic context
The DXY index is slipping below the 99.50 mark, currently around 99.45, indicating continued downward pressure as the market increases expectations for the Fed to cut interest rates in December.
General monetary easing expectations support gold, as the opportunity cost of holding gold decreases.
However, initial US jobless claims have fallen to the lowest level since April, indicating the labor market is still quite strong. This may cause investors to struggle between expectations of rate cuts and the actual strength of the US economy, creating "jerky" fluctuations around news release times.
In summary, the fundamentals are slightly leaning towards supporting gold, but not enough to completely ignore technical adjustments.
2. Technical analysis & price structure
On the H1 frame, after the recent strong increase, gold is creating an accumulation zone just below the 4,160–4,170 resistance.
The 4,162–4,165 zone is a confluence area: horizontal resistance + old supply zone + price zone where strong selling pressure previously appeared.
The 4,140 zone is the "confirmation of adjustment decrease" threshold – if breached and the price closes below here, the market is likely to want to return to the large liquidity cluster around 4,110–4,100, where many Buy stop losses are waiting.
Therefore, the current structure allows for two-way trading, but each scenario requires clear confirmation from price behavior at the 4,160–4,170 zone before entering an order.
3. Market sentiment & action plan
Both buyers and sellers are looking at the same price zone – 4,160–4,170. This makes this area likely to become a thick liquidity zone, where stops from both sides can be "swept" before the market chooses the real direction.
If the price drops sharply from this zone, it is likely a sell-off phase of late Buy orders near the peak.
Conversely, if buyers are strong enough to keep the price above 4,170, many Sell orders will be trapped, creating momentum for a short squeeze to higher resistance zones.
My plan:
Do not enter orders in the middle of the zone, only wait:
Sell at 4,162–4,165 if clear reversal signals appear.
Buy at 4,171–4,173 after the price breaks the peak and holds above this zone.
Always set a hard SL, do not widen the stop when the order goes against.
If the price strongly breaks both scenario zones without giving clear signals, I accept to stay out, wait for a new structure, do not try to "guess the direction".
I always read feedback to optimize sharing in future posts.
