USDJPY: Trend Analysis.Hello everyone,
USDJPY is trending on a momentum upward rise. the pair have been on ascending channel for some couple weeks, benefiting the traders who hold on long position. in regards to the 1hour chart formation, it is showing a lower high and lows structure, which the price is gradually heading towards the next high.
Key points;
A clear retracement below the high, would set off downward move to the next low at 155.33
Meanwhile the best alternative at this point, is to buy at the lows and sell at the highs.
Thanks for reading.
Community ideas

BTC Inverse H&S pattern. BTC forming a clear inverse head-and-shoulders on the 4H chart. Neckline breakout above $87,000 targets ~$96,400.

Palantir - A devastating -40% drop!🤬Palantir ( NASDAQ:PLTR ) will create a major correction:
🔎Analysis summary:
After a textbook bullish break and retest in mid 2024, we witnessed a parabolic rally on Palantir. During the entire rally, we only witnessed one red candle, which clearly shows some significant overextension. Therefore, Palantir will create a major correction now.
📝Levels to watch:
$200 and $100
Phil - @SwingTraderPhilTV
SwingTrading.Simplified. | Investing.Simplified. | #LONGTERMVISION

#ERAUSDT #1D (Bitget Futures) Descending channel on support LONGCaldera just printed a morning star on daily with good bounce back volume, bottom seems likely.
⚡️⚡️ #ERA/USDT ⚡️⚡️
Exchanges: Bitget Futures
Signal Type: Regular (Long)
Leverage: Isolated (1.3X)
Amount: 4.8%
Current Price:
0.2508
Entry Zone:
0.2503 - 0.2187
Take-Profit Targets:
1) 0.3245
2) 0.3921
3) 0.4598
Stop Targets:
1) 0.1593
Published By: @Zblaba
EURONEXT:ERA BITGET:ERAUSDT.P #1D #Caldera #RaaS #Rollups #DeFi caldera.xyz
Risk/Reward= 1:1.2 | 1:2.1 | 1:3.0
Expected Profit= +49.9% | +87.4% | +124.9%
Possible Loss= -41.7%
Estimated Gaintime= 1-2 months

Gold came down to a support zone and you took a buy. SL is belowThis is a GOLD (XAU/USD) chart from TradingView.
• The market was falling earlier, shown by the blue down-trendline.
• Price broke above the trendline, then pulled back.
• You marked a red zone (support area) where price previously reacted.
• Price came back into this support zone and bounced slightly.
• A buy setup is drawn:
• Entry around 4152
• Stop-loss (SL) around 4139
• Take-profit (TP) much higher (large green box on the top) 4175

GBPUSD still bullish expecting
FX:GBPUSD what's next, trend based analysis, we can see break of RECTANGLE, on top line of rectangle we have created and TRIANGL pattern.
From here having still bullish expectations.
SUP zone: 1.31600
RES zone: 1.33400, 1.33800

EURUSD – Monitoring Reaction at Trendline StructureThis chart highlights a descending structure on EURUSD, where price is approaching a dynamic trendline.
The recent upward move may retest the upper boundary of the channel before showing its next reaction.
If the market respects this structure, a continuation of the existing momentum could develop.
This idea is shared for market observation and educational analysis only.

EURUSD → Formation of an intermediate bottom...FX:EURUSD is forming a consolidation, which hints at a halt in the downward correction. The market is waiting for news that could trigger strong movements...
The dollar is pausing and moving into consolidation. If the index enters a correction phase, the euro will go up. A breakout of 1.155 could confirm a change in the local trend and trigger a rally.
The price is trading within a downward price channel; locally, the market is not ready to update the low and is consolidating above 1.150 and 0.7f. Accordingly, the focus is on the current consolidation: 1.150 - 1.155
Resistance levels: 1.155, 1.1606
Support levels: 1.1524, 1.1502, 1.1473
The price is currently consolidating, which means that the market is preparing for possible movements. A breakout of one or another boundary could trigger a rally. A breakout of resistance will confirm a change in the local trend. However, a breakout of support could trigger a continued decline to 1.1473.
Best regards, R. Linda!

“BOS Confirmed — Demand Retest for Next Bullish Leg🟡 GOLD (XAU/USD) – Bullish Continuation Setup from High Probability Demand Zone 🆙
🔍 Chart Breakdown & Key Insights
Price created a Break of Structure (BOS) to the upside → confirming bullish momentum ✔️
Retested the Demand Line + Support Zone → buyers defending strongly 💪
High Probability POI (previous accumulation zone) remains valid with liquidity swept below → smart money accumulation evidence 💰
Current pullback = healthy retracement into demand before potential continuation
🎯 Targets (With stickers)
🎯 Target Zone Price Region Sticker
TP1 → Retest recent high 4,165 – 4,175 🎯
TP2 → Liquidity above highs / extended target 4,180 – 4,195 🚀💸
TP1 hit possibility is HIGH due to bullish structure 📈
TP2 depends on strength of breakout ⬆️
📌 Trade Idea (High Probability Setup)
🟩 Buy Entry Zone:
➤ 4,120 – 4,130 (pullback entry at support)
🟢 Take-Profit:
➤ TP1: 4,170 – TP2: 4,190
📊 Risk-Reward Ratio: 1:2.5 – 1:3+ ✔️
🧭 Market Structure Sentiment
Factor Outlook
Trend Bullish 📈
Liquidity Upside still available 💧
Smart Money behavior Accumulation & continuation expected 💼
⚠️ Just watch if price breaks below the demand line → would weaken this bullish plan.

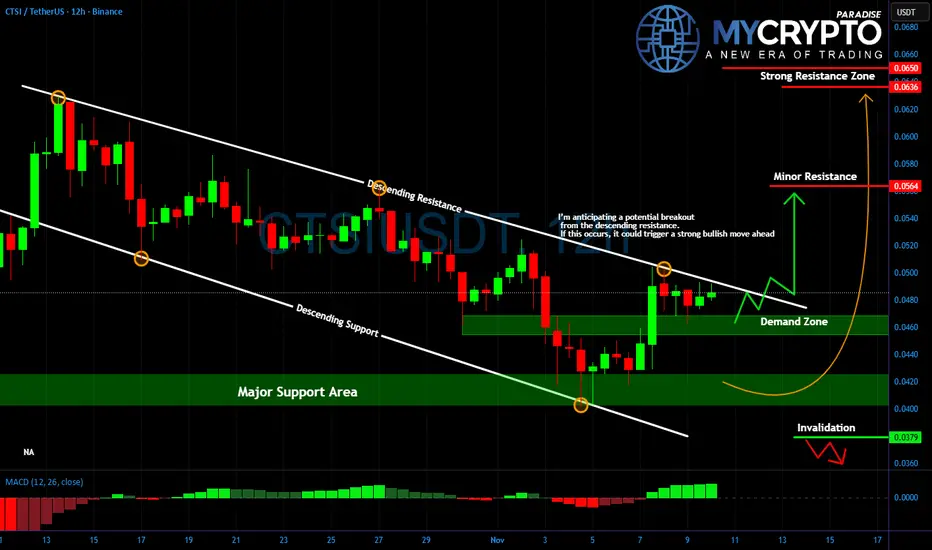
CTSI About to Explode or Fakeout Incoming?Yello Paradisers is CTSI finally ready to break out, or are we looking at another trap to wipe out emotional traders?
💎#CTSIUSDT has been moving inside a clean descending channel, respecting both support and resistance levels. The price recently bounced strongly from the key demand zone around $0.041 to $0.044, showing clear signs of accumulation. Now, price is approaching the descending resistance, where a confirmed breakout could change the game entirely.
💎A clean break and daily close above the $0.050 level would likely trigger bullish momentum, with short-term upside toward the 0.056 area. If this level gets cleared, the real target lies at 0.063 to 0.065, which marks a strong resistance zone and a likely exit area for smart money.
💎However, it's important to stay focused. Until the breakout is confirmed, this move remains unverified. Many traders get caught in fakeouts by rushing in too early. A move below $0.0379 would invalidate the bullish setup entirely, and at that point, the bias shifts back to the downside.
Discipline, patience, robust strategies, and trading tactics are the only ways you can make it long-term in this market.
MyCryptoParadise
iFeel the success🌴
CHFJPYThis analysis is based on the same thing as my previous analysis of Cadpy regarding the 1D price slowdown as a fundamental reason to enter the market in a bullish manner.

Ethereum Breakout Done! Let's Go Ethereum has been consolidating inside a curved pattern since mid-November, and despite the recent downside move, the pattern remained valid. Yesterday the market retested the bottom of this curve and finally broke out of it. Now we just need the breakout to hold for the next one or two days to confirm it's not a fake move.
If it sustains, a fresh upside impulse can start — the same move I mentioned on November 15, where I expected Ethereum to target around $6000 in the coming months. Those who lost hope should remember that the market rarely follows emotions; it follows structure. Trust the charts, not the noise.
For more free and timely updates, follow and support the ideas. Thank you.

CRWV: A patient planCRWV:
.
A patient plan
Will you be patient enough to catch this plan?
.
US STOCKS- WALL STREET DREAM- LET'S THE MARKET SPEAK!

Breaking: Pasithea Therapeutics Corp. (KTTA) Up 117% YesterdayPasithea Therapeutics Corp. (NASDAQ: NASDAQ:KTTA ) stock saw a noteworthy uptick of 117% amidst market dip. The stock bounced from the $0.30 support to claim the $1 resistant albeit market turmoil.
With the RSI at 67, the stock is looking poised for a continuation trend should it break the 38.2% fib level. On a bearish tone, the asset is down 12% in Thursday's premarket trading.
In another news, Pasithea Therapeutics Announces Completion of Cohort 7 in Ongoing Phase 1 Trial of PAS-004 in Advanced Cancer Patients, with Positive Safety, Pharmacokinetic (PK), and Pharmacodynamic (PD) Data
About KTTA
Pasithea Therapeutics Corp., a clinical-stage biotechnology company, focuses on the discovery, research, and development of treatments for central nervous system (CNS) disorders, RASopathies, and cancers. Its lead product candidate is PAS-004, a next-generation macrocyclic mitogen-activated protein kinase, or MEK inhibitor to treat a range of RASopathies, including neurofibromatosis type 1 (NF1); MAPK pathway-driven tumors, such as BRAFv600 and BRAF fusion tumors; and ETS2 driven diseases, including inflammatory bowel disease (IBD).

EURAUD LOCAL LONG|
✅EURAUD has tapped the higher-timeframe demand after clearing sell-side liquidity, signaling a potential bullish reversal. If displacement confirms, algos may drive price toward the next buy-side liquidity target above. Time Frame 3H.
LONG🚀
✅Like and subscribe to never miss a new idea!✅

Elliott Wave Analysis XAUUSD – 27/11/2025
1. Momentum
D1:
D1 momentum is contracting and preparing to reverse. We need to wait for today’s daily candle to close to confirm the reversal signal. If confirmed, the market may enter a downward phase lasting around 4–5 days.
H4:
H4 momentum continues to decline and is approaching the oversold zone. This indicates that the current downward move is weakening, and a corrective bounce is likely once H4 momentum reverses in the oversold area.
H1:
H1 momentum is also decreasing and moving toward the oversold zone. Therefore, we expect a mild bounce once H1 momentum turns upward.
________________________________________
2. Wave Structure
D1:
The wave structure on H4 remains unchanged from previous analysis. The key difference is that D1 momentum has now contracted and shows signs of reversal, strengthening the scenario of a continuation of the purple Y wave. The completion of this Y wave will likely align with the moment D1 momentum descends into the oversold zone and reverses.
H4:
On the H4 timeframe, the blue ABC corrective structure is close to completion, and the market is currently in the final stage of wave C.
Based on H4 momentum reversal cycles, a series of lower highs and lower lows suggests that the ABC structure is likely complete and price is in the final phase of wave Y.
H1:
On H1, a 5-wave black structure is forming. In yesterday’s analysis, I presented two scenarios and explained the characteristics of each. With D1 momentum now reversing, I am leaning toward the scenario where the 5 black waves represent the C wave of the blue structure.
Yesterday’s targets for wave 5 (black) and wave C (blue) were truncated — price only reached 4173.8 and failed to touch 4184. Since then, the market has been moving sideways within a wide range.
Key observations:
• Price rose but failed to break the 4173.8 high.
• Price later dropped near 4137.
• RSI showed bearish divergence from wave 3 (black): price made higher highs while RSI made lower highs → suggesting wave 5 likely completed as an Ending Diagonal.
At this stage, I want to see price break below 4137 before H4 momentum reverses upward. This would provide additional confirmation that the ABC corrective structure has completed.
The 4058 zone continues to be a strong liquidity area to look for sell entries under the assumption that wave 5 has finished.
________________________________________
3. Trading Plan
Sell Zone: 4158 – 4160
SL: 4178
TP1: 4081
TP2: 4020
TP3: 3958

Momentum is fading — watch the breakdown.🔎 CURRENT MARKET ANALYSIS & TODAY’S EXPECTED MOVEMENT 🔎
The market is currently moving within a Rising Wedge structure – price pushes higher but momentum weakens, volatility narrows, and the probability of a bearish breakdown increases significantly.
📌 SETUP 1 – SELL ZONE (Primary Setup)
XAUUSD SELL: 4203 – 4206
✔️ Take Profit: 4200 – 4195
❎ Stop Loss: 4210
➡️ Use proper risk management as always.
📌 SETUP 2 – BUY ZONE (Secondary – Only with confirmation)
XAUUSD BUY: 4109 – 4112
✔️ Take Profit: 4115 – 4120
❎ Stop Loss: 4105
➡️ BUY only if price reaches this zone with a clear bullish reversal signal.
1. Current Market Situation
📉 Price Structure
- Price is nearing the upper boundary of the Rising Wedge.
- Newly formed highs are weakening → buyers are losing strength.
- Recent candles show long upper wicks, indicating heavy selling pressure at resistance.
- The lower support line has been tested multiple times → higher probability of a breakdown.
➡️ Key signal: buyers are losing control while sellers are gradually positioning.
2. Main Scenarios for Today
✅ Scenario 1 (Preferred) – Price breaks the lower edge of the Rising Wedge
- If a candle closes below the support zone, the market is likely to:
- Drop quickly towards the next support levels.
- Sellers will enter strongly when price retests the broken support (now acting as resistance).
🔔 This is a confirmation SELL signal.
🎯 Downside Targets:
TP1: nearest support zone
TP2: previous swing low of the pattern
TP3: deeper structure support (depending on your timeframe)
⚠️ Scenario 2 – Price holds above support but moves weakly
If price only bounces slightly from the lower wedge boundary but cannot break the upper edge:
- Market remains weakly bullish, fragile and easily pushed down.
- Not suitable for chasing BUY positions.
- Buyers need a strong breakout above the wedge’s upper boundary to reverse the structure, which is less likely.
3. Intraday Trend
⭐ Intraday bias: DOWN – or at least a corrective decline.
Signs supporting the bearish bias:
- The nearer price gets to support, the easier it becomes to break.
- Volume is weak during upward moves → insufficient buying pressure.
- Sideways movement is tightening → preparing for a breakout.
- Sellers are waiting for a clean retest to enter.
4. Conclusion
- The market is approaching the end of a Rising Wedge – a bearish reversal pattern.
- Priority strategy: Watch for breakdown → wait for retest → SELL.
- Avoid chasing BUYs; reversal risk is high.
Most probable development today: Support break → Retest → Continuation down
What are your thoughts on XAUUSD? Comment now or join my group to trade with me on description.

Lingrid | AUDJPY Potential Rebound from Key ResistanceFX:AUDJPY perfectly played out my previous trading idea . Price is moving toward the 102.300 resistance. It is attempting to extend higher but market may drop if it fails to secure a breakout above the previous weekly high (PWH), signaling exhaustion from buyers right at a major confluence area. The pair is now showing early signs of fading momentum.
If this rejection holds, price is likely to rotate downward toward 101.510, which aligns with the local support shelf and the mid-line of the ascending structure. A deeper extension toward remains possible if risk sentiment weakens or if JPY strength accelerates — especially with markets shifting cautiously ahead of key Asia-Pacific data.
➡️ Primary scenario: rejection from 102.300 → decline toward 101.510.
⚠️ Risk scenario: a clean break above 102.300 would invalidate the bearish view and reopen the path toward 103.000 inside the upper resistance channel.
If this idea resonates with you or you have your own opinion, traders, hit the comments. I’m excited to read your thoughts!

Is Bitcoin Going To 100k? Well now that volatility is back to normal and all bulls are scared and after bein g liquidated twice in a row is TIME for bear to dance to the bulls rhythm at least to the $98k once the weekly closes.
If we have a bullish 4hrs chart with higher high and higher low that will mark the start of the Daily Bullish Cycle with a target of $97k.
Buckle up ladies and gentlemen you've been invited to the bulls party.

The gold short-selling strategy was executed flawlessly!Gold Technical Analysis: Due to Thanksgiving, the overall intraday volatility was not significant, mainly fluctuating within the 4140-4170 range, which was largely in line with my expectations. There was a slight dip in the Asian session, and I anticipated a drop to the 4130-3120 range, but it failed to break below 4140. With the US market closing early, the volatility is likely to be even smaller. Tonight, the overall strategy is still to treat it as a range-bound market. Before breaking 4175, the strategy is to sell on rallies, or simply observe, as the market movement is not significant and not very meaningful.
From the 4-hour chart, the gold triangle consolidation pattern remains unchanged. The downward trendline resistance is at 4170-4175. Only a valid break above this trendline resistance can lead to further upward movement and a new round of opportunities. Otherwise, it remains a consolidation phase at the end of the consolidation. On the 1-hour chart, the price has started to slowly break below the short-term support zone and is now under pressure from the short-term moving averages. There may be some room for adjustment in the short term. Pay attention to the short-term adjustment and repair. Today, continue to focus on the resistance level of the upper trendline of the triangle, which is also the watershed between bulls and bears. If the resistance is effective, expect a pullback. In this case, we still need to continue to try to establish short positions. If there is a rebound to around 4170-4175, we can short. In summary, today's gold trading strategy is to primarily sell on rallies and secondarily buy on dips. The key resistance level to watch in the short term is 4170-4175, and the key support level is 4110-4100. Please follow the rhythm.

Buy after a pullback. Target price: 4200.From the daily chart perspective, gold has now returned above the moving average band, indicating a recovery in short-term bullish sentiment. While the sustainability of the rally remains to be seen, technical patterns suggest that prices may further test the resistance level of 4170-4180. If this level is broken, the next key resistance level to watch is the upper edge of the range at 4200-4210.
It's worth noting that due to the Thanksgiving holiday in the latter half of this week, market activity has slowed, potentially increasing the risk of abnormal price fluctuations due to insufficient liquidity. Range-bound trading may be the most reasonable scenario at present.
From the 4-hour chart, gold is expected to maintain a high-level consolidation pattern in the short term. The key support level to watch is the 4130-4120 area, which is also where the 5-day and 10-day moving averages intersect and can serve as a short-term dividing line between bullish and bearish trends.
The first resistance level is at 4180-4190. Only after a successful breakout can the space to reach the 4200 level be opened, but this may require the support of positive fundamental factors.
In summary, given the special market environment during the holiday, the recommended strategy is to primarily buy on dips, but strict position control is necessary to mitigate the risk of sudden fluctuations. Key short-term resistance is expected in the 4180-4200 area, while key short-term support is around 4130. Overall, caution is advised, and investors should be wary of the risks associated with market manipulation in a low-liquidity environment.
Trading Strategy: Buy on dips to 4140-4150, with a stop-loss at 4130 and a target of 4200.
I will adjust the strategy flexibly based on market fluctuations and update the information in the channel.

Long Reversal Trade off SupportPrice has rebounded from a major support zone around $80,860 and is pushing back above the minor level near $91,970. The trade setup goes long, aiming for a move toward the next significant resistance at $101,100. The stop is positioned below the recent swing low, capturing a potential trend reversal after a sharp sell-off.
