Gold (XAU/USD) – Sell Setup to Fill New FVGGold formed a strong bullish leg, creating a new fair value gap (FVG) on the move up. Unlike the previous imbalance, this new gap has not yet been fully filled, meaning the market still has unbalanced price action below.
When an FVG remains open, price often retraces to fill it before continuing the trend.
After forming this gap, momentum slowed and buyers failed to push higher, showing weakness at the top of the move.
📌 Idea: Price may now fall to fill the unbalanced zone below.
🎯 Target: The new FVG
🛡 Stop Loss: Above recent high
This setup is based on the principle that the market often returns to fill inefficiencies before deciding the next direction.
Community ideas

XAUt forming the next major wave XAUt is forming its 5th full wave of growth according to Elliott Wave Theory.
Corrective waves ABC (marked in blue) have most likely formed.
Above, we also see a liquidity area at $4.229, which is most likely to be cleared, and the movement will most likely continue higher to the green levels.
If the price forms a low lower than the start of wave 4 at $4.024, this wave structure will be considered broken, and the price movement may decline.

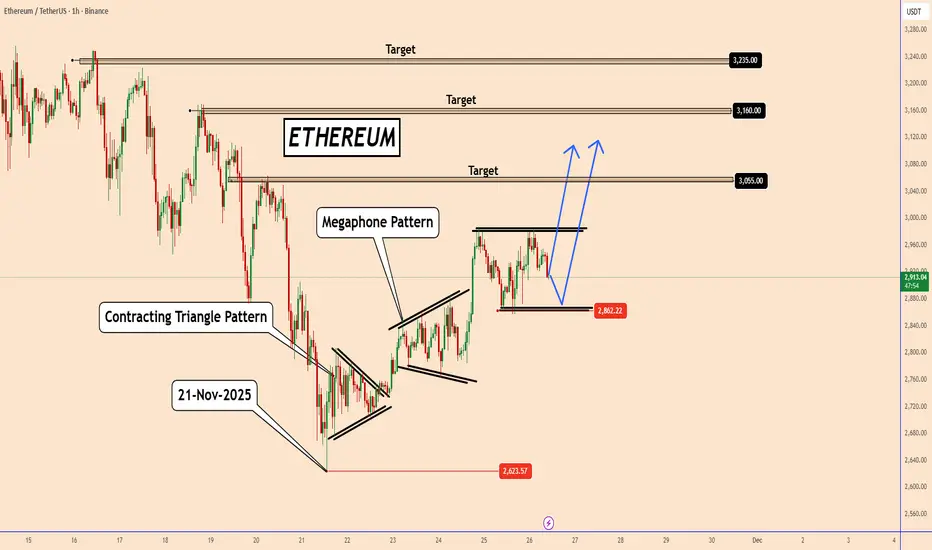
ETH: Pattern After Pattern — Bulls Preparing for ContinuationETH: Pattern After Pattern — Bulls Preparing for Continuation
On November 21, 2025, Ethereum tested a very old support area near the 2623 level, where it also had a strong upward momentum.
From the chart, we can see that over the past 5 days, Ethereum started to rally and completed 2 bullish patterns so far, but slowly progressing upwards.
Currently, ETH is rallying again after a "Contracting Triangle Pattern" and a bullish "Megaphone" pattern.
The new pattern seems to be bullish again, however, ETH should respect the new pattern.
If the price moves above the pattern again, it should start another upward move as shown in the chart.
Main targets:
3055
3160
3235
You may find more details in the chart!
Thank you and Good Luck!
❤️PS: Please support with a like or comment if you find this analysis useful for your trading day❤️
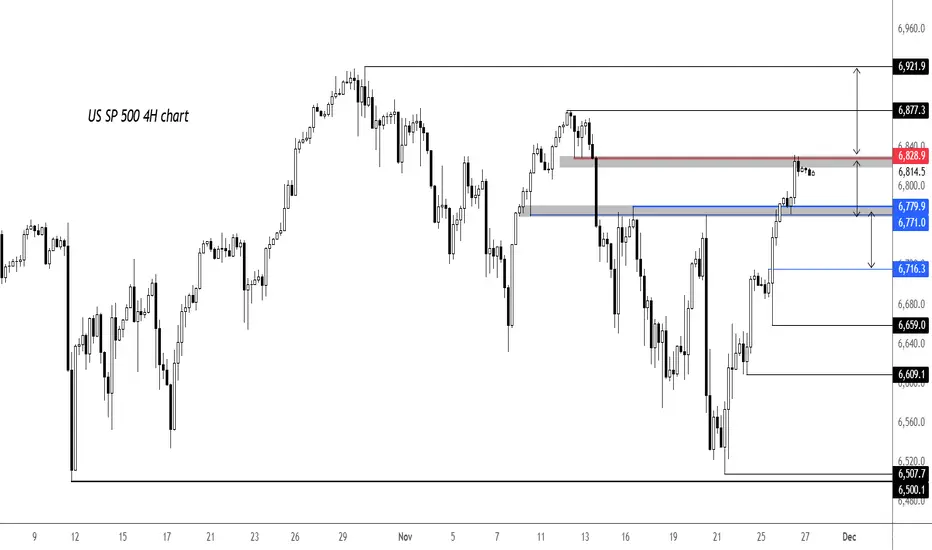
S&P 500 levels to watchFollowing the big recovery, lots of short-term levels have been reclaimed this week but with US markets closed today, index futures have been fairly quite and easing back down ever so slightly. Key support is now seen around 6771-6780 on our US SP 500 chart (derived from the underlying ES prices). Below that, 6716 is the next support. Bulls will get in trouble if 6659 - most recent low - breaks. On the upside, 6829 is first hurdle, marking the point of origin of the previous drop. Ideal location for the bears to step back in if they want to regain control of price action. Lose that, 6877 is next upside target then the all time high at 6922.
By Fawad Razaqzada, market analyst with FOREX.com
NZD/USD Gave Fake Breakout , Long Setup Valid To Get 200 Pips !Here is my 4H Chart on NZD/USD , We Have A Fake Breakout and then the price Back above my old support and we have a very good bullish Price Action on 2 And 4 Hours T.F Also the price playing very good around my support and i`m waiting the price to retest the broken area and giving a good bullish price action on smaller time frames to can get a confirmation to enter , So i see it`s a good chance to buy this pair if it go down a little to retest the broken area and then we can buy it and targeting 100 to 150 pips . and if we have a daily closure again below my old support then this idea will not be valid anymore .
Reasons To Enter :
1- Perfect Breakout .
2- Clear bullish Price Action .
3- Bigger T.F Giving Good bullish P.A .
4 - Perfect 15 Mins Closure .
5- The Price Respect The support Again .

CADJPY Will Collapse! SELL!
My dear followers,
This is my opinion on the CADJPY next move:
The asset is approaching an important pivot point 111.45
Bias - Bearish
Safe Stop Loss - 111.62
Technical Indicators: Supper Trend generates a clear short signal while Pivot Point HL is currently determining the overall Bearish trend of the market.
Goal - 111.13
About Used Indicators:
For more efficient signals, super-trend is used in combination with other indicators like Pivot Points.
Disclosure: I am part of Trade Nation's Influencer program and receive a monthly fee for using their TradingView charts in my analysis.
———————————
WISH YOU ALL LUCK

GBPAUD ShortHello everyone, I just saw the good idea that can be taken in consideration. A smooth downtrend for GBPAUD which will likely will make a low to around level of 2.00.

Apple - This stock will collapse!🥊Apple ( NASDAQ:AAPL ) is reversing right now:
🔎Analysis summary:
Starting back five years ago, Apple established a major rising channel pattern. Following this channel, Apple recently created a textbook +40% move higher. But with the current retest of resistance, we will certainly see another pullback of -30% in the near future.
📝Levels to watch:
$250
SwingTraderPhil
SwingTrading.Simplified. | Investing.Simplified. | #LONGTERMVISION

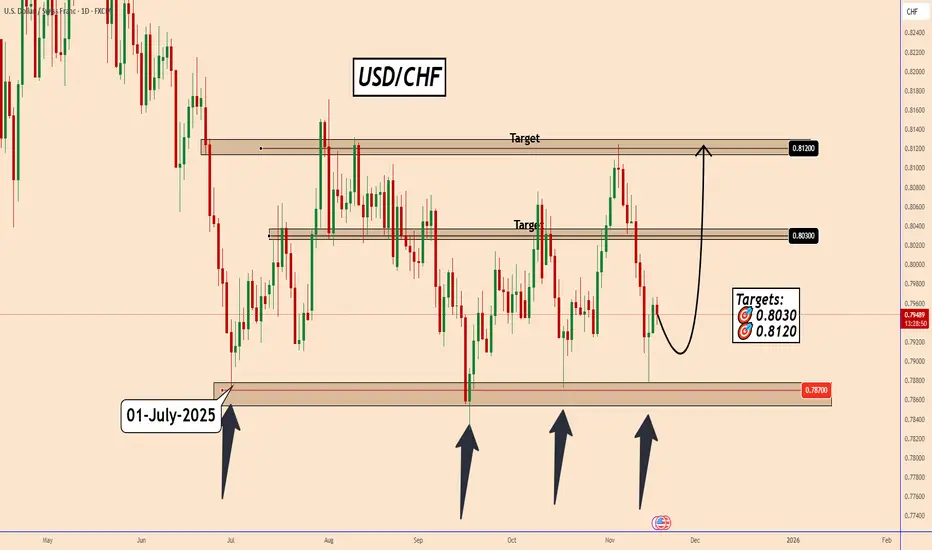
USDCHF Poised for a Range-Trading ReboundUSDCHF Poised for a Range-Trading Rebound
USDCHF has been trading within a broad range since July 1, 2025, moving between strong support around 0.7870 and resistance around 0.8120.
Four days ago, the pair retested the support zone for the fourth time, and the initial reaction was sharp—signaling strong buying interest at this level.
With the market holding this range for roughly 140 days, the probability favors another upward swing developing inside the structure.
If momentum builds, USDCHF may soon begin a new bullish leg toward the next key levels:
🎯 0.8030
🎯 0.8120
You may find more details in the chart!
Thank you and Good Luck!
❤️PS: Please support with a like or comment if you find this analysis useful for your trading day❤️
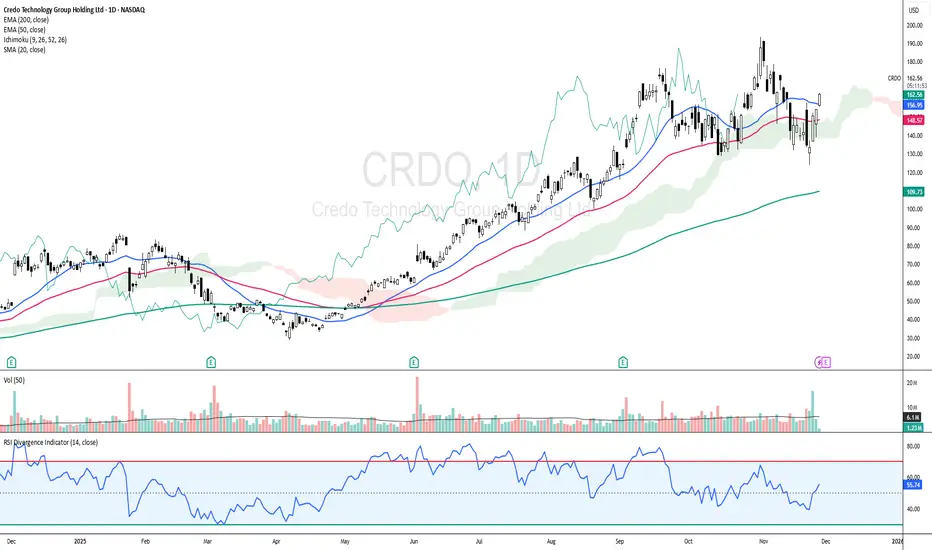
CRDO: Cloud + EMAs Aligning for Upside ContinuationCRDO - CURRENT PRICE : 162.95
CRDO is showing a bullish reversal setup as price rebounds and closes back above the EMA50 while holding firmly above the Ichimoku Cloud , signaling the major trend remains intact. Momentum is improving with RSI rising above 50 and not yet overbought, supported by increasing volume on the recent bullish white candlestick.
Today’s move above the 20-day SMA adds a positive layer to the short-term trend structure. Short term targets are 175.00 and 185.00 while support is 148.00.
ENTRY PRICE : 160.00 - 162.95
FIRST TARGET : 175.00
SECOND TARGET : 1.85
SUPPORT : 148.00
EURUSD sideways consolidation capped at 1.1580The EURUSD currency pair continues to display a bearish outlook, in line with the prevailing downward trend. Recent price action suggests a corrective pullback, potentially setting up for another move lower if resistance holds.
Key Level: 1.1580
This zone, previously a consolidation area, now acts as a significant resistance level.
Bearish Scenario (rejection at 1.1580):
A failed test and rejection at 1.1580 would likely resume the bearish momentum.
Downside targets include:
1.1490 – Initial support
1.1460 – Intermediate support
1.1440 – Longer-term support level
Bullish Scenario (breakout above 1.1580):
A confirmed breakout and daily close above 1.1580 would invalidate the bearish setup.
In that case, potential upside resistance levels are:
1.1600 – First resistance
1.1650 – Further upside target
Conclusion
EURUSD remains under bearish pressure, with the 1.1580 level acting as a key inflection point. As long as price remains below this level, the bias favours further downside. Traders should watch for price confirmation around that level to assess the next move.
This communication is for informational purposes only and should not be viewed as any form of recommendation as to a particular course of action or as investment advice. It is not intended as an offer or solicitation for the purchase or sale of any financial instrument or as an official confirmation of any transaction. Opinions, estimates and assumptions expressed herein are made as of the date of this communication and are subject to change without notice. This communication has been prepared based upon information, including market prices, data and other information, believed to be reliable; however, Trade Nation does not warrant its completeness or accuracy. All market prices and market data contained in or attached to this communication are indicative and subject to change without notice.

Toncoin (TON/USDT): Trendline Break & Double BottomHi!
TON has formed a double-bottom reversal pattern after a sharp decline, signaling early bullish momentum. Price has also broken the minor descending trendline, confirming a short-term shift in structure.
Key Levels
Immediate Resistance: $1.63–$1.68 (first supply zone)
Major Resistance: $1.78–$1.82 (trendline + supply confluence)
Bullish Scenario
A sustained move above $1.63–$1.68 opens the path toward $1.78–$1.82, where the main descending trendline is located. A breakout there would confirm a stronger trend reversal.
Bearish Scenario
Failure to hold above the breakout zone may lead to a retest of $1.50–$1.52, the neckline of the double bottom.

The overall trend remains bullish📌 Scenario 1 – Gold completes its correction toward 3857 and then resumes the uptrend
In this scenario, Gold could complete its corrective move toward the 3857 zone before starting a clean bullish leg
This level represents:
A potential completion of the correction
A liquidity grab area
An institutional demand zone
If price taps this zone and shows a clean bullish reaction, I expect a strong continuation to the upside, targeting a new ATH
📌 Scenario 2 – If price breaks Wave 1 → Direct bullish explosion and new ATH
If Gold breaks the Wave 1 level without revisiting the lower correction zone this could trigger a direct bullish continuation what I call the “big pump”
A clean breakout above Wave 1 would be a strong technical signal that Gold is ready to push into a new all-time high


GBPUSD – Potential Bullish Reaction From Intraday Support ZoneThis chart highlights a possible intraday reaction on GBPUSD after price tapped into a local support area.
The structure shows a corrective move downward followed by a potential shift in momentum.
If the pair maintains support and forms higher lows, the market may continue toward the upper zone marked on the chart.
This idea is for market observation and educational purposes only, not a signal or guarantee of direction.

NQ Week 48 T.A explained -
BackSide (BS)
FrontSide (FS)
Inverse BS (Inv.BS)
Inverse FS (Inv.FS)
BS & FS levels are expected support when dashed lines, tested when dotted and resistance when solid lines.
The inverse is true for the Inv. BS Inv. FS levels, they are resistance as dashed lines, tested as dotted and support as solid lines.
Monthly timeframe is color pink
weekly grey
daily is red
4hr is orange
1hr is yellow
15min is blue
5min is green if they are shown.
strength favors the higher timeframe.
2x dotted levels are origin levels where trends have or will originate. When trends break, price will target the origin of the trend. its math, when the trend breaks, the vertex breaks too so the higher timeframe level/trend that breaks, the more volatility there could be as strength in the orders flow in to fuel the move.

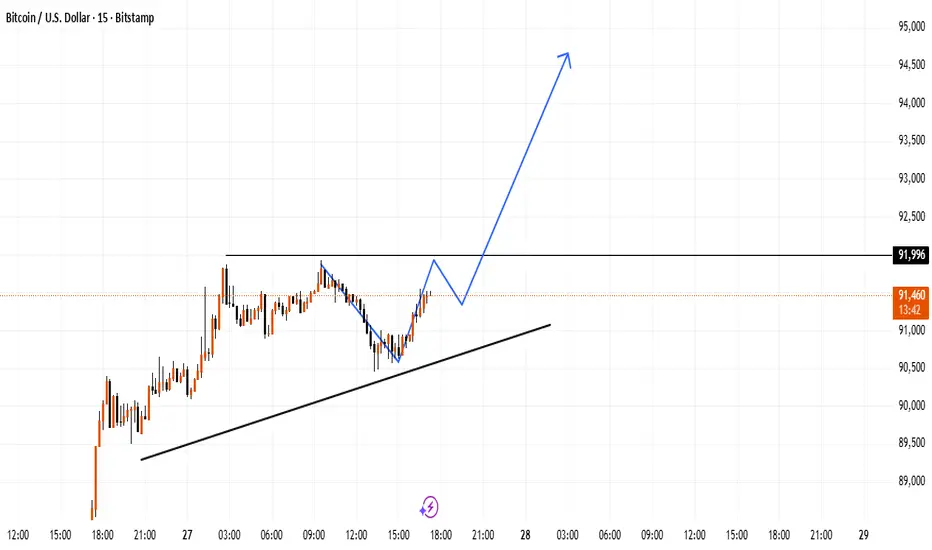
BTC Price Watching Key Barrier and Rising SupportThe chart highlights a rising support line guiding recent movement, while a horizontal zone near the top acts as a key barrier.
If price continues respecting the upward structure, momentum may build once this upper level is cleared with strength.
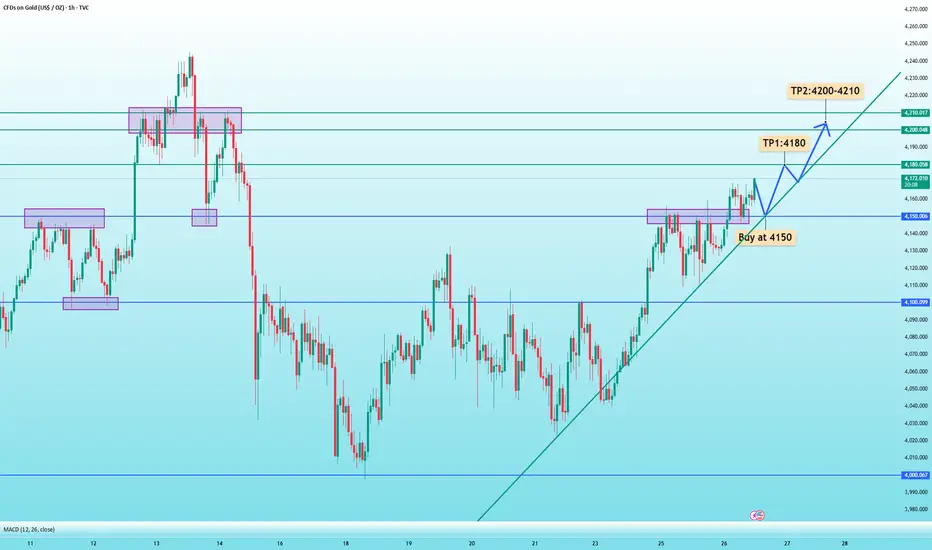
XAUUSD: 4150 is key; buy if it pulls back but doesn't break thisShifts in Global Geopolitical Dynamics:
The global landscape is undergoing noticeable changes, with recent developments showing a clear de-escalation in the Russia–Ukraine situation. This easing of geopolitical tension has placed upward pressure on gold under some constraint, meaning bullish sentiment should not be taken for granted. Entering long positions on pullbacks to support levels would be a more prudent approach.
Today, gold successfully held above $4,150, turning this former resistance into new support. As such, the $4,150 level becomes the key trading pivot for the day.
From the 1-hour chart, as long as prices hold above $4,150, there remains potential for gold to retest $4,180, and possibly challenge the previous highs around $4,200–$4,210.
Trading Strategy:
Buy at $4,150
Target 1: $4,180
Target 2: $4,200–$4,210
Stop-loss: Around $10, adjusted based on individual risk tolerance
Key Data to Watch:
U.S. Initial Jobless Claims (weekly)
U.S. Durable Goods Orders (September, MoM)
11.27 Asian early-sessiong plan for goldI. Best Execution Outcome of Yesterday’s Strategy
Combined with yesterday’s European/North American session strategy and the current chart:
Long Strategy: If you entered a long position in the 4154-4158 zone during yesterday’s European session, the price peaked at 4168.78 (near the first target of 4170), locking in ~10-14 pips of profit. Holding into the North American session would still reach the first target of 4168, but volatility narrowed due to the Thanksgiving holiday, so 4172 was not breached.
Short Strategy: Yesterday’s North American session did touch the 4170-4172 short entry zone, but no clear reversal signals (e.g., bearish engulfing/shooting star) emerged — so the short setup was not triggered (this counts as a prudent wait for valid confirmation).
II. Trading Strategy for Today (Thanksgiving Holiday)
Key Pre-Reminder: Given the U.S. Thanksgiving holiday (low liquidity, early market close, and muted volatility), avoiding trading entirely is the most risk-averse and suitable choice for today.
If you still choose to participate (for small-scale practice), use an extremely conservative range-trading plan:
1. Core Approach
Stick to micro-range scalping only (no trend trades — low liquidity drastically raises false breakout risks).
2. Minimal-Risk Trading Plan
Range Boundaries: 4158 (support) → 4168 (resistance)
Long Setup: Enter only if price hits 4158 with a clear hammer candlestick; position size: ≤3% of total capital; Stop-loss: 4155; Take-profit: 4165.
Short Setup: Enter only if price hits 4168 with a clear shooting star; position size: ≤3% of total capital; Stop-loss: 4171; Take-profit: 4162.
3. Non-Negotiable Holiday Rules
No overnight positions: Close all trades before 19:00 UTC (well ahead of the early North American close at 22:00 UTC).
Strict position limits: Do not allocate more than 5% of total capital to trades today.
Prioritize inactivity: If no clean signals appear within 1 hour, step away — sitting out is the best choice for holiday markets.
GOOD LUCK!
LESS IS MORE!

XAUUSD ANALYSISAfter SMASHING TP from previous long trade, market had consolidation which was part of creating short structure from touch supply zone for several times as pullback, it also started to have multiple rejection on 1 hour timeframe which show buyers exhaustion and when market resume it may give us Gold Dollar (XAUUSD) short opportunity.

Short eurusd I'm looking forward to selling eurusd with the high of the candle with Fvg as my stop loss. Risk to reward is at least 1:3. All the best

Gold looking for longsI think the trendline will be broken , stops will be taken and then gold will start going down.
Let us see what next week is going to bring on.

DeGRAM | SOLUSD will test the strength of the $150 resistance📊 Technical Analysis
● SOL/USD remains inside a broad descending structure with repeated rejections from the dynamic resistance line, preserving bearish dominance.
● Price is approaching the $150 zone, where previous flag and consolidation tops failed, making a reversal toward the $135–$130 support area highly probable.
💡 Fundamental Analysis
● Market rotation out of high-beta altcoins continues as investors reduce exposure amid rising volatility, limiting SOL’s upside potential.
✨ Summary
● Bearish bias below $150. Targets: $135 → $130. Resistance: $150.
-------------------
Share your opinion in the comments and support the idea with a like. Thanks for your support!
