CIFR | WeeklyNASDAQ:CIFR — Quantum Model Projection
Bullish Alternative — Weekly
As outlined in prior updates, Cipher delivered an outstanding 38.8% rally this week, launching directly🚀 from the apex of the convergent support equivalence lines!
As previously noted, Intermediate Wave (4) completed a decisive retracement into the $14.36 Fibonacci target, settling precisely ➤ at the structural apex.
The model favours an extension into Intermediate Wave (5) within Primary Wave ⓷, projecting an impulsive advance toward ➤ $254.
This target aligns with the confluence of divergent equivalence lines and corresponds to the 1.618 Fibonacci extension derived from the Leading Diagonal of Primary Wave ⓵ — a configuration typically associated with strong bullish continuation patterns.
Overall, the wave structure suggests the uptrend remains firmly intact, with the projected impulsive phase now potentially underway.
🔖 In my Quantum Models methodology, the equivalence lines function as structural elements, anchoring the model's internal geometry and framing the progression of alternate paths.
#MarketAnalysis #TechnicalAnalysis #ElliottWave #WaveAnalysis #TrendAnalysis #FibLevels #FinTwit #TradingView #Investing #CIFR #DataCenters #BitcoinMining #HPC #CryptoMining #CipherMining #BTC #Bitcoin #BTCUSD CRYPTOCAP:BTC NASDAQ:CIFR
#HighPerformanceComputing
Community ideas

Silver Cup and Handle Pattern: Bullish SetupThis 4-hour chart on silver displays a textbook cup and handle formation.
The cup forms as silver rounds off a previous high and builds a base, signaling accumulation and renewed buying interest. The handle’s consolidation, often a descending channel, typically retraces less than half of the cup’s advance. Breakout confirmation comes when price closes above the handle’s downward resistance line
Statistically, the measured move upon breakout is often the depth of the cup added to the breakout level, indicating strong upside potential if the pattern completes successfully.
A conservative target is $54 - $57.
A silver rally can reflect broad risk-on sentiment. Historically, decisive moves in precious metals have sometimes coincided with bullish developments in the crypto market, triggered by macro events like Federal Reserve rate cuts or rising monetary inflation.

PEPE/USDT : BUY LIMITHello friends
Well, you can see that after the price fell, it was able to rise by buyers. Now we have an important area where this resistance needs to be broken for the trend to change and the price to rise.
This analysis is purely technically reviewed and is not a buy or sell recommendation, so avoid emotional behavior.
*Trade safely with us*

BTCUSDT: Lower Vectors Cleared, Higher Targets in SightBitcoin has recovered prior vector candle imbalances at the lower levels (marked in green) and is showing signs of strength after retesting the daily open. With cleanups complete below, attention now shifts to the remaining unfilled vectors above (highlighted in purple), ranging from the 6hr to 5min timeframes.
These imbalances act as magnets for price, suggesting a potential path higher toward the $98K–$109K region.
The structure also shows a possible stair-stepping move upward with multiple confluences building around each level. If momentum sustains and liquidity is swept at each leg, we could see these zones get tapped progressively in the coming sessions.

GBPUSD -OUTLOOKIf price returns to the marked entry level, I’ll be looking for confirmation on the lower timeframes before taking a position. This setup may develop as we move into next week.


BTC - Crypto Winter or Valhalla?*****DYOR - This is not financial advice. I am watching closely to see which narrative plays out.*****
Based on the market data and analysis from late November 2025, the consensus is that this crash was primarily a deleveraging event combined with short-term holder panic, rather than a cycle-ending distribution phase that signals the start of a long crypto winter.
Here is the breakdown of why the data supports "leverage flush" over "crypto winter."
1. The Case for Deleveraging (The Primary Driver)
The speed and mechanics of the drop from the October highs ($126k) to the November lows ($80k range) bear the classic hallmarks of a leverage washout rather than a structural market collapse.
Massive Liquidations: Reports confirm that billions in long positions were liquidated in November.1 Open interest (the total value of outstanding derivative contracts) plummeted, signaling that highly leveraged bets were forcefully wiped out.
Funding Rates Reset: Prior to the crash, funding rates were high, indicating an overheated market where traders were paying a premium to stay long. These rates have since neutralized, which typically happens after a healthy "reset" of the market.
Short-Term Capitulation: On-chain data indicates that the bulk of the selling came from "Short-Term Holders" (investors who bought in the last 1-3 months). These participants panicked when prices dropped below their cost basis (around $100k), triggering a cascade of selling.
2. Why it Likely Isn't "Distribution" (Crypto Winter)
In market cycle theory (like Wyckoff), "distribution" is a long period where "smart money" (institutions/whales) quietly unloads their bags onto retail investors before a crash. The data suggests this hasn't fully happened yet.
Whale Behavior: While long-term holders did take some profits during the run-up to $126k, analysts note this looks like "mid-cycle profit-taking" rather than the wholesale exit seen at market tops. Large entities have generally held onto their core positions.
Institutional Inflows: Spot ETF inflows have remained relatively resilient despite the price drop. In a true "end of distribution" phase, you would typically see sustained, heavy institutional outflows.
Macro Correlation: The drop correlated tightly with a "risk-off" move in the wider stock market (specifically tech stocks and concerns over Fed rates). Bitcoin acted like a high-beta tech stock rather than an isolated collapsing asset.
3. The Verdict: A "Mid-Cycle Correction"
Most analysts view this as a steep correction (approx. 30-35% drawdown) within a broader bull market, rather than the start of a multi-year bear market.
Feature Deleveraging Event (Current View) End of Distribution (Crypto Winter)
Speed Sharp, violent, and fast (V-shaped or rapid drop). Slow grind downwards after a long plateau.
Volume High volume on the way down (panic selling). High volume at the top (smart money selling).
Sentiment "Fear" spikes instantly. "Complacency" turns to slow denial.
Catalyst Liquidation cascades & macro fear. Exhaustion of new buyers.
What to watch next:
Key technical levels are currently around $88,000 - $90,000. If Bitcoin can reclaim and hold this level, it confirms the "leverage flush" theory.
A sustained break below $80,000 would be the only signal that might validate the "crypto winter" concerns.

NZDUSD Wave Analysis – 27 November 2025
- NZDUSD broke daily Falling Wedge
- Likely to rise to resistance level 0.5800
NZDUSD currency pair recently reversed from support area between the powerful support level 0.5550 (which has been reversing the price from January) and the lower daily Bollinger Band.
The upward reversal from this support area stopped the previous minor impulse wave 5 of the intermediate impulse wave (C) from September.
Having recently broken the resistance level 0.5700 and the daily Falling Wedge from August, NZDUSD can be expected to rise to the next resistance level 0.5800.

Gold 4H – Bearish Harmonic Rejection SetupGold is currently testing a major descending trendline drawn from the previous swing high (Point A). Price has tapped into a strong supply zone / rejection block around 4150–4170, which also aligns with the 0.618 and 0.70 Fibonacci retracement levels taken from the C–D leg projection.
The structure shows a potential harmonic completion, where the market has printed an A–B–C pattern and is now forming the final leg toward D. The repeated rejections from the shaded supply zone indicate weakening bullish momentum.
As long as price remains below this supply region and fails to break the descending trendline, the setup favors a downside continuation, targeting the lower trendline support near 3800–3850, completing the projected D-leg.
Key Highlights:
Price reacting to multi-touch descending trendline
Strong supply zone (4150–4170) aligned with 0.618/0.70 fib
Bearish harmonic structure aiming for D-leg completion
Potential downside target: 3800–3850
Bias remains bearish unless price breaks and holds above the supply zone

SLV | Next Leg Higher Is Here | LONGiShares Silver Trust seeks to reflect generally the performance of the price of silver. The Trust seeks to reflect such performance before payment of the Trust's expenses and liabilities. It is not actively managed. The Trust does not engage in any activities designed to obtain a profit from, or to ameliorate losses caused by, changes in the price of silver.

XRO LONGwell folk, let me introduce you to the market algorithm that tha pimp invented, in this case scenario you can check how once again we make bread by goin long respektin tha algo rules, enjoy ..

ARC Buy/Long Insight (4H)The ARC structure has gained strong bullish momentum after the main CH, and continuous bullish BOS can be seen on the chart.
After the liquidity sweep, the price has moved upward again. By tracking the structure, it becomes clear that the price is aiming to reach the higher-timeframe supply zones, and we are looking for buy/long positions at the origin zones.
The entry zone, stop, and targets are marked on the chart.
Do not enter the position without capital management and stop setting
Comment if you have any questions
thank you

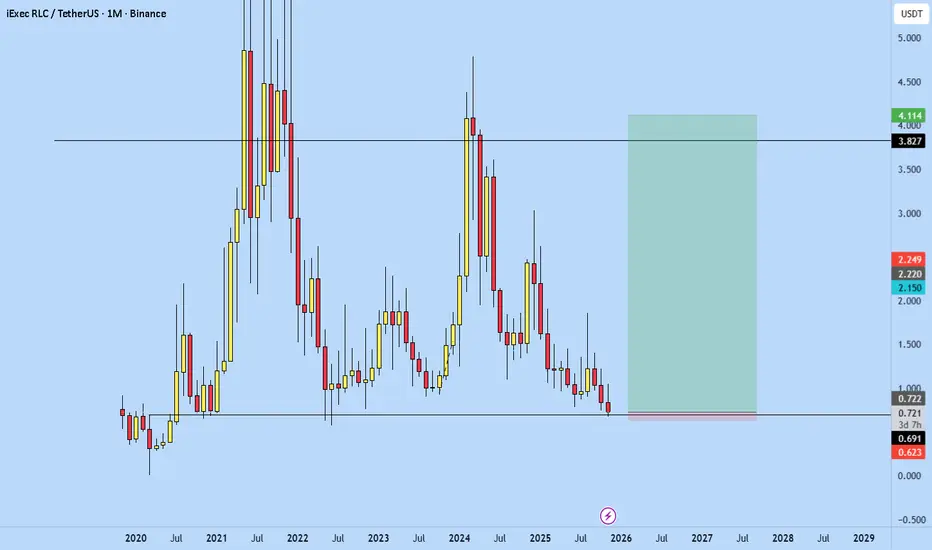
RLC preparing for an reversal?Simple, naked chart showing signs of potential flip back towards a new bullish cycle. If we can stay above that 0.7$ level, we can look at potential reversals back towards 3-4$.
From a Fundamental side of things, the project is promising and in undervalued territory. Let's see what next couple of months can bring us.
Cheers!
XAU/USD | GOLDGOLD NEXT MOVE...
Let me know what you think about my analysis in the comment section, and please hit boost and follow for more ideas.
Trading is not hard if you have a good coach! Thank you.

EURUSD Sell zonewill sell EURUSD if the 15min closed with Rejection inside or outside the orderblock
thats will be good confirmation to sell after tokyo break

KAS / USDT (1D Timeframe)Pattern: Bearish Downtrend Retracement Into Major Supply Zone + Downside Continuation Setup
The chart shows Kaspa (KAS) pulling back into a high-probability supply zone after a strong downtrend.
Despite a sharp relief rally, market structure remains bearish with repeated Breaks of Structure (BOS).
Price is now reacting inside a major supply block, which historically generated aggressive sell-side displacement.
Key Observations:
🔹 Strong Downtrend:
KAS has been consistently forming lower highs and lower lows, confirming a clean and well-respected bearish trend.
🔹 Multiple BOS Confirming Bearish Structure:
Each upward correction has been followed by another BOS to the downside, showing seller dominance throughout the trend.
🔹 Major Supply Zone ($0.05474–$0.05226):
Price is currently tapping a well-defined supply zone — the origin of a previous strong sell-off. This area is likely to attract fresh sell orders from smart money.
🔹 Sharp Retracement Rally:
The green impulse shows a fast corrective move, but this is typical in downtrends before the next leg down begins.
🔹 Projected Bearish Path:
The dotted arrows indicate the expected downside continuation, with price possibly forming lower-high structures before breaking down further.
🔹 Target Levels Identified:
Two clear downside targets are marked based on previous reaction points and liquidity sweeps.
Potential Move:
If KAS rejects from the supply zone ($0.05474–$0.05226):
🎯 Target One: $0.04605
(The first liquidity pocket and prior reaction zone)
🎯 Target Two: $0.03667
(The deeper continuation level aligning with the overall trend projection)
A daily close above $0.05480 would weaken the bearish continuation thesis and signal that buyers may be attempting a structural shift.
Summary:
Kaspa is firmly trending downward, and the recent pump into the daily supply zone provides an ideal rejection area for continuation.
Market structure, BOS levels, and historical sell-off zones all support the bearish narrative.
If sellers defend this supply area, KAS could resume the downtrend toward $0.046 and potentially $0.036.
Only a strong breakout above the supply zone would invalidate this bearish setup and hint at a possible reversal.

XAUUSD: Market Analysis and Strategy for November 27Gold Technical Analysis:
Daily Resistance: 4210, Support: 4000
4-Hour Resistance: 4180, Support: 4110
1-Hour Resistance: 4170, Support: 4130
The weekly chart continues its bullish trend. Tomorrow's monthly/weekly chart closes, directly impacting the December technical outlook.
The daily chart continues its upward trend. The newly formed "rounded bottom" needs to be monitored for its sustainability. Bollinger Bands are widening upwards, and the middle band and moving average support are gradually moving upwards. As mentioned in recent analyses, the main strategy is to follow the trend and be bullish. The next key level to watch is 4200. Long-term holders can wait for the Fed's interest rate decision before buying. The ideal long-term entry point for gold remains below 4000; however, short-term traders can buy low and sell high.
Based on the 1-hour chart, gold continued its upward trend during the European session, with the candlestick pattern indicating an upward channel. The next resistance level to watch is around 4180, followed by the psychological resistance at 4200. Support levels are around 4150/4140.
Trading Strategy:
BUY: 4150~4140
Selling strategies should be determined based on the real-time candlestick pattern.
More Analysis →

Update USDJPYThe long-term trend is bullish and fairly strong. The price has already touched a major daily resistance level once and got rejected — although the rejection wasn’t very strong. It then reacted to the 0.382 Fibonacci level, where it found support.
We are definitely waiting for a buy trigger, and a pullback toward the 0.236 Fibonacci level, followed by a clear candlestick confirmation, can provide a solid entry signal.
Otherwise, we simply wait.
A short position is not part of our plan at the moment.

Bounce from support ?! USD/CAD short-term long opportunityNot much movement expected for today. But CXY bounced from support recently and DXY currently showing weakness. Not unlikely that tomorrow's GDP news for Canada triggers a push upwards for USDCAD. We'll see...

GBP/JPY Best Place For Sell Cleared After This Massive Move !Here is my opinion on Daily T.F On GBP/JPY Chart , the price Very Near to touch a very strong res area that forced the price to respect it and go down for more than 500 pips for 1 time , and if we checked the chart we will see that the price is going up very hard without any correction so we need a very strong res area to force the price to go down at least for 300 pips so i choose this area cuz it`s the highest place the price touch it and it respect it very much and go down very hard as it go up very hard , so i`m waiting the price at this area to sell it and targeting from 100 to 300 pips . if we have a daily closure above my res area this idea will not be valid anymore .
Entry Reasons :
1- Very Strong Daily & Weekly Res Area .
2- Perfect Bearish Price Action Last Time .
3- Bigger Time Frames Confirmed .

Update CADCHFA very strong and important resistance is located at **0.57400**, and the price is still reacting to it.
**Plan A**:
Rejection from the resistance level, similar to previous behavior on the chart.
Our target in this scenario would be the **0.56565** price area.
**Plan B**:
A breakout above the resistance.
Why is this our secondary plan? Because it goes **against the current trend**, and entering a long position requires **both candlestick confirmation and momentum confirmation**.
For now, the price is still struggling with the resistance, so we need to wait and see how it plays out.

Gbpaud at resistance again short ? G.bpaud has reached again the resistance level from where price has rejected several time … will price reject again ? Let us see how it plays out

Elise : XAUUSD 2H — Breakout Retest Accumulation Setup |OANDA:XAUUSD
Key Scenarios
✅ Bullish Case (Primary)
A confirmed break and hold above 4135–4150 supply opens the door for bullish continuation toward:
🎯 Target 1: 4281
🎯 Target 2: 4374 (extended trendline & previous rejection zone)
Bullish structure remains valid above 4035.
❌ Bearish Case (Invalidation)
A clean close below the demand zone 4030–4000 would signal weakness, potentially sending price toward:
Current Levels to Watch
Demand Zone: 4035–4060
Supply / Breakout Zone: 4135–4150
Extended Resistance: 4281 / 4374
⚠️ Disclaimer:
This analysis is for educational purposes only — not financial advice. Always manage risk.
