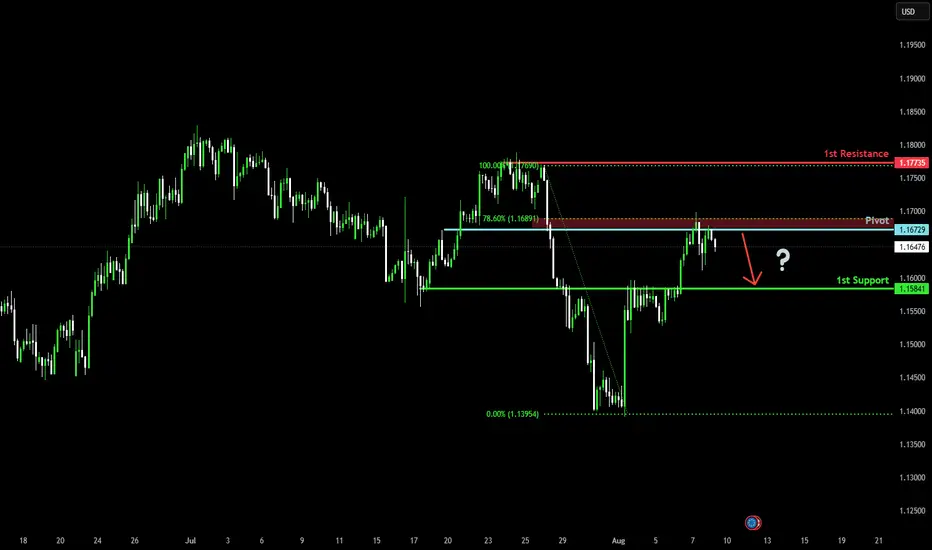
Potential bearish drop?The Fiber (EUR/USD) has rejected off the pivot which acts as a pullback resistance that is slightly below the 78.6% Fibonacci retracement and could drop to the 1st support.
Pivot: 1.1672
1st Support: 1.1584
1st Resistance: 1.1773
Risk Warning:
Trading Forex and CFDs carries a high level of risk to your capital and you should only trade with money you can afford to lose. Trading Forex and CFDs may not be suitable for all investors, so please ensure that you fully understand the risks involved and seek independent advice if necessary.
Disclaimer:
The above opinions given constitute general market commentary, and do not constitute the opinion or advice of IC Markets or any form of personal or investment advice.
Any opinions, news, research, analyses, prices, other information, or links to third-party sites contained on this website are provided on an "as-is" basis, are intended only to be informative, is not an advice nor a recommendation, nor research, or a record of our trading prices, or an offer of, or solicitation for a transaction in any financial instrument and thus should not be treated as such. The information provided does not involve any specific investment objectives, financial situation and needs of any specific person who may receive it. Please be aware, that past performance is not a reliable indicator of future performance and/or results. Past Performance or Forward-looking scenarios based upon the reasonable beliefs of the third-party provider are not a guarantee of future performance. Actual results may differ materially from those anticipated in forward-looking or past performance statements. IC Markets makes no representation or warranty and assumes no liability as to the accuracy or completeness of the information provided, nor any loss arising from any investment based on a recommendation, forecast or any information supplied by any third-party.
Community ideas
Bitcoin dominance analysisIf you doubt my analysis, read my previous analysis on Ethereum and Bitcoin.
Bitcoin dominance is moving towards 60% support but I don't think it has the strength to break it. Why? Divergence in "new RSI" as I SHOWN. I think we will have a small Pull back on Major Altcoins like Ripple for the coming days.
This analysis is not a financial recommendation. Crypto is a very risky market and you may lose some or all of your money in it. Especially futures trading.

Get ready to sell GBPUSDWaiting for the third touch around our (FVG) and Fibonacci levels and then we go short 👇

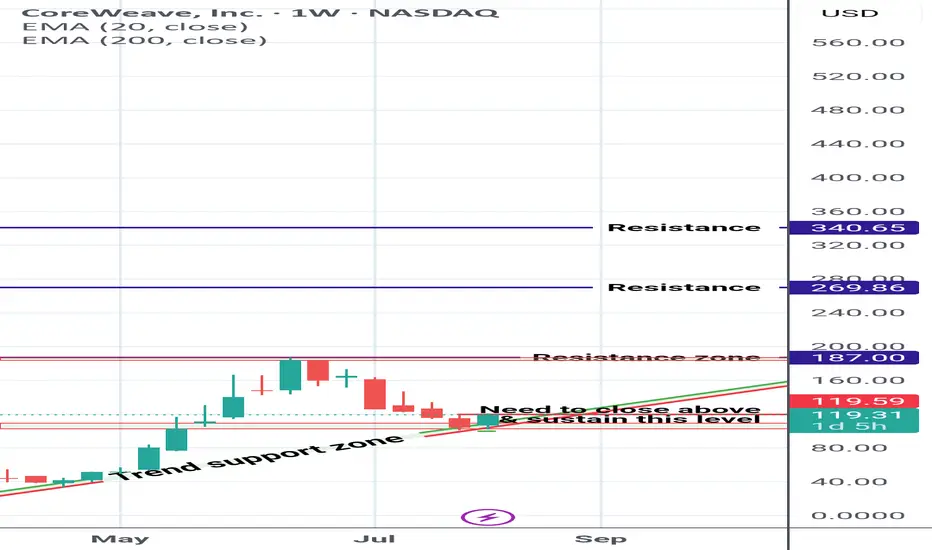
CoreWeave Inc CRWV Getting Ready CoreWeave Inc looks a good bet at cmp 119$ for long.
Risk : Reward Ratio is awesome.
Below trend support zone makes it weaker.
SOL LONG : Ready for the next move upPrice reversal for SOL looks complete .
Broke out of 172 resistance . Break jn structure now with a higher low and high.
Uptrend from here

EURGBP Expected Growth! BUY!
My dear friends,
Please, find my technical outlook for EURGBP below:
The instrument tests an important psychological level 0.8673
Bias - Bullish
Technical Indicators: Supper Trend gives a precise Bullish signal, while Pivot Point HL predicts price changes and potential reversals in the market.
Target - 0.8707
About Used Indicators:
Super-trend indicator is more useful in trending markets where there are clear uptrends and downtrends in price.
Disclosure: I am part of Trade Nation's Influencer program and receive a monthly fee for using their TradingView charts in my analysis.
———————————
WISH YOU ALL LUCK

NZD/USD edges higher, NZ inflation expectations inch lowerThe New Zealand dollar showed some strong gains earlier but couldn't consolidate. After rising as much as 0.50%, NZD/USD has retracted and is trading at 0.5939 in the North American session, up 0.17% on the day.
New Zealand's inflation expectations for the next two years ticked lower in the third quarter, falling to 2.28% from 2.29% in Q2. As well, one-year inflation expecations dipped to 2.37% from 2.41%.
These are not large decreases by any stretch, but the updated figures indicate that businesses expect inflation to ease slightly. The readings are within the Reserve Bank of New Zealand's inflation target band of 1%-3%.
Actual inflation rose by 2.7% in the second quarter, up from 2.5% in Q1. Again, this level is within the central bank's target band, where it has remained for a fourth consecutive quarter. Inflation may be a bit high for the Reserve Bank's liking, but it has made clear that it plans to continue lowering rates. The RBNZ held the benchmark rate at 3.25% last month but this was a "dovish hold" as the central bank said it expected to loosen policy if medium-term inflation continued to ease as expected.
NZD/USD tested resistance at 0.5950. Next, there is resistance at 0.5971
0.5921 and 0.5900 are providing support

GBPUSD- 4/8/25 - Bearish There was a clear BoS on the HTF with ended with near equal low liquidity as marked below.
Looking for a slightly higher risk bearish trade, i identified the zone that broke structure and placed a sell limit at this zone.
My TP is the equal low liquidity - but i may hold it a little longer but keep trailing my SL.
+ve:
1. HTF BoS to bearish
2. Zone that broke structure clearly identified
3. Equal low liquidity that will draw price back to it soon
-ve:
1. Imbalance above zone that broke structure
2. Large bullish candle formed during last friday that indicates big momentum towards bullish movement for awhile

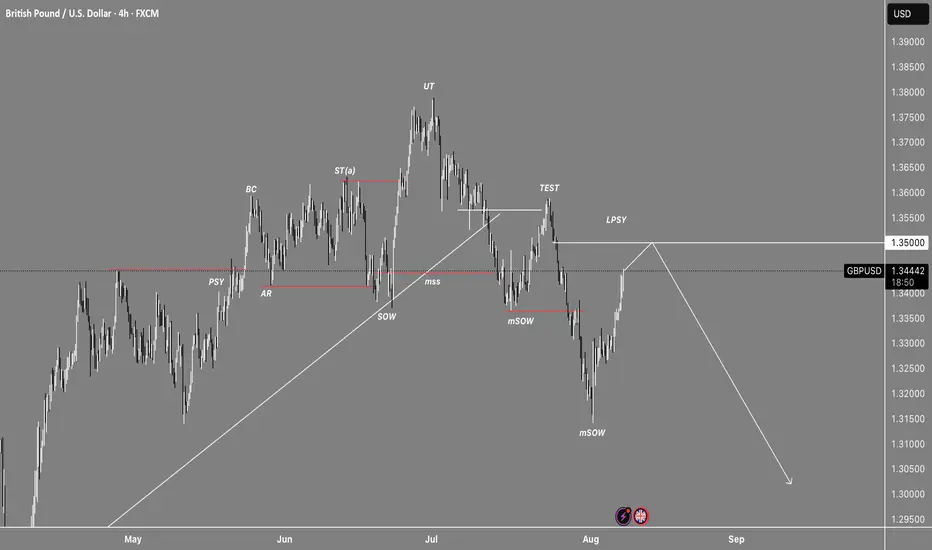
GBPUSD Daily Short – Bearish Rejection from Key Supply ZoneGBPUSD has approached a major daily supply zone around 1.3450–1.3500 and is showing signs of rejection. Price previously broke market structure to the downside and now appears to be retesting the origin of that move.
This setup presents a high-probability short opportunity:
Entry: 1.3450 (rejection zone)
Stop Loss: Above 1.3600 (invalidates bearish structure)
Take Profit:
TP1: 1.3100 (intermediate demand zone)
TP2: 1.2700 (higher timeframe demand & trendline confluence)
Market structure is bearish, and the current move may be forming a Lower High (LH) in the context of a larger downtrend.
📉 Strategy: Supply & Demand + Market Structure
⚠️ Always use proper risk management. This is not financial advice.

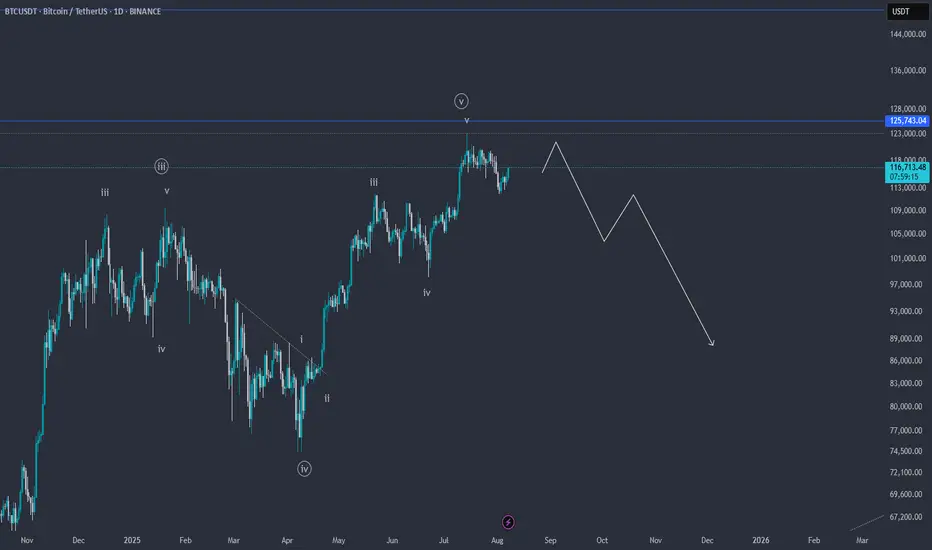
BTCUSDT Elliott Wave – End of the Rally or Start of a Crash?📉 BTCUSDT Elliott Wave Analysis – End of the Rally or Start of a Crash? ⚠️
On the BTCUSDT chart, it appears that the fifth wave of the impulsive structure is nearing completion. The wave count clearly shows a full five-wave sequence, suggesting that Bitcoin may be forming a major top around the $119,000–$125,000 resistance zone.
🔻 If price action confirms a reversal and breaks key support levels, we could see a deep correction potentially taking BTC below $90,000.
📌 Keep in mind this is a scenario based on wave structure and requires confirmation via breakdowns and price action.
💬 What do you think? Is Bitcoin ready for a major correction, or will it break into new all-time highs?
✅ Save this idea & follow for updates!
NZDUSD SHORTsMarket structure bearish on HTFs DW
Entry on Weekly and Daily AOi
Weekly Rejection at At AOi
Previous Weekly Structure Point
Daily Rejection at AOi
Daily EMA retest
Previous Structure point Daily
Around Psychological Level 0.59500
H4 Candlestick rejection
Levels 3.67
Entry 100%
REMEMBER : Trading is a Game Of Probability
: Manage Your Risk
: Be Patient
: Every Moment Is Unique
: Rinse, Wash, Repeat!
: Christ is King.


Is USDCHF correction over?✏️USDCHF in the medium term is still in an uptrend. After a retest wave of Fibonacci 0.5 some buying pressure was present in the European session today with the confirmation of the H4 candle Full bullish force. The reaction at Fibonacci is also the support zone for break out in the past. This is considered an important point in the structure of the bullish wave. The BUY point is triggered with the expectation that USDCHF will break the peak of last week and head towards higher levels.
📉 Key Levels
BUY now 0.80800 (confirmation of candle at the support zone)
BUY DCA trigger Break the peak 0.816
Target 0.830
Leave your comments on the idea. I am happy to read your views.

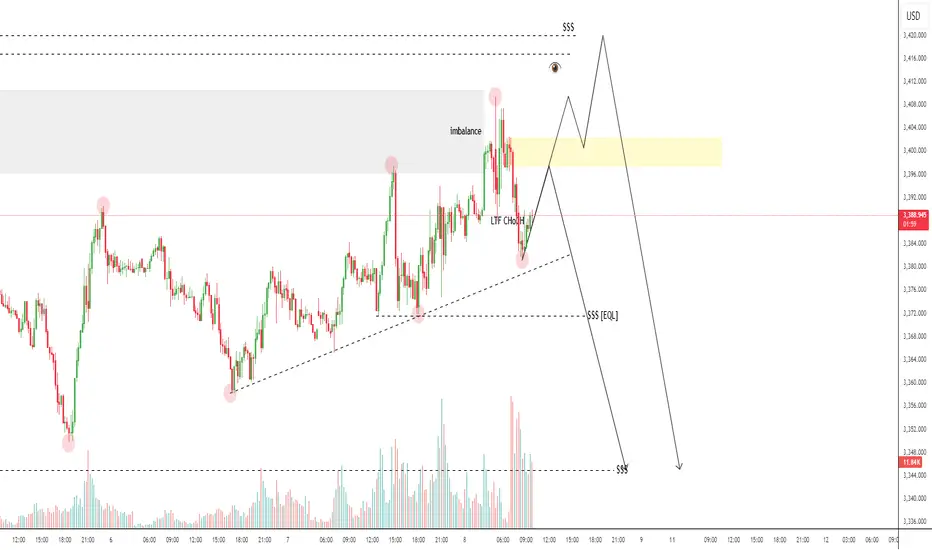
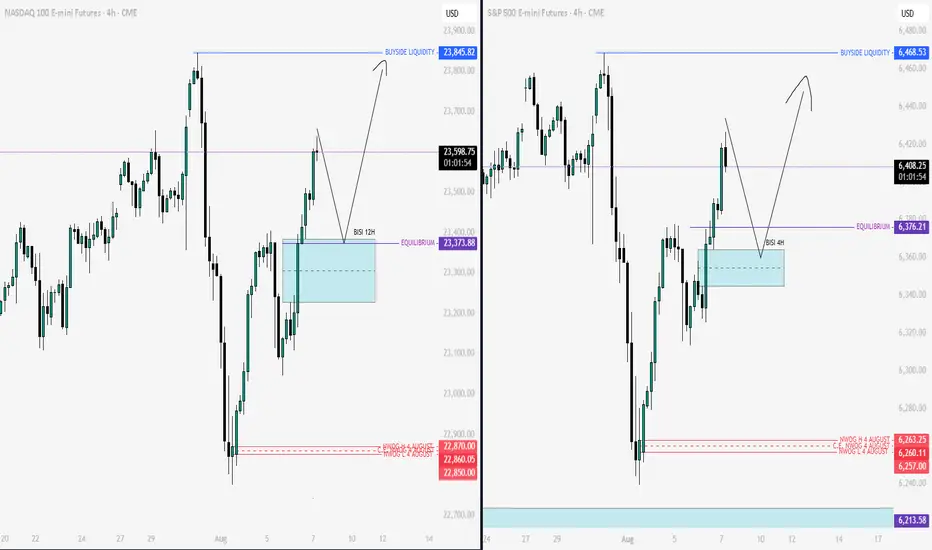
Nq & Es Key Levels & Scenarios 07-08-2025It’s clear that we’re currently operating within a premium zone of the range. The directional bias remains bullish, but I’m anticipating the potential for a short-term short setup around the 09:30 AM New York open, allowing for a retracement before continuation higher.
I will not look for long setups unless price trades back into a discount zone, or at the very least, rebalances toward the equilibrium (50% of the dealing range). If price continues to rally without offering such a pullback, I’m fully prepared to stay sidelined — discipline over FOMO.
Wishing everyone clean, high-probability setups today.
Crude oil: Sell around 66.50, targeting 63.00-60.00Crude Oil Market Analysis:
We've stated this dozens of times before: the overall trend of crude oil is bearish. As long as crude oil doesn't break above 70.00, we can maintain our bearish outlook. Today, we maintain our bearish outlook and continue to sell on any rebounds. Crude oil fundamentals don't support buying. The previous easing of tensions in the Middle East has also been suppressing crude oil prices for a long time, and the ever-changing tariff war is also suppressing crude oil. However, crude oil hasn't broken through 63.00 yet. Today, we're focused on selling if it breaks through. If it doesn't, we'll wait for a small rebound to sell. Focus on selling at 66.50.
Fundamental Analysis:
The tariff war has been the most influential fundamental factor affecting gold recently, and in the long term, it supports gold. This surge in gold prices is driven by Trump's renewed turmoil. Furthermore, the Federal Reserve's future monetary policy remains a key focus.
Trading Strategy:
Crude oil: Sell around 66.50, targeting 63.00-60.00.


EUR/USD - RISKY PlayShorting EURO as we head into the weekend
Looking for a reversal and claw back on gains after the positive news at the end of last week
Bulls running out of steam, US releasing relatively positive news on SEC chair
Lets see how we go!

NEAR Market OverviewAt the moment, we can see that the price is in an ABC correction. So far, it has only reached the 0.382 Fibonacci level and is currently sitting near the weekly pivot point at $2.58 . We're closely watching the price action here, as it's possible the price will extend to the 0.5 Fibonacci level at $2.672 , react from resistance, and then move down toward the $2.145 level.
If the price successfully breaks through and consolidates above, we could see a move up toward the resistance zone at $2.86–$3.029 .

BTC – Bullish Breakout in SightBTC – Bullish Breakout in Sight
Bitcoin recently completed a bullish harmonic pattern near 112K, and the reaction was strong—showing that buyers stepped in around that level.
In just two days, BTC climbed by about 3.5%, reaching 115.7K—and it did so with relatively low trading volume, which highlights quiet but steady buying interest.
Right now, price is pausing between 113.7K and 115.7K, forming a possible accumulation zone.
If momentum picks up again, BTC could launch another bullish move toward:
🔹 116.8K
🔹 119K
You may find more details in the chart!
Thank you and Good Luck!
PS: Please support with a like or comment if you find this analysis useful for your trading day

This is why everyone should have TRX Initially a completely untradeable token, it has recently been generating huge returns. It also has one of the best market structures right now.
Let's take a look at why TRX is a must-buy for everyone, but not right now:
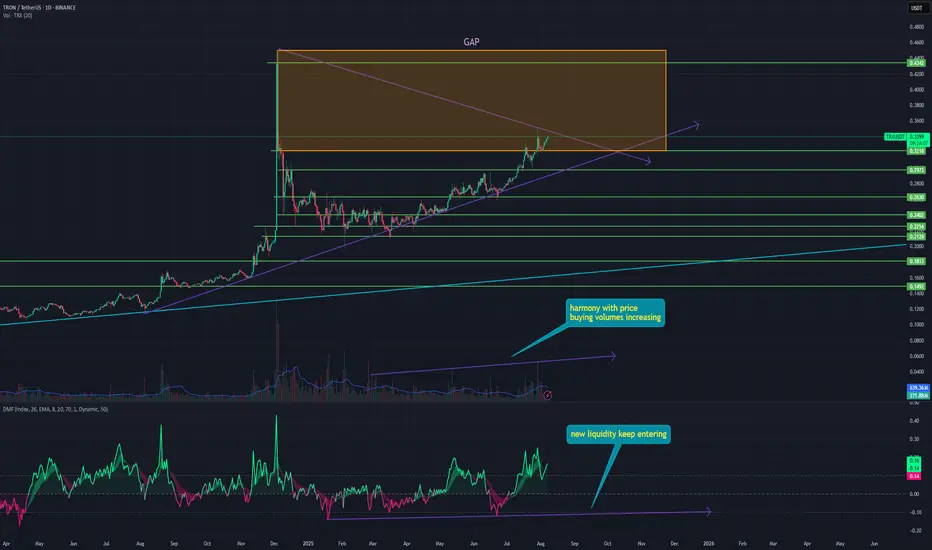
➡️ Firstly, it is one of the only tokens currently close to its ATH.
It is also important that the previous ATH was set in one day and formed a huge GAP at the levels of $0.45 - 0.32. And now the price has already started to close it. Movement along such a GAP is usually extremely fast, as there is no single resistance zone.
➡️ Secondly, it is one of the only tokens on the market with harmonious purchases right now. This means that for the last six months, starting in March 2025, purchase volumes have continued to grow as the price has risen. This indicates high consumer demand even at a rising price, which is a sign of healthy growth.
➡️ Thirdly, money flow is also in harmony with the price. Fresh liquidity continues to flow into the asset regularly, and drawdowns are not very deep, continuing to maintain a bullish structure.
📌 Conclusion:
TRX continues to develop actively, went public with its shares, and received a good boost in percentage terms. In addition, Justin Sun is an enterprising man, the top holder of TRUMP, regularly appearing everywhere, so this guy will not let the hype die down anytime soon.
I would also like to remind you that this is the cheapest network for transactions on ETH. (Don't even write to me about the poor ARB.)
✍️ Share in the comments whether you consider TRX to be a promising token or not?
I would be interested to hear your opinion.
Gold mapping for next weekGold is going down. Gold Major trend is Changing to bearish, lets see are Gold going down after grab liquidity