DAX40 support at 23445The DAX remains in a bullish trend, with recent price action showing signs of a breakout within the broader uptrend.
Support Zone: 23446 – a key level from previous consolidation. Price is currently testing or approaching this level.
A bullish rebound from 23446 would confirm ongoing upside momentum, with potential targets at:
23950 – initial resistance
24140 – psychological and structural level
24380 – extended resistance on the longer-term chart
Bearish Scenario:
A confirmed break and daily close below 23446 would weaken the bullish outlook and suggest deeper downside risk toward:
23350 – minor support
23200 – stronger support and potential demand zone
Outlook:
Bullish bias remains intact while the DAX holds above 23446. A sustained break below this level could shift momentum to the downside in the short term.
This communication is for informational purposes only and should not be viewed as any form of recommendation as to a particular course of action or as investment advice. It is not intended as an offer or solicitation for the purchase or sale of any financial instrument or as an official confirmation of any transaction. Opinions, estimates and assumptions expressed herein are made as of the date of this communication and are subject to change without notice. This communication has been prepared based upon information, including market prices, data and other information, believed to be reliable; however, Trade Nation does not warrant its completeness or accuracy. All market prices and market data contained in or attached to this communication are indicative and subject to change without notice.
Community ideas

BTCUSD after big fall pullback After big fall btcusd in correction phase and price may reach again resistance area and then fall again let us see how it plays out ,.

GBPUSD SHORT1. Structure and Trend Analysis
The chart shows a major shift in market structure:
Initial Bullish Phase (Mar - Jul): The price was in an uptrend, marked by multiple Bos (Break of Structure) in the upward direction (indicated by 'x' on the chart). This confirms a strong sequence of Higher Highs and Higher Lows.
The Reversal Point (Jul - Sep): Price fails to make a new sustained high and begins a distribution phase.
Market Structure Shift (MSS): The key shift occurs around September, marked by MSS (Market Structure Shift). This is a decisive break below a previous swing low, which breaks the structural integrity of the uptrend and signals a potential long-term trend reversal to the downside (bearish).
Continuation of Bearish Structure: A subsequent Bos (Break of Structure) to the downside in November confirms the new bearish trend, indicating a sequence of Lower Lows and Lower Highs is now in play.
2. Liquidity Analysis (The 'Money' Areas)
The triple dollar signs ($$$) indicate areas of retail liquidity (stop-loss orders) that the "Smart Money" is likely targeting.
Equal Highs Liquidity Sweep (Jul - Sep): The high created in late June/early July was followed by a swing high in late August/early September that failed to significantly break the previous high, creating an area of Equal Highs Liquidity ($$$). The price swept this liquidity before the major downturn, a classic institutional move to fuel the sell-off.
Targeted Liquidity: The red and orange shaded zones marked $$$ below the July-August consolidation also represent pools of retail stop-losses (sell-side liquidity). Price has already swept some of this liquidity, as indicated by the 'xx' marks, and is now pulling back.
3. The Current Trade Setup (The Blue Box)
The analysis identifies a high-probability sell (short) setup based on the market structure:
Setup Zone: The short trade is being prepared from the orange and red zones currently being tested by price. This zone is likely a Bearish Order Block (OB) or an Unmitigated Supply Zone (the shaded red box is a specific supply zone/Order Block).
Entry/Mitigation: The expectation is that the price (currently 1.32377) will rally into the unmitigated supply zone (the orange/red shaded area) to mitigate or fill institutional orders left behind from the initial strong sell-off.
Invalidation (Stop Loss): The Stop Loss (the top of the light-red shaded box) is placed safely above the high of the supply zone (or the highest swing point of the corrective move) to protect the trade if the market structure shift is invalidated.
Target (Take Profit): The Take Profit is aggressively set at the 1.30100 level (the blue horizontal line). This target is placed:
At a key psychological round number (1.3000).
Well below the most recent swing low, aiming for the next structural low and potentially the large liquidity below.
Summary of the Bias
The overall bias is Strongly Bearish (Short) on the Daily timeframe, based on the clear Market Structure Shift (MSS) and Break of Structure (Bos) to the downside. The current move up is seen as a correction or retracement designed to gather momentum (mitigate supply/order blocks) before the next impulsive move down.
Potential Trade Plan:
Direction: Short (Sell)
Entry: Wait for price to enter and show rejection/confirmation within the red/orange supply zone.
Stop Loss: Above the highest point of the supply zone (Light Red Box).
Target: 1.30100 or the next major liquidity low.


XAU/USD: Gold Stagnates, Poised for a Strong Surge📊 Market Structure
Gold is moving in a tight accumulation phase (compression) between two important zones:
• OB Support: 4,130 – 4,126
• Resistance – Small Supply: 4,148 – 4,166
The previous trend remains a strong uptrend (clear BoS sequence from 4,089), and currently, the price is retesting the newly formed peak-bottom structure.
The BUY side is still in control as long as the price stays above:
• 4,130 – Main OB Support
• 4,104 – Discount FVG
• 4,089 – Key Low Confirming Trend
If gold holds these zones, the next targets will be the upper liquidity levels:
• 4,166
• 4,181
• 4,207
• 4,243
💎 Key Technical Zones
• OB Support 1: 4,130 – 4,126
• FVG Zone: 4,104 – 4,089 (best discount)
• Deep Bearish OB: 4,060 – 4,045 (if price drops sharply)
• Upper Liquidity Targets: 4,166 → 4,181 → 4,207 → 4,243
🎯 Trading Plan (Priority BUY)
1️⃣ BUY 1 – Retest OB 4,130
When the price touches the OB support zone 4,130 – 4,126 and shows a bounce signal (rejection / engulfing).
• Entry: 4,130 – 4,126
• SL: below 4,115
• TP1: 4,166
• TP2: 4,181
• TP3: 4,207
• TP4: 4,243
→ Quick setup, good RR, trend aligned.
2️⃣ BUY 2 – Discount FVG 4,104 – 4,089
This is the best BUY zone if the market drops sharply before rising.
• Entry: 4,104 – 4,089
• SL: 4,070
• TP1: 4,166
• TP2: 4,181
• TP3: 4,207
• TP4: 4,243
→ Strong confluence: FVG + fibo discount + key liquidity.
3️⃣ BUY 3 – Deep Accumulation at Bearish OB Shift
• Entry: 4,060 – 4,045
• SL: 4,020
• TP: 4,104 → 4,166 → 4,207
→ Only activate if “flush liquidity” appears.
🎯 SELL Scalp (secondary – not priority)
Only SELL when there is a clear rejection reaction at:
• 4,166 – first liquidity sweep zone
• 4,181 – strong reaction zone
• 4,207 – main bearish OB
• 4,243 – large liquidity peak
• SL: 10–15 USD
• TP: 4,148 → 4,130
→ For scalpers only, not a main setup.
🧠 Vincent’s View
The market structure remains completely bullish. The market is accumulating energy in a narrow range before breaking strongly to the upper liquidity targets.
As long as gold stays above 4,089 – the uptrend remains dominant.
“Patience builds the entry – liquidity completes the move.” ⚜️
⏰ Timeframe: 1H
✍️ Analysis by: Captain Vincent

market on sideways#XAUUSD price is sideways, firstly from 4152 on M15 closure will drop the price till 4144 but we await for M30 to below 4141 which holds strong bearish.
Failure for close will become rejection zone which will correct back bullish.
Above 4167 - 4170 holds bullish breakout, price will range before the buy will continue but buy will be on valid breakout above 4167.

XAU/USD – Gold Holds Above Key Support as Pullback Stays LimitedGold remains capped below its two-week high during the Asian session, but the downside is clearly limited.
Market sentiment is shaped by:
A weaker USD as dovish Fed expectations gain traction
Rising probability of rate cuts in upcoming meetings
Improving global risk sentiment amid hopes of progress in Russia–Ukraine negotiations
Even though Gold is retracing, the bigger picture remains bullish as long as price holds above key support zones.
📊 Technical Outlook – MMF Trading Style (M30/H1)
Price is currently consolidating below the resistance cluster 4,156 – 4,170, retracing into multiple demand zones.
Key Levels to Watch
Support 1: 4,131 – 4,137
Support 2: 4,115 – 4,118
Support 3 (major liquidity): 4,083 – 4,090
Main Resistance: 4,170 – 4,193
Market structure shows a clean zigzag pullback, suggesting a potential bullish continuation once liquidity is collected below.
🎯 MMF Intraday Trading Plan
Scenario 1 – Buy the Dip (Primary Bias)
Best trade today: Buying retracements into demand.
BUY: 4,115 – 4,118
SL: 4,103
TP: 4,131 → 4,156 → 4,170
BUY (extended liquidity sweep): 4,083 – 4,090
SL: 4,070
TP: 4,118 → 4,145 → 4,170 – 4,193
Reason: Fibo confluence + strong demand + liquidity zone = high-probability reversal area.
Scenario 2 – Short-Term SELL (Scalp Only)
Only valid if price rejects strongly at resistance.
SELL: 4,156 – 4,170
SL: 4,177
TP: 4,145 → 4,131
This is not the main bias today.
⚜️ MMF Trading View
Gold is forming a healthy pullback—not, at this stage, a bearish reversal.
As long as price stays above 4,08x, the bullish structure remains intact.
“In Gold, the goal isn’t chasing the breakout — it’s waiting for price to return to value.”
Today’s focus: Prefer BUY setups on retracement – SELL only for quick scalps.


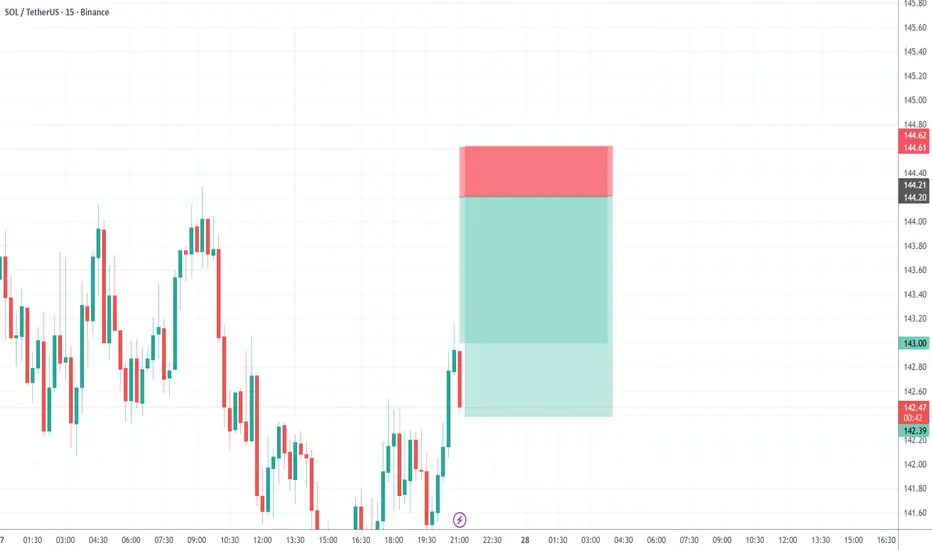
SOLUSDT SHORT Scalping SetupsResistance Rejection
Entry: 143.80 – 144.20
Stop loss: 144.60
TP: 143.00 → 142.40
NZDUSD 10HThe price has finally broken out of the downtrend and is now in a pullback phase. If the correction reaches a suitable zone and gets confirmation, we can get ready for a long position.

Gold: Narrow Volatility on ThanksgivingGold is showing a narrow-range oscillatory downward trend today. Influenced by the early close of the market for the U.S. Thanksgiving holiday, trading activity has turned sluggish. With no major news catalysts to drive momentum, it’s difficult to break out of the oscillatory range in the short term. However, the medium-to-long-term uptrend remains supported by multiple core factors.
During the early Asian session, gold briefly touched a high of 4168 before pulling back, and has been fluctuating within the 4140 - 4170 range overall—consistent with market expectations of thin trading and narrowed volatility during holidays.
Initial support lies around 4140, where buying interest has gradually emerged to form effective short-term support.
Key support focuses on the 4120 - 4130 zone, which is expected to effectively slow down further downward movement.
Immediate resistance is near 4170. From today’s price action, the market has pulled back after rallying to this range.
If broken, we will monitor yesterday’s resistance level at 4180.
Trading Strategy:
Buy 4140 - 4145
SL 4135
TP 4160 - 4165 - 4170
Sell 4165 - 4170
SL 4175
TP 4150 - 4145 - 4140

USD/JPY BEST PLACE TO SELL FROM|SHORT
USD/JPY SIGNAL
Trade Direction: short
Entry Level: 157.226
Target Level: 155.990
Stop Loss: 158.047
RISK PROFILE
Risk level: medium
Suggested risk: 1%
Timeframe: 2h
Disclosure: I am part of Trade Nation's Influencer program and receive a monthly fee for using their TradingView charts in my analysis.
✅LIKE AND COMMENT MY IDEAS✅

SHORT NIFTY :: 26400 is the top for the NIFTY There is no way, Nifty is going to crack up 26400 to the upside, without grabbing proper liquidity from the down side.

S&P 500 – DTF Technical & Fundamental AnalysisS&P 500 – DTF Technical & Fundamental Analysis
⚠️ S&P 500 Update – Short-Term Bullish, But Overall Structure Shows Weakness
The S&P 500 recently experienced a short-term bullish move after retesting the key support level at 6,500, which is now acting as a major support following the reversal. This rally was largely driven by major technology and AI-related firms, especially Alphabet. Strong earnings and leadership in generative AI have boosted investor confidence, propelling the index to new highs.
Despite this, technical factors suggest caution. On the daily timeframe, the overall market structure after the bullish trend is forming lower highs and lower lows, indicating that buyers are losing momentum. This rally could be temporary, largely representing liquidity grabs above previous highs rather than a true trend reversal. From a technical perspective, 6,500 is a critical support zone. If this level holds, the S&P 500 could continue the short-term bullish move. However, if this level breaks with high volume, a deeper correction may follow, potentially targeting the next major demand zone around 6,370.
The market remains highly reactive to both technical triggers and fundamental news, so caution is advised. Watch key levels closely and wait for confirmed structure before taking positions.
⚠️ Risk Disclaimer
This analysis is for educational purposes only and is not financial advice. Trading CFDs and Forex involves high risk. Always trade responsibly and manage your risk.

Bullish trendCAPITALCOM:GOLD is consolidating the 4160-4170 as a very strong resistance. If it crosses. The next stop is around 4200. If it bounces back we can see 4140 as a support.

USDJPY currently on a resistance leveltoday's market analysis for USDJPY, it seems the USDJPY is currently on a bearish run with a very sensitive area.
if the price breaks the resistance line then this whole setup is canceled and we might be looking for a bullish approach.
Note: you should be looking for today's financial news regarding USD.

EUR/GBP Trade Setup — Bullish OpportunityOn EUR/GBP, price has recently broken above a key resistance area that previously rejected price multiple times. After the breakout, price returned to the same zone, where it is now showing signs of support. This is a classic example of resistance turning into support, suggesting that buyers are defending this level.
At the same time, price has filled a fair value gap (FVG) created during the bullish move. When the imbalance gets filled, the market often establishes a stronger foundation for continuation in the same direction.
With buyers reacting to both the support zone and the FVG, this area becomes a potential bullish entry point. A stop loss placed just below the support protects the position if buyers fail to hold it, while targeting the recent swing high provides a 1:3 risk-to-reward setup.
📈 Bias: Bullish
🟦 Zone of Interest: Support + FVG
🎯 Target: Previous swing high
🛡 Stop Loss: Below support

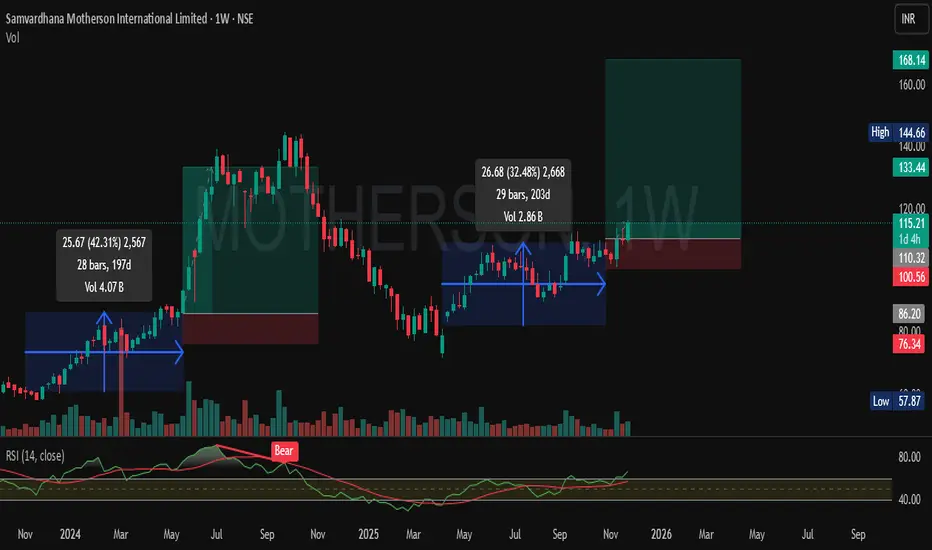
MOTHERSON CMP 115.(Positional with strict stoploss)Motherson trading above all short term moving averages.RSI trading above 60. Showing strenth in price. Have enough space for uptrend rally.Add this to your watchlist and see how it perform in coming days thanks for support.
GBPUSD Breakout and Potential RetraceHey Traders, in today's trading session we are monitoring GBPUSD for a buying opportunity around 1.31100 zone, GBPUSD was trading in a downtrend and successfully managed to break it out. Currently is in a correction phase in which it is approaching the retrace area at 1.31100 zone.
Trade safe, Joe.

Im selling gold CFDs#GOLD downfall starts very soon.
Becareful buying at the top range, we are lokely to visit 3,700.00$ hashtag#XAU
Downchannel formed around 4 Hours time frame plus symetrical triangle im very bearish now.

AUDJPY Trading Opportunity! BUY!
My dear followers,
I analysed this chart on AUDJPY and concluded the following:
The market is trading on 100.92 pivot level.
Bias - Bullish
Technical Indicators: Both Super Trend & Pivot HL indicate a highly probable Bullish continuation.
Target - 101.16
Safe Stop Loss - 100.81
About Used Indicators:
A super-trend indicator is plotted on either above or below the closing price to signal a buy or sell. The indicator changes color, based on whether or not you should be buying. If the super-trend indicator moves below the closing price, the indicator turns green, and it signals an entry point or points to buy.
Disclosure: I am part of Trade Nation's Influencer program and receive a monthly fee for using their TradingView charts in my analysis.
———————————
WISH YOU ALL LUCK

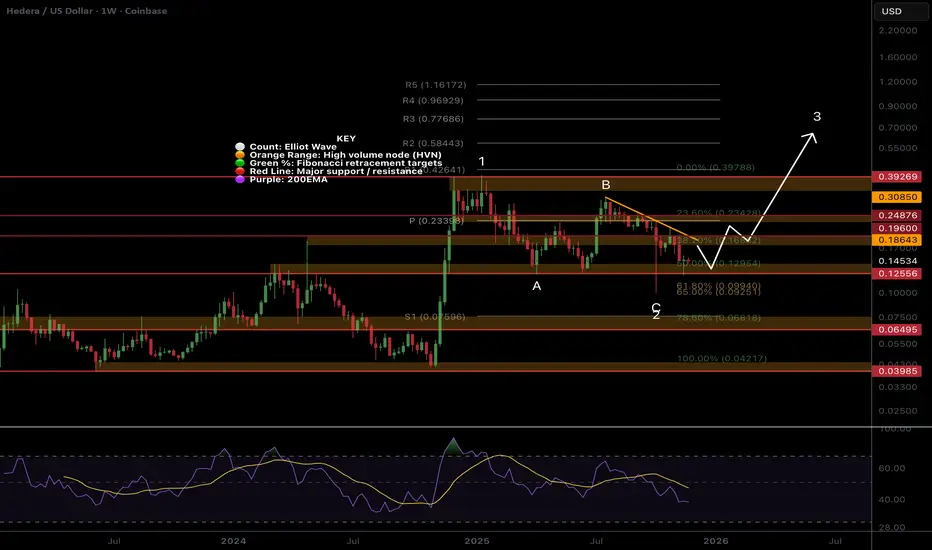
HBAR still holding strongCRYPTOCAP:HBAR Price has printed a textbook ABC for wave 2, but as long as we are below the descending trend-line, the probability is lower still. The wick has now been revisited, which is expected behaviour.
Price is below the weekly pivot. The next downside target is the S1 pivot at $0.075, which is also the alt-coin golden pocket, 0.786 Fibonacci retracement and High Volume Node support.
🎯 Terminal target for the business cycle could see prices as high as $0.8
📈 Weekly RSI is bearish with no divergence
👉 Analysis is invalidated if we close below wave 2, keeping wave 2 alive.
Safe trading
eth short term eth might be forming wave 4 here expecting a short term bounce around 2700$ level
tp and sl are mentioned in the chart
