DOGE, Weekly bullish divergence!Uptrend remains intact from the wave 4 bottom. We could still be in wave 4 as they are characterised by their long, complex ranges. A flat or a triangle is possible.
Wave (1) appears complete as a leading diagonal followed by a deep wave (2), which is expected after this pattern. Price is bullishly riding the weekly 200EMA but bearish below the pivot. Wave (3) should be powerful and fast; any slow grind may hint that we are still in wave IV
🎯 Terminal target for the business cycle could see prices as high as $1.7 based on Fibonacci extensions
📈 Weekly RSI has printed bullish divergence, a good sign but it can take weeks to play out
👉 Analysis is invalidated below wave (2)
Community ideas

ALPHUSDT Forming Falling WedgeALPHUSDT is forming a clear falling wedge pattern, a classic bullish reversal signal that often indicates an upcoming breakout. The price has been consolidating within a narrowing range, suggesting that selling pressure is weakening while buyers are beginning to regain control. With consistent volume confirming accumulation at lower levels, the setup hints at a potential bullish breakout soon. The projected move could lead to an impressive gain of around 90% to 100% once the price breaks above the wedge resistance.
This falling wedge pattern is typically seen at the end of downtrends or corrective phases, and it represents a potential shift in market sentiment from bearish to bullish. Traders closely watching ALPHUSDT are noting the strengthening momentum as it nears a breakout zone. The good trading volume adds confidence to this pattern, showing that market participants are positioning early in anticipation of a reversal.
Investors’ growing interest in ALPHUSDT reflects rising confidence in the project’s long-term fundamentals and current technical strength. If the breakout confirms with sustained volume, this could mark the start of a fresh bullish leg. Traders might find this a valuable setup for medium-term gains, especially as the wedge pattern completes and buying momentum accelerates.
✅ Show your support by hitting the like button and
✅ Leaving a comment below! (What is your opinion about this Coin?)
Your feedback and engagement keep me inspired to share more insightful market analysis with you!

EURUSD FRGNT Daily Forecast - Q4 | W48| D27 | Y25 |📅 Q4 | W48| D27 | Y25 |
📊 EURUSD FRGNT Daily Forecast
🔍 Analysis Approach:
I’m applying Smart Money Concepts, focusing on:
Identifying Points of Interest on the Higher Time Frames (HTFs) 🕰️
Using those POIs to define a clear trading range 📐
Refining those zones on Lower Time Frames (LTFs) 🔎
Waiting for a Break of Structure (BoS) for confirmation ✅
This method allows me to stay precise, disciplined, and aligned with the market narrative, rather than chasing price.
💡 My Motto:
"Capital management, discipline, and consistency in your trading edge."
A positive risk-to-reward ratio, paired with a high win rate, is the backbone of any solid trading plan 📈🔐
⚠️ Losses?
They’re part of the mathematical game of trading 🎲
They don’t define you — they’re necessary, they happen, and we move forward 📊➡️
🙏 I appreciate you taking the time to review my Daily Forecast.
Stay sharp, stay consistent, and protect your capital
— FRNGT 🚀
FX:EURUSD

$ATOM 1H - Bull FlagNASDAQ:ATOM 1H Chart
Price is forming a clean bull flag right on top of the 15m FVG support zone.
A breakout above the flag resistance opens the path for the next leg up, targeting a strong +3% move.
#COSMOS #ATOM

ETHUSD H4 | Bearish Reversal Off Pullback ResistanceMomentum: Bearish
Price is rising toward the sell entry, which sits slightly above the 50% Fibonacci retracement and remains below the Ichimoku Cloud — maintaining a bearish bias.
Sell Entry: 3,208.29
Pullback resistance
Slightly above the 50% Fibonacci retracement
Stop Loss: 3,402.89
Pullback resistance
Aligning with the 50% Fibonacci retracement
Take Profit: 2,786.67
Pullback support
High Risk Investment Warning
Stratos Markets Limited (tradu.com), Stratos Europe Ltd (tradu.com ):
CFDs are complex instruments and come with a high risk of losing money rapidly due to leverage. 70% of retail investor accounts lose money when trading CFDs with this provider. You should consider whether you understand how CFDs work and whether you can afford to take the high risk of losing your money.
Stratos Global LLC (tradu.com): Losses can exceed deposits.
Please be advised that the information presented on TradingView is provided to Tradu (‘Company’, ‘we’) by a third-party provider (‘TFA Global Pte Ltd’). Please be reminded that you are solely responsible for the trading decisions on your account. Any information and/or content is intended entirely for research, educational and informational purposes only and does not constitute investment or consultation advice or investment strategy. The information is not tailored to the investment needs of any specific person and therefore does not involve a consideration of any of the investment objectives, financial situation or needs of any viewer that may receive it. Past performance is not a reliable indicator of future results. Actual results may differ materially from those anticipated in forward-looking or past performance statements. We assume no liability as to the accuracy or completeness of any of the information and/or content provided herein and the Company cannot be held responsible for any omission, mistake nor for any loss or damage including without limitation to any loss of profit which may arise from reliance on any information supplied by TFA Global Pte Ltd.

Gold uptrend wedge Hello guys, it looks like gold has formed a wedge on the 4hr chart. Let’s see where this trend goes.

SP500 short-term consolidation renewed bullish strength.SP500 has rebounded strongly from the recent demand zone near 6,630–6,650, showing a clear shift in momentum toward the upside. Price has broken out of the short-term consolidation, indicating renewed bullish strength.
Technically Price previously traded inside an ascending channel but recently dipped out after the drop, bulls stepped in at the demand zone and pushed price upward aggressively the current move suggests the market may attempt to re-test the upper levels.
If price sustains above this level, it confirms strong bullish continuation 68,00 to 69,05 This is the upper resistance zone from the previous highs a break above this area may open the door toward a new bullish wave.
You may find more details in the chart,
Trade wisely best of Luck Buddies.
Ps; Support with like and comments for better analysis Thanks for Supporting.

MSTR Falls into Major Support—Bounce coming soon??MSTR dropped into major support and printed a bullish divergence, hinting that sellers are exhausted. MSTR & Cryptos are highly correlated, and they look like they're shifting into a quiet accumulation phase after crypto's major correction following the big washout.
Entry: Accumulation on major support 180-150.
SL: if Major support break,.
TPs: 250 → 300
Setup invalid if support breaks.

ETH Technical Analysis: Relief Bounce, But the Downtrend RemainsETH Technical Analysis: Relief Bounce, But the Downtrend Remains Intact
1. ETHUSD has been forming lower swings continuously, reinforcing a dominant downtrend. Supported by a sign of bearish EMA stack to the 100 EMA, signalling a broader corrective phase with strong bearish momentum.
2. There are still no bullish reversal signals yet, suggesting that any rebound is likely to be a short-term relief rally, forming a lower high before the downtrend resumes.
3. Initial resistance is seen near 3,275, where former support and the EMA20 may act as a supply zone before another leg lower.
4. If ETHUSD breaks below support at 2,730, it could unlock further downside toward the next key support around 2,100.
Analysis by: Krisada Yoonaisil, Financial Markets Strategist at Exness

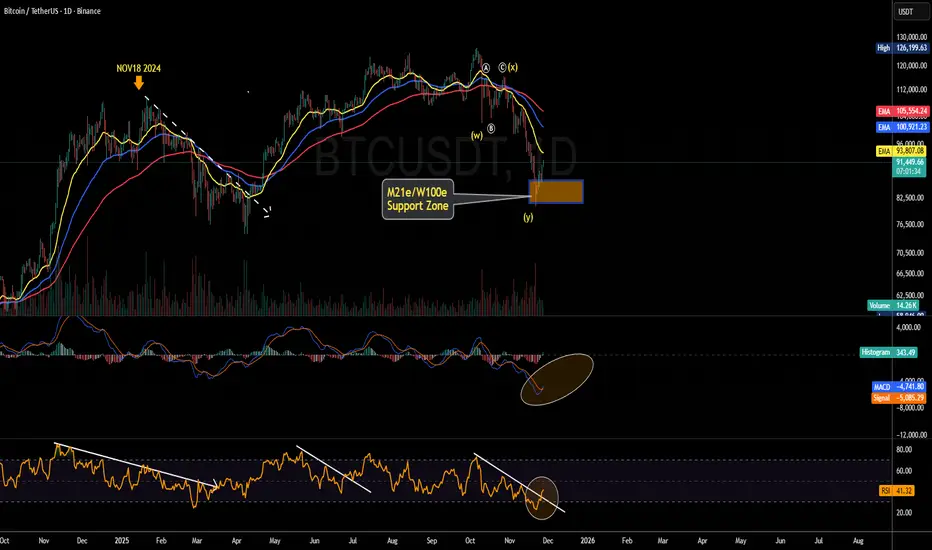
The Path to an Imminent Bitcoin ReversalBitcoin may be establishing a near-term low.
However, for a confirmed reversal signal and to validate a counter-trend rally targeting the 21-week moving average, the market requires bullish confirmation on higher timeframes.
The primary development to monitor is the potential formation of a bullish divergence on the 12-hour and daily charts, characterized by price action forming a double bottom (or even lower lows) pattern coinciding with rising lows on the RSI and MACD indicators.
No significant buying volume yet.
GBPUSD H4 | Bearish Reaction Off Key ResistanceMomentum: Bearish
Price is currently below the ichimoku cloud on the higher timeframe, showing bearish market structure.
Sell entry: 1.32914
- Pullback resistance
- 61.8% Fib retracement
- 127.2% Fib extension
Stop Loss: 1.33746
- Swing high resistance
Take Profit: 1.32012
- Pullback support
High Risk Investment Warning
Stratos Markets Limited (tradu.com/uk ), Stratos Europe Ltd (tradu.com/eu ):
CFDs are complex instruments and come with a high risk of losing money rapidly due to leverage. 70% of retail investor accounts lose money when trading CFDs with this provider. You should consider whether you understand how CFDs work and whether you can afford to take the high risk of losing your money.
Stratos Global LLC (tradu.com/en ): Losses can exceed deposits.
Please be advised that the information presented on TradingView is provided to Tradu (‘Company’, ‘we’) by a third-party provider (‘TFA Global Pte Ltd’). Please be reminded that you are solely responsible for the trading decisions on your account. Any information and/or content is intended entirely for research, educational and informational purposes only and does not constitute investment or consultation advice or investment strategy. The information is not tailored to the investment needs of any specific person and therefore does not involve a consideration of any of the investment objectives, financial situation or needs of any viewer that may receive it. Past performance is not a reliable indicator of future results. Actual results may differ materially from those anticipated in forward-looking or past performance statements. We assume no liability as to the accuracy or completeness of any of the information and/or content provided herein and the Company cannot be held responsible for any omission, mistake nor for any loss or damage including without limitation to any loss of profit which may arise from reliance on any information supplied by TFA Global Pte Ltd.

GBPJPY H1 | Bullish Bounce Off Key SupportMomentum: Bullish
Price is currently above the ichimoku cloud, and price is above the ascending trendline.
Buy entry: 205.915
- Overlap support
- 61.8% Fib retracement
Stop Loss: 205.095
- Multi-swing low support
Take Profit: 207.062
- Swing high resistance
High Risk Investment Warning
Stratos Markets Limited (tradu.com/uk ), Stratos Europe Ltd (tradu.com/eu ):
CFDs are complex instruments and come with a high risk of losing money rapidly due to leverage. 70% of retail investor accounts lose money when trading CFDs with this provider. You should consider whether you understand how CFDs work and whether you can afford to take the high risk of losing your money.
Stratos Global LLC (tradu.com/en ): Losses can exceed deposits.
Please be advised that the information presented on TradingView is provided to Tradu (‘Company’, ‘we’) by a third-party provider (‘TFA Global Pte Ltd’). Please be reminded that you are solely responsible for the trading decisions on your account. Any information and/or content is intended entirely for research, educational and informational purposes only and does not constitute investment or consultation advice or investment strategy. The information is not tailored to the investment needs of any specific person and therefore does not involve a consideration of any of the investment objectives, financial situation or needs of any viewer that may receive it. Past performance is not a reliable indicator of future results. Actual results may differ materially from those anticipated in forward-looking or past performance statements. We assume no liability as to the accuracy or completeness of any of the information and/or content provided herein and the Company cannot be held responsible for any omission, mistake nor for any loss or damage including without limitation to any loss of profit which may arise from reliance on any information supplied by TFA Global Pte Ltd.

NZDUSD ShortThe overall direction of the trend has been bearish since July 2025. The trajectory has been on continual decline. Price to make another short bullish consolidation before another continual crash downwards.

GBPJPY Analysis Read The CaptionPrice is pulling back toward the marked support zone. If it breaks and retests this support area, bearish momentum can continue toward the lower target level. Watch for rejection candles or a clean breakdown before entering.

TIA AI coin round 2Who could forget that crazy rally during the AI coin frenzy in late'23. There are some good projects that are sold beyond belief and I think TIA looks like it is making a nice base here, we appear to have reached seller exhaustion. Easy punt with a small amount, around $1000 for me, I don't really need a stop on this trade, I'm happy to be wrong in the event BTC continues down further.

Buying EUR AUD at support with plans to add Aiming to build up a swing trade of 3 entries with a small stop for potential big winner.
looks like a bull channel, where one pullback is arguably out of the channel. Buying at support.
Important to move the stops when you add the winners, as the risk for this trade should not be significant.
Add winners with ORDERS. RR at least 1:3, if adding to winners it can be 1:10.

USDJPYwe break down a high-probability sell setup on the USD/JPY pair using technical analysis from both the 15-minute From last week, we’ve been tracking a steady bearish structure on the USD/JPY, driven by continued weakness in the United States Dollar against the Japanese Yen.
analyze momentum behavior using the Bollinger Bands, where price is currently reacting from the upper band edge, signaling potential exhaustion of buyers and increasing the dominance of sellers.

BTCUSD: Wave Pendulum on the Verge of ReversalBTCUSD: Wave Pendulum on the Verge of Reversal
BTCUSD Wave Overview (H4/D1)
According to its wave structure, Bitcoin is completing its corrective phase and preparing to form a new impulse. Current dynamics indicate a possible end to the sideways movement and a transition to the final wave of a larger cycle.
Primary scenario: A downward impulse sequence is expected to develop after the correction is complete. Alternative scenario: If the market consolidates above recent highs, it could continue to rise, delaying the start of a new downward wave.
Idea for traders: watch for confirmation of the structure on lower timeframes and enter only after clear reversal signals appear.

RAND (ZAR) FLEXES MUSCLE POST-G20 BOOST ???Peace be unto you!!!
Primary Chart: USDZAR Analysis (Daily Timeframe)
Wave Analysis:
Price is completing a sideways correction that started printing in May 2023. This sideways correction in an intermediate wave (4). Minor wave A started the correction and terminated in September 2024 and minor wave B terminated in April 2025. The market is currently printing minor wave C to complete intermediate wave (4).
Indicator(s) Analysis:
1) EMA 200 & 50 (Weekly) - We may see price rally to touch these moving average lines before it continues to drop.
2) RSI 14 (Weekly) - RSI line rallying to retest 49.20 levels, it may also rally to 61.98 levels to create a Hidden Bearish Divergence.
3) MACD H (Weekly) - Faint bullish MACD H signaling that bulls are running out of steam, giving a clear signal for a Bearish Divergence.
Fundamental Analysis:
The South African government delivered a successful first G20 Leaders' Summit on the 22nd and 23rd of November 2025 that came with several billion dollars committed to few developmental projects in the country. As a result, we are seeing the rand (ZAR) strengthens against the US Dollar in the short & medium term. This will lead to a decrease in the cost of imported raw materials/goods for local consumers and businesses amongst other positive impacts.
#SabaliCapital
#TechnicalAnalysis
#G20

Heading into key resistance?Gold (XAU/USD) is rising towards the pivot and could reverse to the 1st support, which acts as an overlap support.
Pivot: 4,221.15
1st Support: 4,027.94
1st Resistance: 4,364.63
Disclaimer:
The opinions given above constitute general market commentary and do not constitute the opinion or advice of IC Markets or any form of personal or investment advice.
Any opinions, news, research, analyses, prices, other information, or links to third-party sites contained on this website are provided on an "as-is" basis, are intended to be informative only, and are not advice, a recommendation, research, a record of our trading prices, an offer of, or solicitation for, a transaction in any financial instrument and thus should not be treated as such. The information provided does not involve any specific investment objectives, financial situation, or needs of any specific person who may receive it. Please be aware that past performance is not a reliable indicator of future performance and/or results. Past performance or forward-looking scenarios based upon the reasonable beliefs of the third-party provider are not a guarantee of future performance. Actual results may differ materially from those anticipated in forward-looking or past performance statements. IC Markets makes no representation or warranty and assumes no liability as to the accuracy or completeness of the information provided, nor any loss arising from any investment based on a recommendation, forecast, or any information supplied by any third party.

GBPUSD Trade Plan Pending POC Reclaim and BOS ConfirmationI'm watching the GBP/USD closely right now. The pair has been moving in a strong, sustained bullish trend, and we're currently seeing a healthy pullback develop. 🔄
🐂
My focus is on the Volume Profile Point of Control (POC) — if price reclaims and holds above this key level, it could signal a shift back in favour of the buyers. 📊
✨
Should we then get a bullish break of structure, that’s where I’ll be looking for a Buy opportunity to trade with the prevailing trend. 🎯
📈
Not financial advice — for educational purposes only.
---

JIO Financial Services- Swing trading Opportunity Chart is analysed based on
1. Time frame - Weekly ( Daily is also being considered )
2. Techicals/Indicators used- PIvots , Trend lines, Chart patterns
It is clear from the chart a ascending triangle pattern is formed which indicates that price may go long when it breaks upper level.

