US2000 Bearish Alert: Institutional Shorts Spike 300%, TechnicalInstitutional Sentiment Shift
Net short interest exploded from –30K in early July to –90K by early August—a 300% jump in bearish conviction.
Daily Chart:
On August 1, US2000 closed below key support, carving a lower low—the first technical indication of a bearish reversal.
Weekly Chart:
A clear bearish engulfing candlestick reinforces the likelihood of further downside.
Macro & Market Backdrop:
• The Fed remains hawkish, quashing near-term rate cut expectations.
Reuters
• Small-caps continue to underperform—Russell trades rich but offers less structural strength compared to large-caps.
MarketWatch
• With stagflation risks rising, small/mid-cap companies could face underperformance and tighter financing conditions.
MarketWatch
Bottom Line:
With institutional short positioning intensifying, market structure turning bearish, and macroeconomic challenges mounting, the US2000 is poised for further pressure. Traders—watch for follow-through declines.
Community ideas

$BNB Is ready for $1k USDLow 700s before continuation?
This one’s been coiling up beautifully — still waiting on that strong move to hit.
OKX:CATUSDT and BINANCE:CAKEUSDT are part of the rotation I’m betting on.
BINANCE:BNBUSDT has one of the strongest consolidation structures among high caps — and it’s also one of the biggest laggards.
Looks like a setup worth the risk.

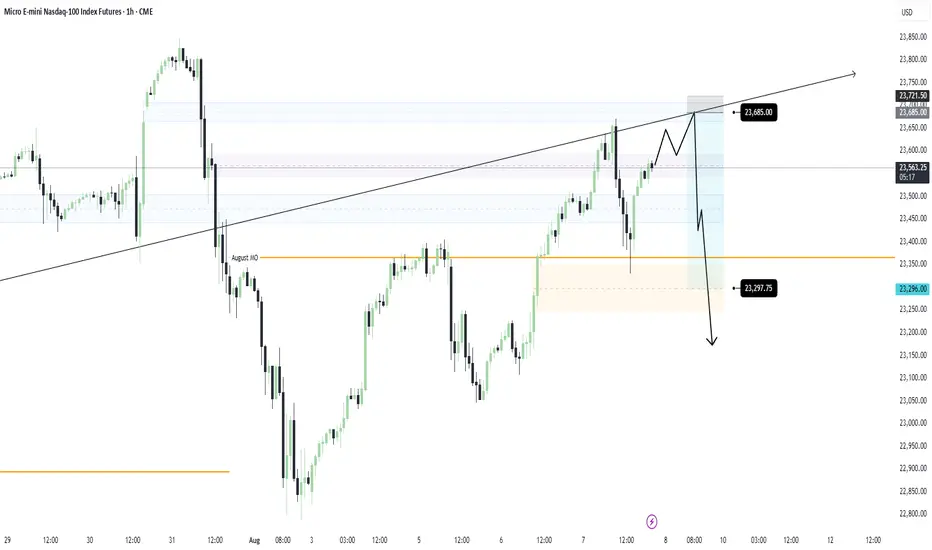
NQ Short Bias: Previous NWOG RejectionI missed today’s sell-off by 60 ticks, but price respected Monthly Open support and retraced back near intraday highs. That reaction reinforces my bias: I’m still anticipating the dump that will likely happen tomorrow.
Ideally, price completes the Double Top within the prior NWOG zone, then falls slightly before or exactly at NY Open for a clean downhill ride.
My entry will be at 23,685.00
Target will be around the low 23,300.00s
I feel like we can definitely fall further than my target, so I will have trailing Stop in place once price reaches my target.
Lets see how this goes⚡
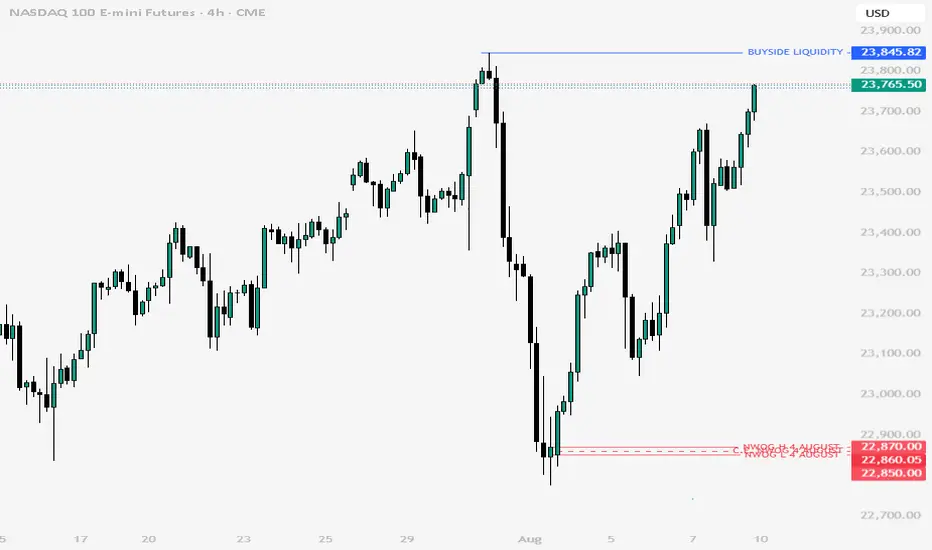
Nq & Es Key Levels 08-08-2025 After from my morning forecastFinally, the price moved up as we predicted before the market opened at 09:30.
BTC Elliott Wave medium term analysisCRYPTOCAP:BTC is still consolidating, as shown on the charts.
The structure is shaping up like a classic Elliott Wave 1–2–3–4–5 pattern, with the 4th wave now in play.
This could mean another retest of $110,500 before launching into the final, larger 5th wave 🚀.
The 4th wave might present a solid long entry opportunity heading into the 5th.
📊 DYOR – trade safe.

$ETHso who all recon we deviate back here? or in this zone??
a retest of $4k will come not sure when but have marked that out
for now looking for blue line above
dominance still pissing around with the trend line
God candles pending on alts
PTSD is making me cautious but also time to put your pedal to the metal

Gold prices are expected to break through $3,500 next week.Gold prices are expected to break through $3,500 next week.
Here are my latest political takeaways on gold.
1: The market currently sees a 92% chance of a Federal Reserve rate cut in September.
If next week's US July CPI data (expected to be released on August 12) falls short of expectations, it could further reinforce expectations of a rate cut, which would be bullish for gold.
If the data is stronger than expected, it could temporarily put pressure on gold prices.
2: Recently, Fed officials such as Cook and Daly have adopted dovish stances, highlighting labor market weakness and inflation risks. The market will closely monitor their subsequent comments.
3: US tariff policy interruptions
The Trump administration announced tariffs on imported 1 kg and 100 ounce gold bars, primarily targeting refining centers like Switzerland. This could tighten US gold supply and push up futures premiums (New York gold futures briefly traded over $100 above spot).
4: If tariff policies are further clarified or expanded (for example, to include 400-ounce gold bars), this could exacerbate market volatility and strengthen gold's safe-haven properties.
5: Global Central Bank Gold Purchase Trends
The People's Bank of China has increased its gold holdings for nine consecutive months (adding another 60,000 ounces in July), and over 90% of global central banks plan to continue increasing their holdings over the next 12 months, providing long-term support for gold prices.
6: If other central banks (such as India and Russia) announce new gold purchase plans, this could boost market sentiment.
7: Geopolitical Risks
US-Russia Relations: If the US-Russia summit goes poorly, it could exacerbate risk aversion.
Middle East Situation: Any rumors of escalating conflict or supply disruptions could be bullish for gold.
8: If the spread between New York gold futures and spot prices continues to widen (currently at a premium of approximately $100), it could trigger carry trades or delivery pressure.
Changes in COMEX inventories warrant attention.
Technical Analysis:
Key Price Levels
Resistance:
$3400-3408 / $3438-3450 / $3500.
Support:
$3380-3385 / $3370 / $3350.
Daily Chart:
Gold is consolidating in an ascending triangle pattern.
If it breaks above $3400, it could test the $3438-3450 area.
If it falls back, watch the $3380 support level.
Trading Strategy for Next Week:
Short-term intraday strategy:
If gold holds above $3400, continue buying with a target of $3438-3450.
If it falls below $3380, it could fall to the $3350-3370 area.
Band layout: layout on dips, stop loss reference $3350, target $3500-3631

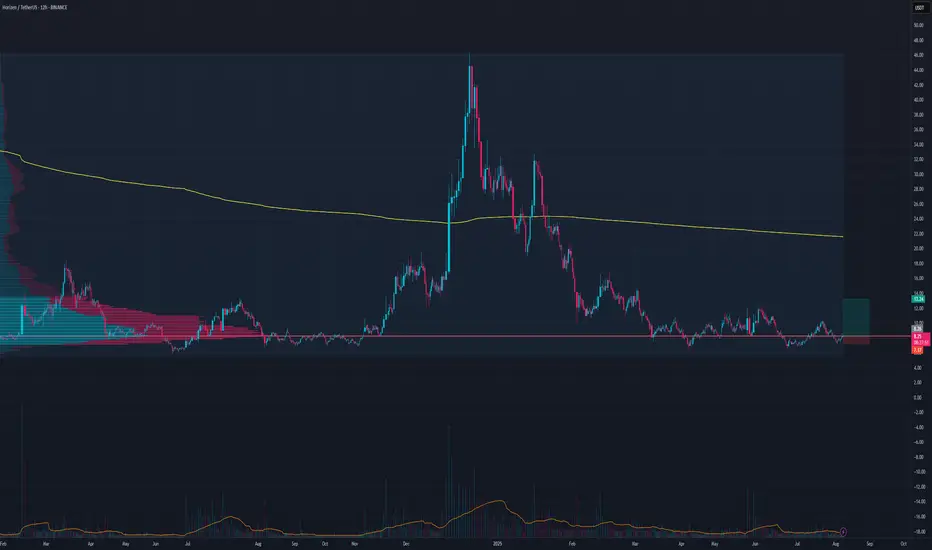
I'm bullish alt coinsThis is just one setup but I'm bullish on this sector
TP1 13.24
TP2 21
TP3 29
TP4 65
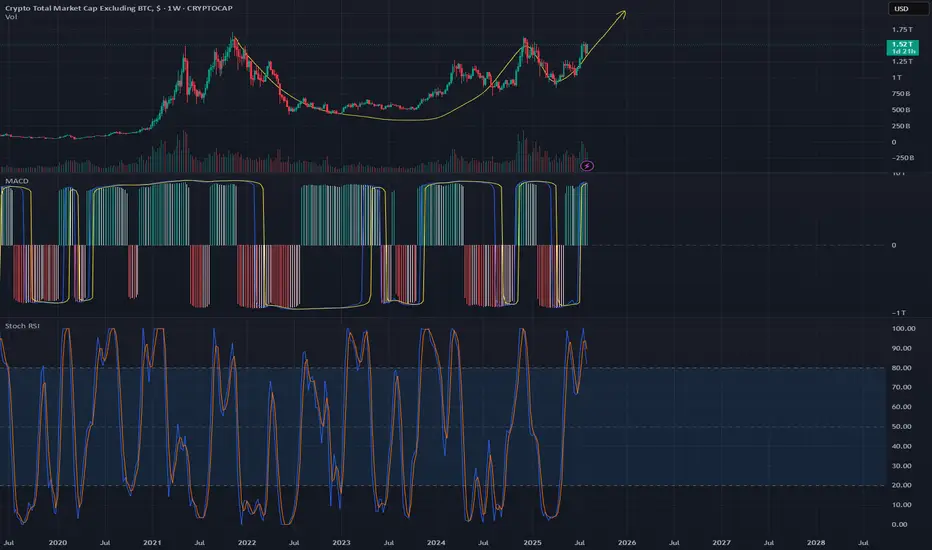
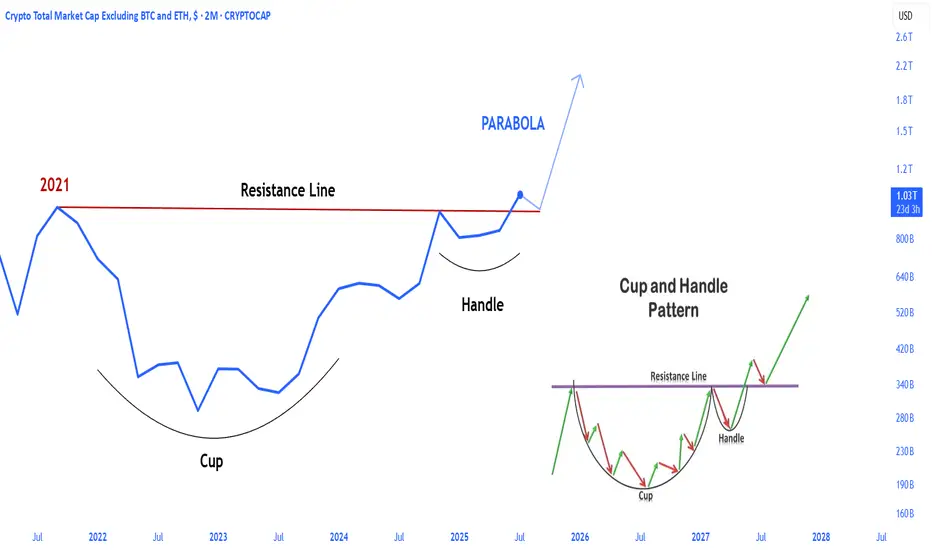
Huge multi-year Cup and Handle Formation for CRYPTO ALTSThe alts are on the cusp of breaking out from a mult-year cup and handle pattern. With macro factors in a continuously positive environment and momentum, the technical bull case cup and handle formation all point to a massive breakout. Stay tuned and keep safe!
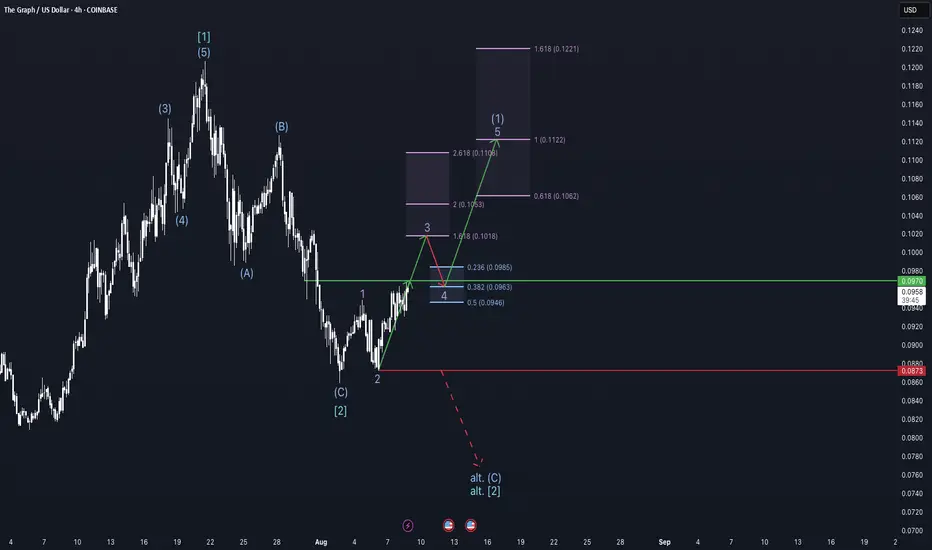
Chasing new highs - GRT weekly update August 8 - 14thThe Graph (GRT) has formed two higher-degree 1–2 setups — one at the Cycle degree and one at the Primary degree — creating a structurally bullish foundation. At the Intermediate degree, price is currently advancing in Wave 1, while at the Minor degree, it is in Wave 3, the most dynamic phase of an impulse. This alignment of early waves across degrees suggests a potentially strong continuation if key resistance levels are broken.
The immediate bullish confirmation comes from a break above the $0.097 resistance, which would open the door for a sustained rally toward the $0.106–$0.122 zone, based on Fibonacci extensions. However, there is an alternative scenario: if the market fails to clear $0.097 and sells off, breaking the $0.0873 support, it would indicate that Intermediate Wave C and therefore Primary Wave 2 are not yet complete. In that case, a final low to complete the larger correction would be expected before the uptrend resumes.
From a sentiment perspective, funding rates are positive, and open interest is rising, showing increasing long exposure. The liquidity heatmap reveals significant liquidity resting below current price, with only minor clusters above — a configuration that could invite a short-term liquidity sweep before continuation.
This setup also needs to be viewed in the context of broader macroeconomic conditions. For much of this year, capital inflows into crypto were limited by the Federal Reserve’s restrictive monetary policy. However, the CME FedWatch Tool now shows a 89.1% probability of a rate cut at the September FOMC meeting. Markets tend to front-run such events, and this expectation could fuel Wave 3 advances across the crypto sector. But with anticipation running high, there is also the risk of a sell-the-news reaction, particularly if retail traders over-leverage into the move.
It’s worth noting that this structure in GRT closely mirrors many other altcoin charts at the moment — a sign of high correlation within the crypto market.
As long as the $0.097 resistance is broken and the $0.0873 level remains intact, the probability favours the bullish scenario — with a multi-degree Wave 3 advance potentially underway, fueled by both technical structure and macro catalysts.
Break and Retest Idea for BitcoinLooking to test this break and retest setup on 2hr for bitcoin. Mark up says it all.

Bitcoin remain bullish Btcusd remain bullish, with price showing signs of strength.
I am seeing a stable trend with minimal vitality, indicating potential continuation of the uptrend.
Resistance and support level on daily timeframe
Resistance 117,672
Support 115,894
Trade setup
Entry 116,500
Stop loss 115,800
Take profit 117,500

Sell GBP/USD into trend line to resume recent trend.Sell GBP/USD into recent trend line to resume the trend into 200 Daily MA.
Please note : Adjust profit target as 200 Daily MA will change everyday.
Sell : 1.3460 Trend line
Stop : 1.3552 Above 50 Daily MA
Profit : 1.3000 ( 200 Daily MA ) changes everyday
Risk 1:5

$ETH - Rising WedgeCRYPTOCAP:ETH | 4h
Price remains within the ascending wedge on the 4h chart, showing a triple tap on the trendline.
On lower timeframes, watching 3880 as local support for a possible bounce.
Upside levels to monitor are 4120–4215 for potential rejection, though an ideal pullback would see the lower trendline tested at 3770–3680.

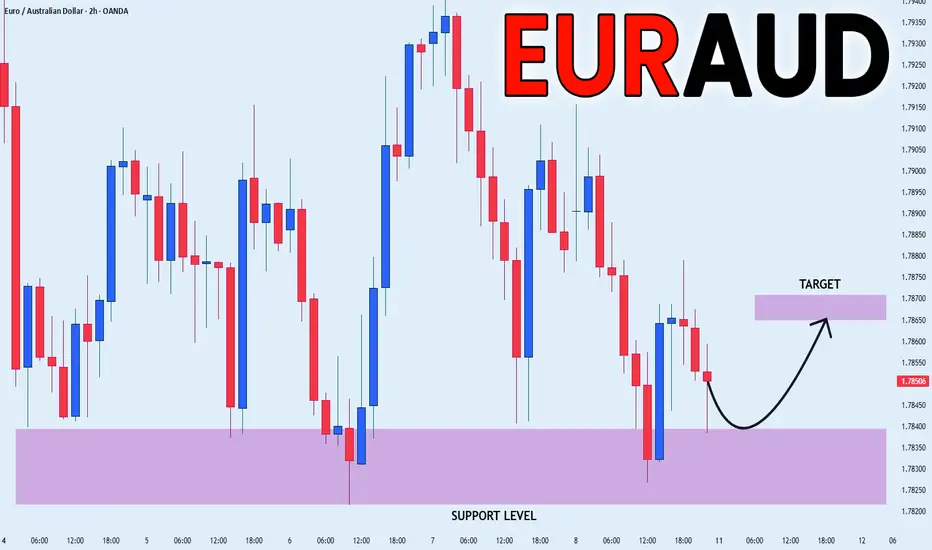
EUR_AUD LOCAL LONG|
✅EUR_AUD is going down now
But a strong support level is ahead at 1.7820
Thus I am expecting a rebound
And a move up towards the target of 1.7865
LONG🚀
✅Like and subscribe to never miss a new idea!✅
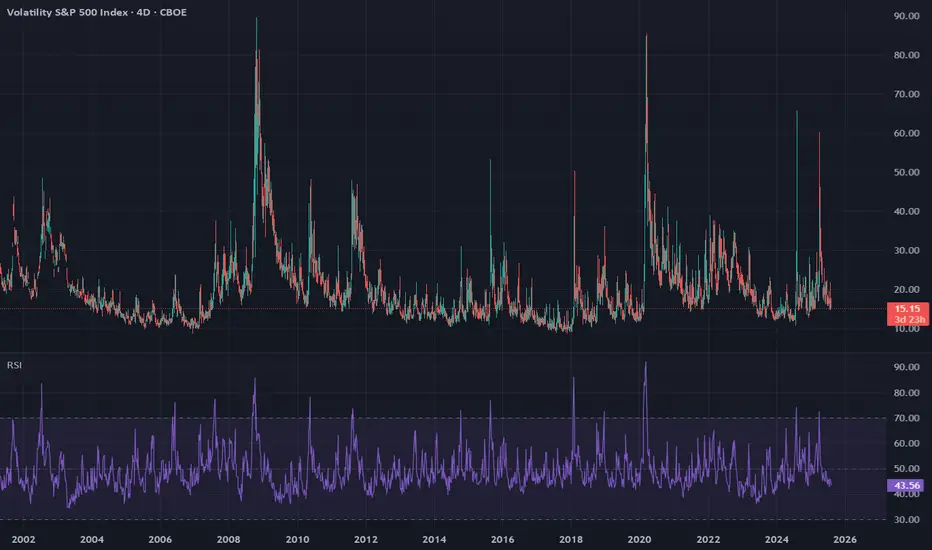
Have we entered a brand new normal or is a crash coming?The market's bullish narrative rests first and foremost on the control of volatility. I won't go too much deeper into that right now, but I have been discussing with AI the current period of volatility expression and would like to highlight the following points about the current period:
4d VIX RSI has not had a 5 point increase since April 1 of this year. That's 129 days and counting.
From Claude AI (Anthropic):
The ongoing 4 day VIX RSI fall period (started April 1, 2025, now at 128+ days) is completely unprecedented since September 2003 (when VIX formula was modernized).
That's already:
More than double the longest ever previous period of in October 28, 2020 to Jan 27, 2021 (63 days)
Nearly 10x longer than the average period (13.14 days)
Over 12 standard deviations beyond the mean
The only period ever to exceed 70 days since September 2003
Key Insight:
Since September 2003, 67.3% of all fall periods recovered within 2 weeks, and 84.2% recovered within 3 weeks. The current 128+ day period represents an extreme statistical outlier in modern VIX behavior.
Additionally, if we look at the S and P week chart, we see that the gap from May 9 to May 12 is the largest ever unfilled weekly gap in the entire history of the S and P.
We are currently in a whole new normal of "bullishness", akin to the time period just before the great crash and great depression (which was the most bullish the stock market has ever been).
XAUUSD – HTF structure points to higher TPLooking at the higher timeframe structure, this 4H move is aligning perfectly with bullish momentum. Even if we see a pullback, it’s likely just a retest for continuation — not a full reversal.
Key points:
• HTF bias: Bullish, with room beyond local 3,440 resistance
• Pullback zones: 3,377 / 3,361 — both valid re-entry levels if retested
• Targets: First watch 3,508, but HTF suggests we can push higher
• Plan: Stay patient, treat dips into structure as opportunities to stack buys
Bigger picture remains bullish until HTF structure breaks.

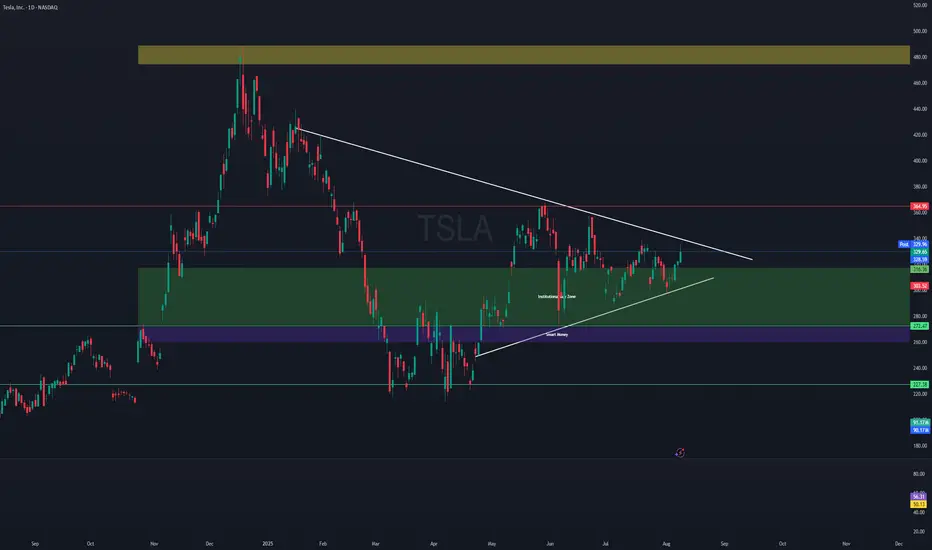
TSLA is looking ready for breakout NASDAQ:TSLA is making higher lows, looks like getting ready to be a rocket. keep an eye on 340 break and retest.
SOMETHING BIG IS COMING! ALTCOINSThe total3 index, an important metric for altcoins, broke out of the handle cup formation that began at the 2021 all-time high level. After the retest phase in the coming period, it will transition to a sharp rise phase.
ETHUSDTBearish RSI divergence at $4,280 suggests weakening momentum. Possible correction toward $3,981 → $3,786 → $3,373. Liquidity around $3,000 could attract price before the next leg. I expect a pullback before any strong bullish continuation.
BINANCE:ETHUSDT.P

Trump Coin Wave Analysis – 8 August 2025
- Trump Coin reversed from the support area
- Likely to rise to resistance level 10.75
Trump Coin recently reversed from the support area between the support level 8.440 (lower border of the sideways price range inside which the price has been moving from June) and the lower daily Bollinger Band.
The upward reversal from this support area stopped the previous short-term ABC correction ii from last month.
Given the strongly bullish sentiment seen across the cryptocurrency markets, Trump Coin can be expected to rise to the next resistance level 10.75 (upper border of the active sideways price range).

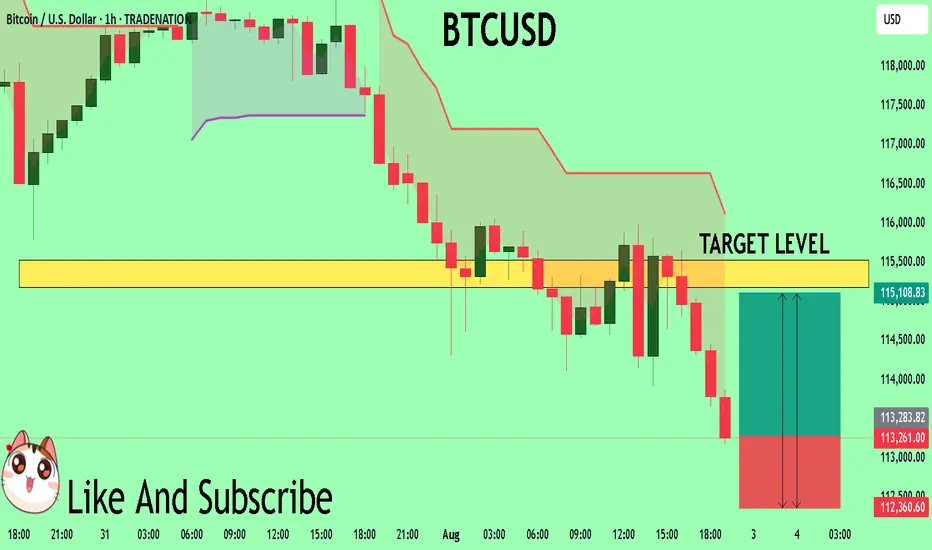
BTCUSD Will Explode! BUY!
My dear followers,
I analysed this chart on BTCUSD and concluded the following:
The market is trading on 11326 pivot level.
Bias - Bullish
Technical Indicators: Both Super Trend & Pivot HL indicate a highly probable Bullish continuation.
Target - 11517
Safe Stop Loss - 11236
About Used Indicators:
A super-trend indicator is plotted on either above or below the closing price to signal a buy or sell. The indicator changes color, based on whether or not you should be buying. If the super-trend indicator moves below the closing price, the indicator turns green, and it signals an entry point or points to buy.
Disclosure: I am part of Trade Nation's Influencer program and receive a monthly fee for using their TradingView charts in my analysis.
———————————
WISH YOU ALL LUCK
EurusdI posted this signal few days ago if I am not mistaken am expecting price to come down break and retest the zone then I can sell more
