BTCUSD SHOW WEEKNESS & BEARS ARE GETTING READY TO TAKE OVER As explain on the chart, im looking to see if we BREAK SUPPORT mention on the chart
Once we take that SUPPORT i will go for SELL
Will update as soon i go in
Good weekend everyone :)
Community ideas

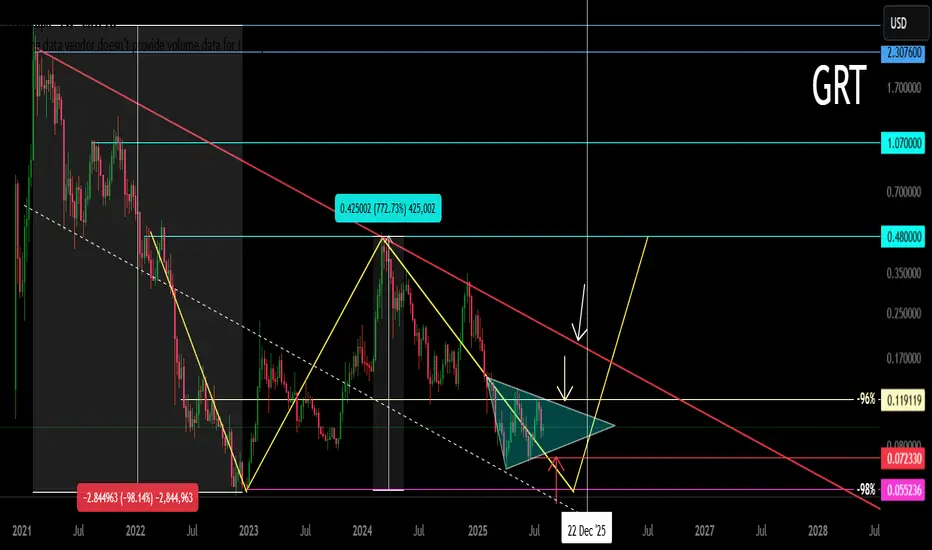
GRT Main Trend (addition) Double Bottom + Triangle 08 2025Logarithm. Time frame 1 week.
Main trend . Supplement for clarity to the previous idea for this cryptocurrency, published 23 02 2025 Everything is essentially the same, the new idea is made to visualize the trend, nothing more.
GRT Main trend.
Line chart, price now
Secondary . Big double bottom (in any case, with local scenario A or B, it will be realized in the medium term).
Local trend (price movements in the trend minimum zones before a big pump). Triangle above the Gann fan ray (see the previous idea, where this tool of the logic of movement in the trend is shown).
The second wave of the triangle is formed.
A downward breakout is a descending pennant, which is the removal of longs under the pattern of a larger scale of historical minimums.
A upward breakout is the realization of the triangle targets, and the price movement to the descending line of the main trend +80-100%
HeclaOld news for many, but Hecla has one of the longest consolidations under this overhead of any ticker ever. Maybe the longest, because I haven't seen a longer consolidation.
One of my teachers said that you can expect the height of the breakout to be roughly equivalent to the length of the consolidation, which puts HL past my targets, but I prefer my targets.
Volume is really ramping up, and I'll make some popcorn. It's not the most exciting ticker I know in amplitude terms, but it should run bullish for a long time, and that alone allows different trading strategies, such as going into long term cap gains ,which are only taxed at 20% in the states.
Best of luck to you in 2025, and I hope everyone make a killing.

Ripple (XRP): 1:3 RR Position Opportunity Here | Breakout ComingXRP is still rising, attempting to break the local high and possibly reach a new all-time high (ATH). We found two trading opportunities here, so now all we have to do is wait!
More in-depth info is in the video—enjoy!
Swallow Academy

AUD/CAD–From Downtrend to Breakout Watch/Sideways ConsolidationAfter an extended downtrend, AUD/CAD transitioned into a sideways consolidation pattern, holding between clearly defined support and resistance levels.
Support zone: ~0.8800 – 0.8850
Resistance zone: ~0.9000 – 0.9050
Potential breakout target: 0.9200
Price is testing the upper boundary of the range, with higher lows forming, indicating a shift in market structure. Volume profile shows strong interest near the mid-range, and a sustained close above resistance could open the path toward the next major level.
Key points on the chart:
Downtrend channel breakout
Sideways accumulation phase
Higher lows supporting potential bullish momentum
This setup is for chart analysis and educational purposes only – not financial advice. Always manage risk according to your trading plan

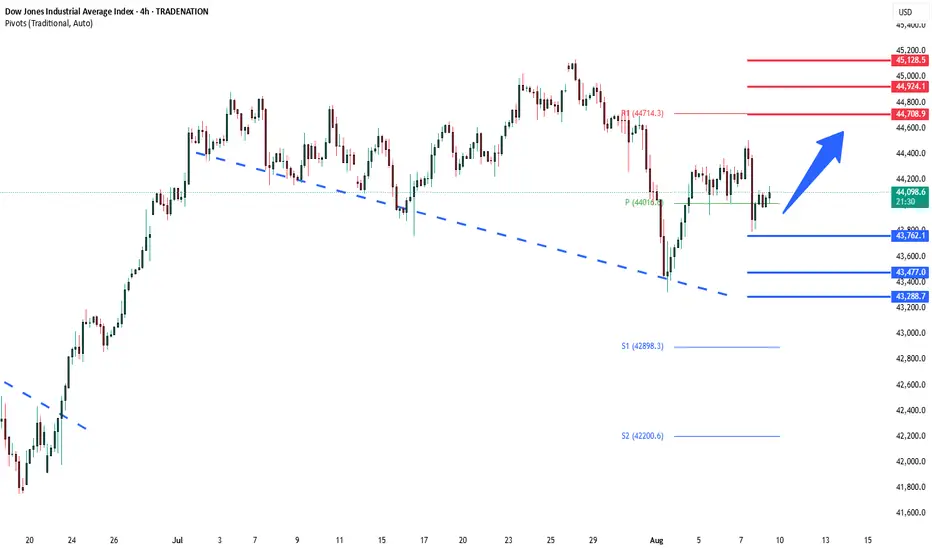
DowJones key trading levelsKey Support and Resistance Levels
Resistance Level 1: 44700
Resistance Level 2: 44924
Resistance Level 3: 45130
Support Level 1: 43760
Support Level 2: 43477
Support Level 3: 43288
This communication is for informational purposes only and should not be viewed as any form of recommendation as to a particular course of action or as investment advice. It is not intended as an offer or solicitation for the purchase or sale of any financial instrument or as an official confirmation of any transaction. Opinions, estimates and assumptions expressed herein are made as of the date of this communication and are subject to change without notice. This communication has been prepared based upon information, including market prices, data and other information, believed to be reliable; however, Trade Nation does not warrant its completeness or accuracy. All market prices and market data contained in or attached to this communication are indicative and subject to change without notice.
CKB Main trend. Horizontal pump channel. AI. 08 2025Logarithm. Time frame 1 week (less is not needed). Work in a horizontal channel from support/resistance zones. Pay attention to what a huge % (more than +1400%) pumped up this asset in 2024, when all the alts were and are at their minimum zones.
Local trend of the decline phase, after the pump +1400% as before. The local reversal zone, on which the medium-term trend direction (the entire market) will depend, is a coin as a projection.

Smallcap paradox 200WEMA and 40WEMA200WEMA - Two touches in a bear market after a simmering bullmarket once 40WEMA is breached. Buying point for Lumpsum bros.
40WEMA - Ride it to buy dips during a bull market. Dip buying point for BTD monkeys.

Btc wants to 124k!Setup is here. Btc.d will be move the price to 124k usdt.
This is not financial advice, DYOR

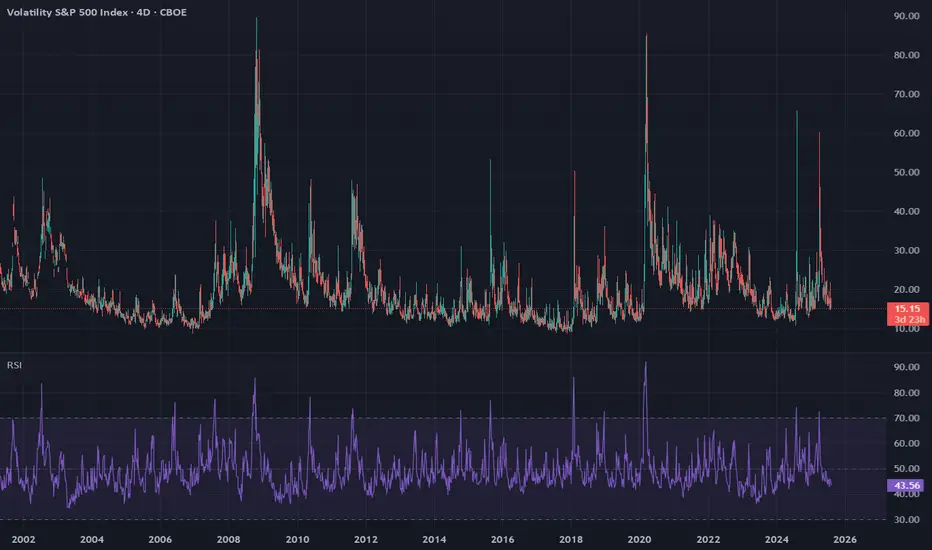
Have we entered a brand new normal or is a crash coming?The market's bullish narrative rests first and foremost on the control of volatility. I won't go too much deeper into that right now, but I have been discussing with AI the current period of volatility expression and would like to highlight the following points about the current period:
4d VIX RSI has not had a 5 point increase since April 1 of this year. That's 129 days and counting.
From Claude AI (Anthropic):
The ongoing 4 day VIX RSI fall period (started April 1, 2025, now at 128+ days) is completely unprecedented since September 2003 (when VIX formula was modernized).
That's already:
More than double the longest ever previous period of in October 28, 2020 to Jan 27, 2021 (63 days)
Nearly 10x longer than the average period (13.14 days)
Over 12 standard deviations beyond the mean
The only period ever to exceed 70 days since September 2003
Key Insight:
Since September 2003, 67.3% of all fall periods recovered within 2 weeks, and 84.2% recovered within 3 weeks. The current 128+ day period represents an extreme statistical outlier in modern VIX behavior.
Additionally, if we look at the S and P week chart, we see that the gap from May 9 to May 12 is the largest ever unfilled weekly gap in the entire history of the S and P.
We are currently in a whole new normal of "bullishness", akin to the time period just before the great crash and great depression (which was the most bullish the stock market has ever been).
AUDUSD Breakout Setup: Ready for Lift-Off!Hey Guys,
I’ve analyzed the AUDUSD pair for you. If the 0.65245 level breaks to the upside, my target will be 0.65416.
If it doesn’t break, I’ll be looking to buy around 0.65047 or 0.64954.
Either way, my final target remains 0.65416.
In this analysis, I’ve highlighted two key levels and shared my target. I’m planning to buy from these zones.
Every single like from you is my biggest source of motivation to keep sharing these analyses. Huge thanks to everyone who supports by liking!

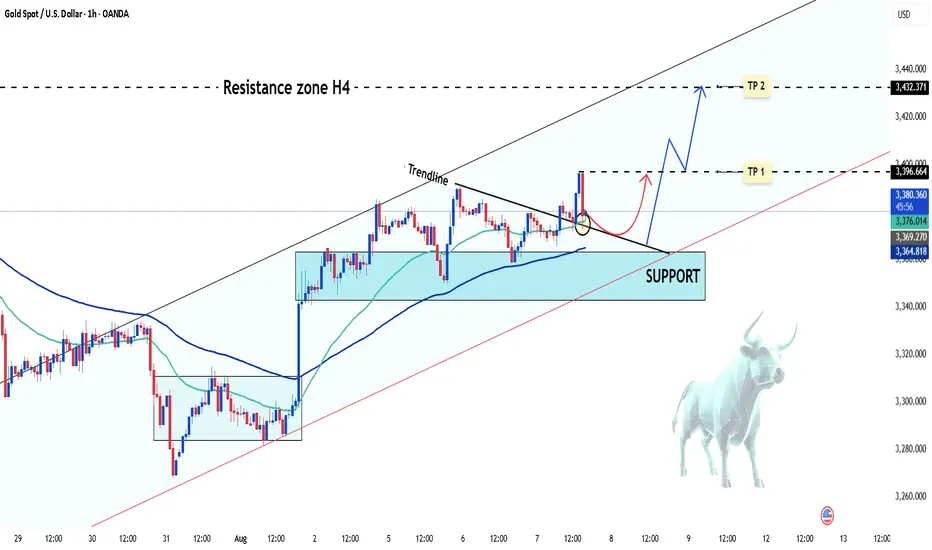
XAU/USD Short-Term Buy Opportunity ? XAU/USD has recently formed a bullish pattern, currently trading around 3,380 USD and showing an increase of more than 10 USD for the day.
From a technical analysis perspective, the price is following an upward trendline and showing signs of momentum accumulation. The area around 3,350 USD provides strong support, which could establish a solid base for further upward movement.
Key Levels:
Resistance (Target 1): 3,396 USD
Resistance (Target 2): 3,432 USD
To consider a short-term buy, it’s important to monitor price action around the support levels and wait for confirmation t
Good luck!
EUR/CAD – 93% Traders Are SHORT! Bearish Reversal Brewing?The EUR/CAD pair is currently in a bullish trend, but multiple technical and sentiment signals are pointing toward a possible trend reversal.
🔍 Key Observations:
Trend: Bullish (but losing momentum)
Bearish Divergence: Price making higher highs while RSI indicators show lower highs.
Pattern: Rising Wedge – a classic bearish reversal formation.
Harmonic Analysis: AB=CD pattern is approaching the potential reversal zone (PRZ).
EMA Insight: Price candles have moved across the 20 EMA and 50 EMA, signaling weakening bullish momentum.
Sentiment (Myfxbook.com): 93% of traders are currently short on EUR/CAD — strong crowd bias toward the downside.
📌 Trade Setup:
Bias: Bearish
Strategy: Sell Stop at breakout of previous Higher Low (HL)
Entry Price (EP): Sell Stop @ 1.59755
Stop Loss (SL): 1.60626
Take Profit 1 (TP1): 1.58884 (R:R = 1:1)
Take Profit 2 (TP2): 1.58013 (R:R = 1:2)
Lot Size: 0.15
Risk: $200 | Potential Reward: $200–$300
💡 Trade Execution Plan:
We will enter only after HL breakout confirmation to avoid false moves. This setup aligns Rising Wedge pattern, Bearish Divergence, EMA cross weakness, Harmonic PRZ zone, and bearish sentiment — a powerful confluence for a potential downside move.
📊 Technical Summary:
Combining price action, chart patterns, harmonics, momentum, and trader sentiment gives this short setup high probability.
📢 Your Turn:
What’s your take on this trade? Will the market follow the 93% bearish sentiment, or could this be a trap?
💬 Drop your analysis in the comments, let’s discuss!
👍 Like, 🔁 Share, and Follow for more trade setups & technical breakdowns.
#EURCAD #Forex #ForexTrading #BearishReversal #PriceAction #HarmonicPatterns #TechnicalAnalysis #EMA #Divergence #TradingView #ChartPatterns #SwingTrading #ForexSetups #ABCDPattern #PriceActionTrading #ForexSignals #RisingWedge #1HRTimeFrame #ForexLife #DayTrading #MarketSentiment #Myfxbook

*Ethereum Cup and Handle Breakout with Bullish TargetsThis chart displays a classic *"Cup and Handle"* formation in Ethereum (ETH/USD) on the 30-minute timeframe. After forming a rounded bottom (cup) and consolidating (handle), price breaks out into an ascending channel, indicating bullish momentum.
Two clear bullish targets are projected:
- *1st Target:* 4,034.97
- *2nd Target:*4,164.52
Support and resistance levels are marked, and the structure suggests potential continuation toward higher highs if volume and momentum sustain. Ideal for short-term swing traders watching breakout patterns.
Pattern Observed:*
*Cup and Handle Formation*
- A bullish reversal pattern that signals a continuation of upward movement.
- The *cup* shows a rounded bottom, indicating market recovery from a downtrend.
- The *handle* (short consolidation) confirms buying pressure after the breakout.
---
*Price Action & Trend:*
- After breaking above the resistance (~3,580), price entered a *rising channel*, showing consistent higher highs and higher lows.
- The breakout is strong, confirming bullish momentum.
- Minor retracement or sideways movement expected before hitting target zones.
—
*Key Levels:*
- *Current Price:*3,910
- *Breakout Point:* ~3,580 (acted as neckline/resistance)
- *1st Target:*4,034.97 (short-term resistance)
- *2nd Target:* $4,164.52 (next major resistance level)
---
*Indicators & Signals:*
- *Trend:* Strong uptrend within channel
- *Volume (not visible but assumed):* Likely increased on breakout, which strengthens pattern confirmation
- *No signs of major reversal yet*, but RSI or volume checks would confirm if it's overbought or sustable

GBPUSD – Bullish Breaker Setup into CPI & PPI WeekWe’ve just seen a bullish break with strong momentum from the 1.3340s, reclaiming and holding above a 4H Bullish Breaker (1.3341 – 1.3386). Price action suggests a shift in order flow to the upside, with buy-side liquidity objectives in sight.
Key Context:
The Bullish Breaker aligns with prior resistance turned support.
Strong displacement after the break, indicating algorithmic buying.
Price is consolidating just above breaker high, holding structure.
Upcoming US CPI (Tuesday) and PPI (Friday) could inject volatility, potentially fueling continuation.
Entry might form as soon as early as Monday London or latest NY kill zone.
Targets:
Buy Side Target 1: 1.3587 – first liquidity pool above recent highs.
Major Buy Side: 1.3788 – larger weekly liquidity draw.

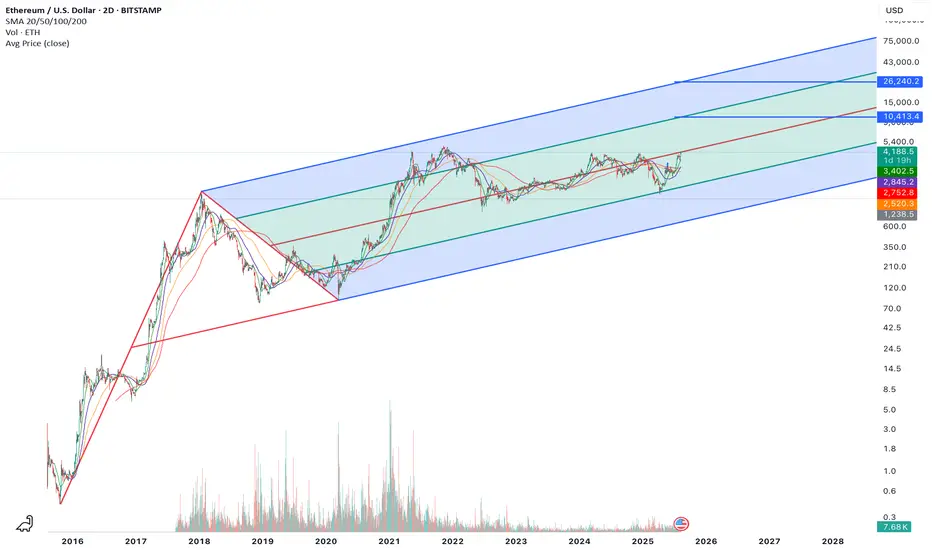
Ethereum’s $26K Path: Pitchfork Precision Meets 401(k)🚀 Ethereum’s $26K Path: Pitchfork Precision Meets 401(k) Mega Capital Inflows
Ethereum’s long-term pitchfork structure — stretching back nearly a decade — has been an uncannily accurate roadmap for the asset’s entire price history. Every major bull run and retracement has respected these channel boundaries with surgical precision. And now, the math points to a euphoric cycle peak near $26,240.
But here’s what’s different this time: a perfect storm of structural, macro, and legislative catalysts could fuel the most explosive Ethereum rally in history.
1️⃣ The Technical Blueprint: ETH’s Pitchfork to the Moon
The chart above speaks for itself:
Multi-cycle median line respect → Every parabolic move in ETH has peaked near the upper bound of this pitchfork.
2025 setup mirrors 2017 & 2021 → Both prior cycle expansions occurred from near the lower channel up to the upper band within 12–18 months.
Current positioning → ETH is breaking away from the midline, with momentum building toward the $10.4K resistance area before a final euphoric move to the $26K upper band.
2️⃣ The Game-Changer: Trump’s 401(k) Executive Order
On August 7, 2025, President Trump signed an executive order allowing 401(k) retirement plans to invest directly in private equity — and by extension, in private tokenized assets and alternative vehicles that can include crypto exposure.
Why this matters for Ethereum:
$7.3 trillion 401(k) market in the U.S. alone.
Even a 1% allocation into ETH through tokenized or pooled products equals $73 billion in demand — over 25% of ETH’s current market cap.
Coupled with upcoming Ethereum-based private market tokenization rails, this could create persistent retirement-driven demand that never existed before.
3️⃣ Ethereum’s Unstoppable Macro Tailwinds
Beyond the 401(k) shockwave, ETH’s macro positioning has never been stronger:
BlackRock’s Ethereum staking ETF pending SEC approval — opening the floodgates for institutional inflows.
Ultra-sound money supply mechanics — ETH’s burn rate has outpaced issuance in multiple months, meaning supply is shrinking while demand is about to accelerate.
Tokenization megatrend — Real estate, private credit, and commodities are increasingly issued on Ethereum rails, boosting transaction demand and fee burns.
Layer 2 explosion — Rollup adoption is pushing more economic activity onto Ethereum, while fees and settlements still flow to ETH validators.
4️⃣ The Cycle Anatomy: How $26K Happens
If history rhymes, here’s how the final leg could unfold:
Breakout to $6K–$7K as ETF approval and 401(k)-related flows kick in.
Acceleration to $10.4K — the mid-pitchfork resistance — as retail and media hype return.
Parabolic blow-off into the $20K–$26K zone as institutional + retirement inflows collide with ultra-low liquid supply.
5️⃣ Why This Time Could Overshoot
Unlike past cycles, Ethereum now sits at the intersection of:
Institutional-grade adoption (BlackRock, Fidelity, JPMorgan)
On-chain structural scarcity (post-merge burn dynamics)
Legislative green lights (401(k) access to alternatives)
Global macro rotation into risk assets as interest rates pivot
If prior cycles were crypto’s “dot com era,” this one is the mobile internet + cloud migration phase — except ETH is the protocol on which everything runs.
Bottom line:
The $26K target isn’t just a chartist’s fantasy — it’s a mathematically reinforced roadmap now backed by the largest pool of retirement capital in the world.
Ethereum is no longer just “digital oil.” With this convergence of technical, macro, and legislative forces, it’s becoming the primary settlement layer for global finance — and this cycle could be the moment the market finally prices that in.
EURJPY Buyers In Panic! SELL!
My dear subscribers,
EURJPY looks like it will make a good move, and here are the details:
The market is trading on 172.25 pivot level.
Bias - Bearish
Technical Indicators: Both Super Trend & Pivot HL indicate a highly probable Bearish continuation.
Target - 171.49
About Used Indicators:
The average true range (ATR) plays an important role in 'Supertrend' as the indicator uses ATR to calculate its value. The ATR indicator signals the degree of price volatility.
Disclosure: I am part of Trade Nation's Influencer program and receive a monthly fee for using their TradingView charts in my analysis.
———————————
WISH YOU ALL LUCK

GBPCAD: Could we see price continue to the downside?Price on GBPCAD looks quite interesting at the moment, this latest moves continues the narrative of a downtrend.
As it is following a downtrend, each touch has served as a catalyst for a directional move. The most recent interaction is particularly interesting, because it's hovering here for some time now, and this could be a clue that we can use.
What may follow is subtle but telling: compression at trendline, low-volume candles suggesting exhaustion, all aligning for more potential release downward.
My target would be toward 1.8100 where we have a clear support zone. Momentum has respected structure and if this move plays out, I don't think it will be a breakout, but a continuation of a narrative that’s already been happening. This is what makes the setup so compelling. It’s not new, it’s the a "story being told".
Though a scenario for more upside is possible and can happen just as much. Still, I would take the side for more downside taken into account all above.

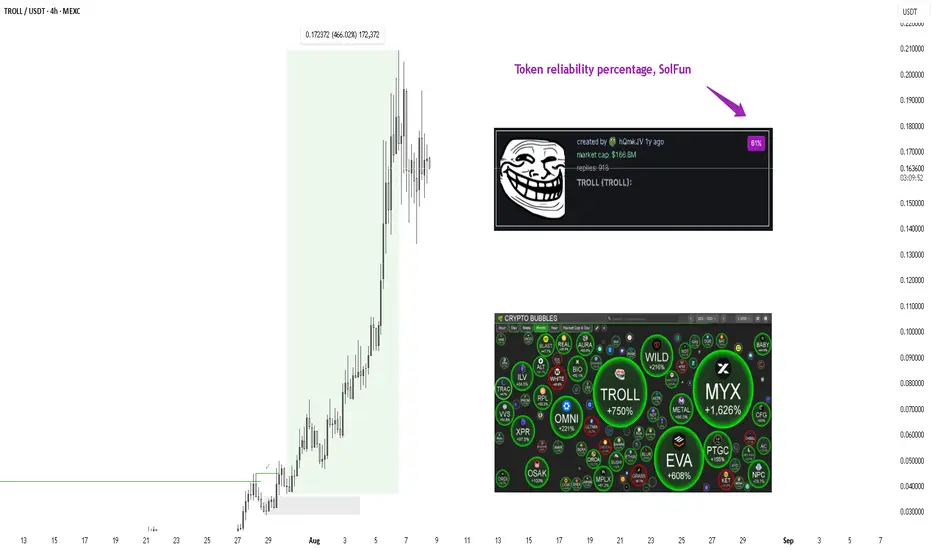
Solfun. Troll's growth: fundamentals versus technical analysis500% in one day — and not a single clue on the chart
The Troll token gained more than 500% in one day. Such movements are not uncommon for the Solana memetoken market, but this case is indicative. If someone had tried to predict the growth using technical analysis, they would have been left with nothing:
there were no patterns on the chart;
there was no break in the structure;
the indicators were silent
The reason is simple — most new tokens on Solana don't even have a trading history to build technical analysis on. In addition, the average meme token rarely lasts more than a week, and a significant portion of projects turn out to be scams.
In the case of Troll, the impetus was not the chart at all, but a Twitter post from the Pump.fun account mentioning the token. It was this factor that triggered a wave of purchases, which led to a 750% increase at its peak.
When the chart is silent, fundamentals speak
In the world of memecoins, fundamental analysis is a quick snapshot of key metrics that can be checked in the first minutes of a token's existence:
supply distribution;
the share of bots among holders;
activity on social networks;
the presence of suspicious large addresses.
If you answer each of these metrics for yourself, you can already form a basic understanding: is the token worth paying attention to, or is it better to pass it by?
You can either collect all the necessary data yourself or switch to automation by using a cumulative integral indicator that combines all of this into a single number — the token's reliability percentage.
This percentage is a key metric that many traders rely on when making decisions. It is formed from a whole set of factors:
uniformity of token distribution;
degree of decentralization;
real audience activity;
abnormal transactions;
dynamics of interest on social networks.
This is the percentage that many traders look at first: if it is below 20% , the project is immediately rejected.
Automation instead of manual analysis
Collecting such data manually takes too long. By the time a trader checks the distribution of supply, holders, and activity on social media, the desired deal may already be gone. Therefore, the market has gradually shifted to automation.
There are now many browser extensions that analyze tokens and indicate the final reliability percentage instead of the trader.
In my case, SolFun is just one such tool, a standard within the Solana ecosystem. The extension is built directly into the Pump.fun interface, works in real time, and aggregates key metrics into one convenient indicator.
In the case of Troll, SolFun showed 61% reliability — a high level for a new token amid a flood of daily scam projects.
Conclusion
The story with Troll is just an illustration of a general pattern in the Solana memetoken market: technical analysis is often useless. What matters here is the speed of obtaining information and the ability to quickly filter the flow of projects. Either manual work or connecting automation in the form of SolFun and other extensions.
The speed of analysis is especially important in an environment where every extra hour can cost you a missed deal.
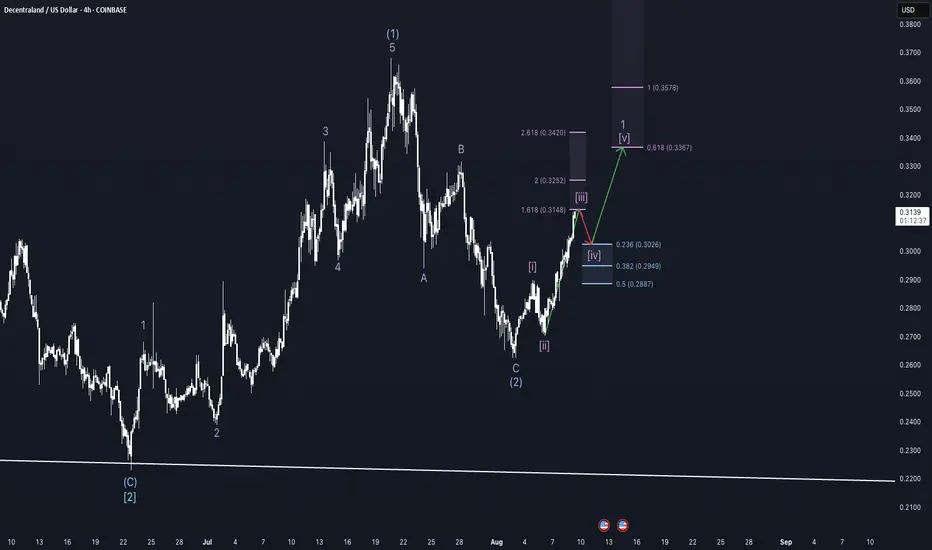
Third-Tier action - MANA weekly update August 9 - 15thDecentraland (MANA) is currently advancing within a strongly aligned Elliott Wave structure. At the Cycle degree, the market is in Wave 1; at the Primary degree, it is in Wave 3; at the Intermediate degree, also in Wave 3; and at the Minor degree, in Wave 1. At the Minute degree, price is in the late stages of Wave 3. This smaller Wave 3 is approaching a bearish Fair Value Gap (FVG), which could act as resistance and mark the short-term top of this wave. Interestingly, the projected target for Wave 5 also aligns with a higher-level bearish FVG, adding structural confluence to the broader setup.
While the overarching wave alignment remains bullish, there are a few elements to monitor closely. Funding rates are positive but leaning slightly toward the negative, suggesting a mild sentiment shift, while open interest continues to rise, indicating stronger market participation. However, the liquidity heatmap reveals a significant concentration of liquidity below the current price, which weighs against the immediate bullish continuation, as such liquidity often attracts short-term sweeps before the trend resumes.
Market psychology could also play a major role in the next move. With Ethereum currently rallying strongly, there is a plausible rotation scenario: once ETH reaches a key resistance level and slows down, capital may rotate into second- and third-tier altcoins like MANA, accelerating their upside moves. Such rotations often coincide with euphoric retail behaviour, which can amplify both gains and volatility.
From a macroeconomic perspective, this setup is further supported by expectations surrounding the upcoming September FOMC meeting. The CME FedWatch Tool currently shows a 88.9% probability of a Federal Reserve rate cut. Markets tend to front-run such events, and this expectation could fuel bullish momentum into Wave 3 moves across the crypto sector. However, with sentiment leaning heavily bullish, there is also the risk of a “sell-the-news” reaction, especially if leveraged longs pile in too aggressively ahead of the announcement.
Institutional positioning appears to have taken place earlier in the cycle, as evidenced by order block formations near the end of prior corrective waves, leaving retail traders to drive the next leg higher. This dynamic often defines the acceleration phase of a third wave.
As long as key support levels hold and the structure remains intact, MANA’s multi-timeframe alignment suggests that the next impulsive rally could be substantial — though traders should remain mindful of the liquidity resting below, which could trigger a temporary shakeout before continuation.
Bitcoin above $116k ┆ HolderStatOKX:BTCUSDT reclaimed the 115k pivot after breaking a local channel that formed within a larger wedge. The surge from triangle consolidation, followed by a controlled pullback and higher‑low, suggests accumulation rather than distribution. As long as 113–115k holds, targets line up at 118.5k, 121k and the extension toward 124–126k along the rising trend fan. Only a decisive close below 112k would invalidate the immediate bullish bias and reopen 109–110k. For now, constructive momentum and structure favor continuation.

BTC/USDT: Key Levels to Watch Now!Bitcoin remains in a macro bullish structure, but recent price action shows consolidation after breaking through major resistance levels earlier this month. Similar to previous cycles, BTC tends to form short-term ranges after strong rallies before deciding the next move.
Currently, BTC is trading near $116,500–$117,000, just above a key support zone from $115,200 to $114,500. This area aligns with previous breakout levels and the 20 EMA on the 4H chart, making it critical for the short-term trend.
*Bullish Scenario: Holding above $115,200 and breaking $118,600 with strong buying volume could push BTC toward $120,500–$122,000 within days.
*Bearish Scenario: A close below $114,500 could trigger a correction toward $112,800–$111,900. Losing this level may extend the retracement to $110,200 (major demand zone).
Summary:
BTC is consolidating near key support. Past scenarios suggest a breakout above $118,600 could fuel the next bullish leg, but losing $114,500 risks a deeper pullback toward $112,800. The next 2–4 days should define short-term direction.

