Community ideas
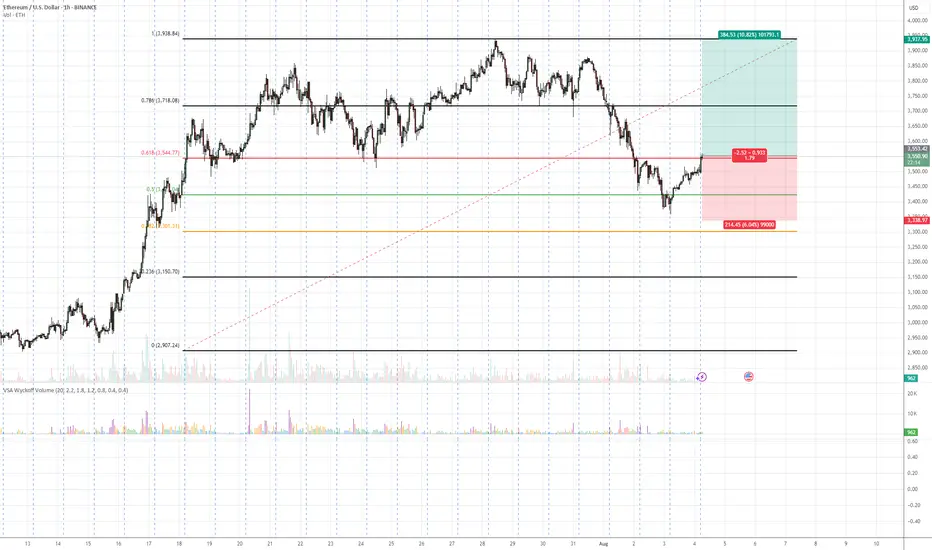
ETH/USDT – Bullish Reversal Potential from Fibonacci Confluence 💡 Idea:
Ethereum is showing signs of demand absorption at a critical Fibonacci support cluster (0.5 – 0.618 retracement). VSA patterns confirm that selling pressure is being absorbed, hinting at a possible markup toward previous swing highs.
📍 Trade Setup:
Entry: Current levels near 3,551
Target: 3,937 (+10.82%)
Stop Loss: 3,338 (below last absorption zone)
R:R Ratio: ~1.79:1
📊 Technical Reasoning (VSA)
1. Stopping Volume at Fibonacci Support
ETH tested the 0.5–0.618 retracement zone from its prior bullish impulse.
Wide spread down-bars on high volume failed to produce significant downside progress, signaling professional buying.
2. No Supply Confirmation
Following the stopping volume, the market printed narrow range candles on decreasing volume, indicating supply exhaustion.
3. Demand Emergence
The recent push above short-term resistance came with increasing volume and wider up-bar spreads, suggesting the start of an accumulation-to-markup transition.
4. Structure & Fibonacci Confluence
Current rally aligns with the Fibonacci golden zone and past structural support.
📌 Trading Plan:
Enter on confirmed breakout above minor resistance with volume expansion.
Scale out partial profits near 3,800 and let remainder ride toward 3,937.
Keep stop below 3,338 to avoid being shaken out by false breakouts.
[$HIMS] Beautiful wellness trade - Plan changed overnightNYSE:HIMS
The plan was too SHORT (BEAR CALL SPREADs) NYSE:HIMS @66.0 USD.
Outside regular trading hours it dumped and spiked back from 55.0 USD up to 62.0 USD.
-> technical pattern 3 White Soldiers
Short Story Long: I went long at 55.0 USD (Cash Secured Puts) seeing a strong support at this key level.
>no good trade
>we will see
Absolutely, not to be recommended to copy!
No financial advice.

Bitcoin Rounding Top & April's Uptrend Line BreachAs an update to one of my prior ideas. The prior idea had mentioned that what may have appeared to be a bullish pattern on a lower time frame may have been misleading. I had pointed out why on higher time frames. Here is an update:
A Rounding top appears to have formed along with a breach of the April low's uptrend. The breach found support on the 50dma, then snapped back and retested the breached uptrend line. A downward continuation would be the most probable direction for price to trend within this scenario, in my humble opinion.
Very DangerousCarvana back near all time highs while in an expanding triangle formation. These happen at times where volatility is increasing and swings have become more wild. It can be a sign a lower liquidity causing small dollar amounts to change the stock's price more drastically.
A daily close under $330 is a giant sell signal for me. Advising extreme caution for those long this stock. I believe there are plenty of better investments out there with far less risk.

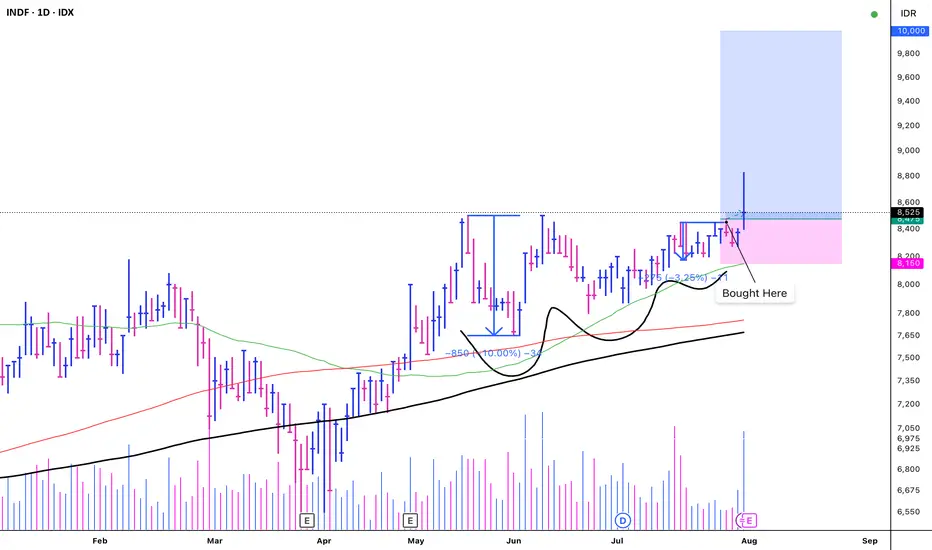
INDF - VCP (13W 10/3 3T)IDX:INDF - VCP
+)
1. Low risk entry point on a pivot level.
2. Volume dries up.
3. Price has been above the MA 50 > 150 > 200
4. Price is within 25% of its 52-week high.
5. Price is over 25% of its 52-week low.
6. The 200-day MA has been trending upwards for over a month.
7. The RS Rating is above 70 (71).
EPS Growth:
a. Quarterly QoQ: -
b. Quarterly YoY: +11.20%.
c. TTM YoY: +32.14%.
d. Annual YoY: +6.07%.
(-)
1. There is no significant breakout with substantial volume.
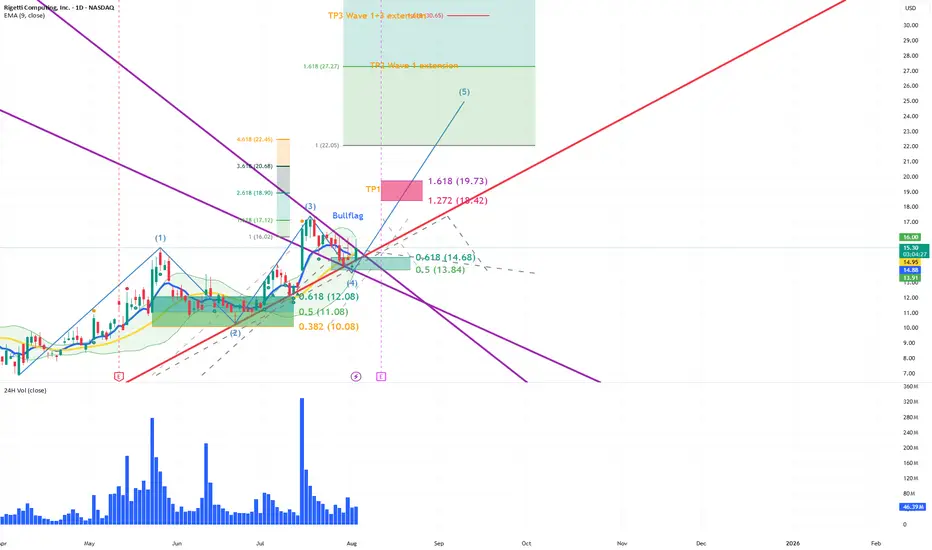
Wave 5 Break-OutLooks like Rigetti completed the wave 4 correction to the 0,5 fib zone (green box).
Today it broke out of the purple bullflag and reentered the red support.
Saw a retest of the bullflag support earlier today.
If we start wave 5 we might see:
TP1: 18,42 tp 19,73
TP2 27,27 TP1 extension
TP3: 30,65 Wave1+3 extension
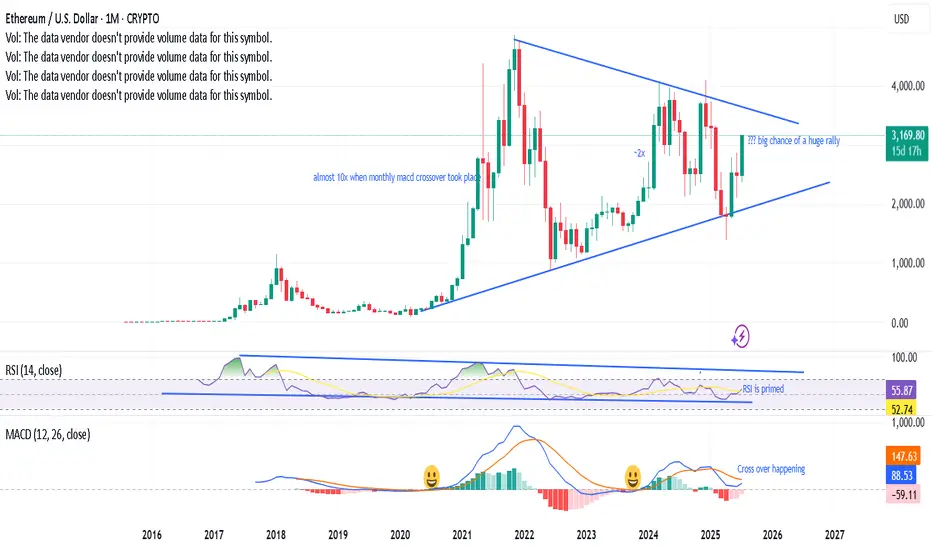
Monthly MACD crossover taking place, a prabolic rise?Last 2 times, when the monthly MACD cross over has happened, ETH has gone bonkers. A third one is on the verge of happening, RSI has enough room with a symmetrical triangle with bullish momentum - looks like a big rally is in the near horizon. Fingers cross.
WTI: Oil Markets on Edge Despite Trump Considering Major TariffsOil prices could drop if Trump backs down on tariffs on countries buying Russian oil, but short-term bullish catalysts, like geopolitical tensions and bullish speculative bets, may still push prices up before longer-term headwinds take hold.
----------------------------------------------------------------------------------------------------------------------
Trump’s threats of steep tariffs on countries buying Russian oil have sent oil prices surging, as traders fear a global supply crunch if Russian barrels are cut off.
But here’s the twist: Trump has a history of backing down or delaying tariffs after using them as leverage. When he does, oil prices usually fall, as the immediate risk of supply disruption fades.
If he caves in again by the deadline, which is 10 to 12 days from 4 August, or extends it, oil prices could drop. The bigger picture also appears bearish: OPEC+ is ramping up supply, global demand is slowing and expected to drop in H2, and inventories are rising (first glimpse by EIA, Wed).
But with the deadline falling around 14–16 August, 2025, short-term bullish catalysts could spark a rally up to the 38.2%-61.8 % Fibonacci retracement levels, positioning WTI better for declines (conditional on Trump!).
This content is not directed to residents of the EU or UK. Any opinions, news, research, analyses, prices or other information contained on this website is provided as general market commentary and does not constitute investment advice. ThinkMarkets will not accept liability for any loss or damage including, without limitation, to any loss of profit which may arise directly or indirectly from use of or reliance on such information.

EURGBP Roadmap EURGBP looking for entry signal at july highs for a leg down. small chance over shooting july highs before turning down.

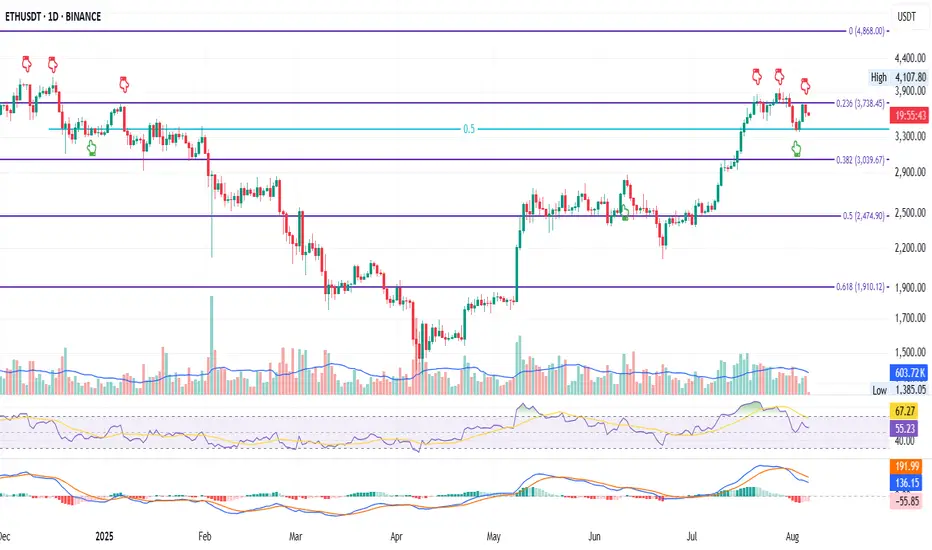
ETH Daily: Lower High, Lower Low. That Was My Signal
This is ETH on the Daily
Price action today looks very similar to December 2024.
Back then, ETH attempted twice to flip the 0.236 Fib level at $3378.45 — first on Dec 6, then on Dec 12. Both failed. Price found support at the 0.5 (midpoint between the 0.236 and 0.382), bounced, got rejected again at the 0.236, then went lower.
Now, we’re seeing a near-identical pattern:
– First attempt to reclaim the 0.236 Fib on July 21
– Second attempt on July 27
– Both failed
– Price found support again at the 0.5 middle level
– Bounced back to the 0.236
– Got rejected again
What will happen this time?
For me, the answer already came: we’ve now seen a lower low followed by a lower high — a temporary break of bullish structure. That’s my cue to scale out of my long and reduce exposure so I’m not caught off guard overnight.
Now that I’ve done that, I can observe the chart objectively without emotional bias or panic-selling.
Technically, ETH is in a short-term downtrend.
Fundamentally, however, I believe we’re in the early stages of a larger uptrend, driven by strong bullish news around crypto (happy to list them if you're curious).
But until those bullish narratives start kicking in and price moves up again, I have to be extremely careful not to get wiped out — so I’ll stay closely aligned with price action.
Like I said: short-term downtrend, long-term opportunity.
Always take profits and manage risk.
Interaction is welcome.
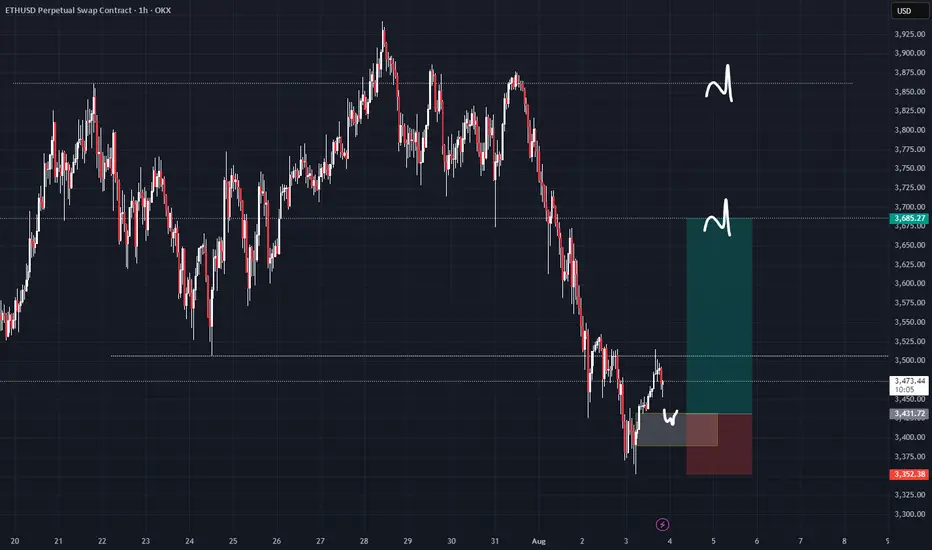
Potential deviation entery on ETHI partycaulary gonna be waiting for a decent reaction in yellow zone or price returning higher 3520 wich would confirm that deviation
But as u probably know trading deviation mostly requiers entering during it so my main goal for next pre london hours will be to try to find entery with decent rr ratio
But also if i dont see any decent reaction in yellow or a failure to hold higher 3520 i would consider skiping the trade or even look for continuation short
Rebuy position* We set **entry above the current price**, at **147.150**, to avoid false breakouts and confirm bullish momentum continuation.

$SOLZ – Ichimoku Cloud Long SetupThis chart shows a potential long opportunity forming on NASDAQ:SOLZ using Ichimoku principles.
The price has pulled back into the Ichimoku Cloud (Kumo), which often acts as dynamic support during an uptrend. The cloud is still bullish, with Senkou Span A above Span B, indicating the longer-term trend remains intact.
The Kijun-sen (Base Line) at around $18.50 is the next resistance. A daily close above that level would confirm a potential trend continuation. The Tenkan-sen (Conversion Line) is currently sloping downward but would turn up if price moves higher.
The Chikou Span (Lagging Line) is still above price candles, showing that overall momentum remains bullish.
MACD histogram is red but beginning to flatten, signaling bearish momentum may be slowing.
Trade setup:
Entry: $17.75 (current price in the cloud)
Stop: $16.50 (below Kumo base and S1 support)
Target: $22.67 (R1 and prior resistance)
Risk/Reward: 3.78
Setup remains valid as long as the price holds above the cloud. A breakdown below $16.50 would invalidate the trade. A close above the cloud and Kijun would trigger full bullish confirmation.
This is a textbook cloud bounce opportunity with strong trend-following potential.
08/08/25 Gold Swing Levels08/08/25 levels are marked; expecting an up trend
Always, price action determines trade.
Trade parameters
Entry on 5 min chart
Sl: 30-50pips
TP: 2-4x SL

Last trade Explanation $SUITrade Setup: Liquidity Sweep / Manipulation Entry
Pair: SUI/USDT
Timeframe: 15-Minutes
Platform: Binance
Chart Type: Candlestick
Trade Concept
This trade is based on a liquidity sweep/manipulation trap, where the price fakes a breakdown below a key support to trap sellers before reversing.
Entry Rules
Identify Liquidity Zone:
Mark key support levels where multiple lows have formed (acting as liquidity pool).
Wait for a clear sweep below this level (price makes a lower low, triggering stop losses/sell orders).
Wait for Confirmation:
Do not enter on the sweep candle.
Wait for the next candle to close back above the broken support, confirming the reclaim.
Entry Point:
Enter after reclaim of the support (confirmation candle).
This confirms the seller’s trap/manipulation.
Stop Loss & Target
Stop Loss: Just below the sweep wick (to protect against actual breakdown).
Take Profit: Based on structure or previous resistance zones.
In this chart, a strong impulse followed the reclaim, allowing for a favorable risk-to-reward ratio.
Remarks
Risk Management: Only enter after confirmation to avoid false breakouts.
Psychological Note: This setup works on exploiting retail stop hunts and institutional reclaims.

GBPUSD LongGBP/USD prices could potentially increase from the 1.3146 level within the Fair Value Gap (FVG) zone, with the next likely target being an upper FVG zone as a potential objective.

07.08.25.25 Morning ForecastPairs on Watch -
FX:CADJPY (Live position)
FX:EURNZD
FX:EURCAD
A short overview of the instruments I am looking at for today, multi-timeframe analysis down to what I will be looking at for an entry. Enjoy!

Gold still looking bearish . Gold still looking bearish and respecting the upper trend line . My analysis is just as simple as previous ones hence easy to comprehend .
This is still a sell in as much price holds below the upper trend line . A break below the lower trend line will lead price to 3340s and a break below this again takes us to last weeks low at 3280s - 3270s . Still bearish biases until upper trendline is broken completely .

GBPUSD extends to the downside. Wait for retest to sell✏️ OANDA:GBPUSD confirms the downtrend by breaking the trendline. The downtrend is still extending to lower areas because the GBPUSD bearish wave structure is very beautiful. Some selling momentum appears around the breakout zone of 1.339, which will form a bearish structure towards the support of 1.287 in the near future. Putting faith in the trendline at the moment is reliable.
📉 Key Levels
SELL zone 1.339-1.341
SELL DCA trigger: Break and trading bellow 1.317
Target 1.287
Leave your comments on the idea. I am happy to read your views.

ETHEREUM ELLIOTT WAVE: BULLISH MEGAPHONE BREAKOUT TO $10K? ETHUSD Analysis | Daily Timeframe
Current Price: $3,866
Bias: BULLISH 🟢 CONFIRMED
Pattern: Elliott Wave 5 + Bullish Megaphone
Status: 🔥 MOMENTUM BUILDING 🔥
THE SETUP - BULLISH CONFIRMATION
Elliott Wave Count:
✅ Wave 1: Completed at $4,100 (March 2024)
✅ Wave 2: Corrected to $1,600 (August 2024)
🔄 Wave 3: IN PROGRESS → Target $6,000-$6,200
⏳ Wave 4: Expected pullback to $2,800-$3,200
🎯 Wave 5: ULTIMATE TARGET $10,000+
Bullish Megaphone Pattern:
Expanding triangle since June 2022 low
Key breakout level: $4,100-$4,200 (APPROACHING)
Pattern height: $2,50
Measuring objective: $6,600
🎯 UPDATED PRICE TARGETS
T1: $4,700 (+21.6% gain) - 95% probability
T2: $5,290 (+36.8% gain) - 95% probability
T3: $6,245 (+61.5% gain) - 83.5% probability
🥈 SECONDARY TARGETS
T4: $7,200 (+86.2% gain) - 68% probability
T5: $8,745 (+126.2% gain) - 53% probability
🏆 MOONSHOT TARGET
T6: $10,000+ (+158.7% gain) - 16.8% probability
⚠️ UPDATED RISK MANAGEMENT
🛡️ SUPPORT LEVELS (Bull Market Invalidation)
S1: $3,737 (-3.3% from current) - 1st warning
S2: $3,648 (-5.6% from current) - 2nd warning
S3: $3,546 (-8.3% from current) - 3rd warning
S4: $3,356 (-13.2% from current) - MAJOR SUPPORT
🔴 STOP LOSS OPTIONS
Conservative: Below $3,356 (-13.2% risk)
Aggressive: Below $3,546 (-8.3% risk)
Tight: Below $3,737 (-3.3% risk)
🔥 UPDATED ENTRY STRATEGY
🟢 CURRENT ENTRY (RECOMMENDED)
Entry: $3,866 (current levels)
Stop: $3,356
Risk: -13.2%
R:R to T3: 1:4.7 (Excellent!)
🟡 BREAKOUT ENTRY
Entry: Above $4,200 (confirmation)
Stop: $3,737
Risk: -11.0%
R:R to T3: 1:4.4
🔵 PULLBACK ENTRY (If Available )
Entry: $3,450-$3,555 range
Stop: $3,356
Risk: -2.7%
R:R to T3: 1:18+ (Exceptional!)
🧠 ELLIOTT WAVE PSYCHOLOGY - ACCELERATION PHASE
Current Phase: Early Wave 3 🚀
Status: Momentum building toward breakout
Psychology: Growing recognition
Volume: Should expand on breakout
Participation: Institutional interest increasing
What's Happening NOW:
📈 Price approaching key resistance
📊 Volume building
🌊 Wave 3 characteristics emerging
💰 Smart money accumulating
🎪 MEGAPHONE PATTERN - BREAKOUT IMMINENT
Current Status:
📐 Price at 94% of breakout level
🔊 Volatility expanding as expected
⚡ Breakout catalyst building
🎯 $6,600 target on deck
Breakout Levels:
Resistance: $4,100-$4,200 (6.1-8.6% away)
Volume: Need 2x average on breakout
Target: $6,600 minimum (+70.7% gain)
🎲 UPDATED $10K PROBABILITY ANALYSIS
📊 SCENARIO BREAKDOWN (From $3,866)
🟢 Optimistic (40% probability)
Gain Required: +158.7%
Timeframe: 6-18 months
Catalyst: Parabolic Wave 5 + Major news
🟡 Moderate (25% probability)
Gain Required: +158.7%
Timeframe: 1-2 years
Catalyst: Institutional adoption wave
🔴 Conservative (15% probability)
Gain Required: +158.7%
Timeframe: 2-3 years
Catalyst: Extended crypto bull market
📈 WEIGHTED AVERAGE: 24%
🎯 RISK-ADJUSTED: 16.8%
🔍 IMMEDIATE CATALYSTS TO WATCH
🟢 BULLISH MOMENTUM DRIVERS
✅ Price approaching breakout zone
✅ Elliott Wave 3 acceleration
✅ Institutional accumulation
✅ DeFi TVL growth
✅ Layer 2 adoption
⚠️ NEAR-TERM RISKS
🔴 Rejection at $4,100-$4,200
🔴 Bitcoin correlation breakdown
🔴 Macro headwinds
🔴 Profit-taking pressure
📅 UPDATED TIMELINE EXPECTATIONS
📍 Next 2-4 weeks: Test $4,100-$4,200 breakout
📍 Q4 2025: Rally to $6,000-$6,200 (if breakout)
📍 Q1 2026: Potential Wave 4 correction
📍 Q2-Q4 2026: Wave 5 extension → $10,000+ potential
💡 UPDATED TRADING PLAN
🎯 POSITION SIZING (From $3,866)
Core Position: 60% at current levels (PRIORITY)
Breakout Add: 25% above $4,200
Pullback Add: 15% on any dip to $3,450-$3,555
💰 PROFIT TAKING STRATEGY
20% at $4,700 (lock in +21.6%)
25% at $5,290 (secure +36.8%)
25% at $6,245 (major target +61.5%)
30% HODL for $10K+ (moonshot +158.7%)
⏰ TIME MANAGEMENT
Immediate: Watch for $4,200 breakout
Short-term: Reassess if below $3,737
Long-term: Major review if below $3,356
🚨 URGENT UPDATE SUMMARY
🔥 WHAT CHANGED:
Price up +5.2% to $3,866 (bullish confirmation)
Now only 6.1% from key breakout at $4,100
Risk/reward ratios improved significantly
Momentum building toward critical resistance
⚡ IMMEDIATE ACTION:
BUY SIGNAL ACTIVE at current levels
Stop loss: $3,356 (-13.2% risk)
First target: $4,700 (+21.6% gain)
R:R = 1:4.7 (Excellent setup!)
🎯 KEY LEVEL TO WATCH:
$4,100-$4,200 = Make or break zone
Break above = Explosive move to $6,600+
Rejection = Pullback to $3,450-$3,555
🔮 BOTTOM LINE - UPDATED
The Setup: Even stronger! Price action confirming Elliott Wave count with momentum building toward the critical $4,100-$4,200 breakout zone.
The Opportunity: Now at $3,866, we're positioned perfectly for the next leg up. Risk/reward of 1:4.7 to major target is exceptional.
The Risk: Manageable at -13.2% to major support at $3,356.
The Play: BUY NOW - This is the sweet spot before the breakout. Scale in aggressively at current levels.
📊 UPDATED CHART FOCUS
🎯 CURRENT PRICE: $3,866 (+5.2% momentum)
📈 IMMEDIATE TARGET: $4,200 breakout (+8.6%)
🚀 HIGH PROBABILITY: $6,245 (+61.5%)
🌙 MOONSHOT: $10,000+ (+158.7%)
🛡️ STOP LOSS: $3,356 (-13.2%)
⚡ PATTERN: Bullish Megaphone + Elliott Wave 3
🚨 TRADE ALERT: BUY SIGNAL ACTIVE 🚨
Entry: $3,866 (NOW)
Stop: $3,356
Target 1: $4,700
Target 2: $6,245
Moonshot: $10,000+
⚠️ DISCLAIMER: This analysis is for educational purposes only. Cryptocurrency trading involves substantial risk. Always do your own research and never risk more than you can afford to lose.

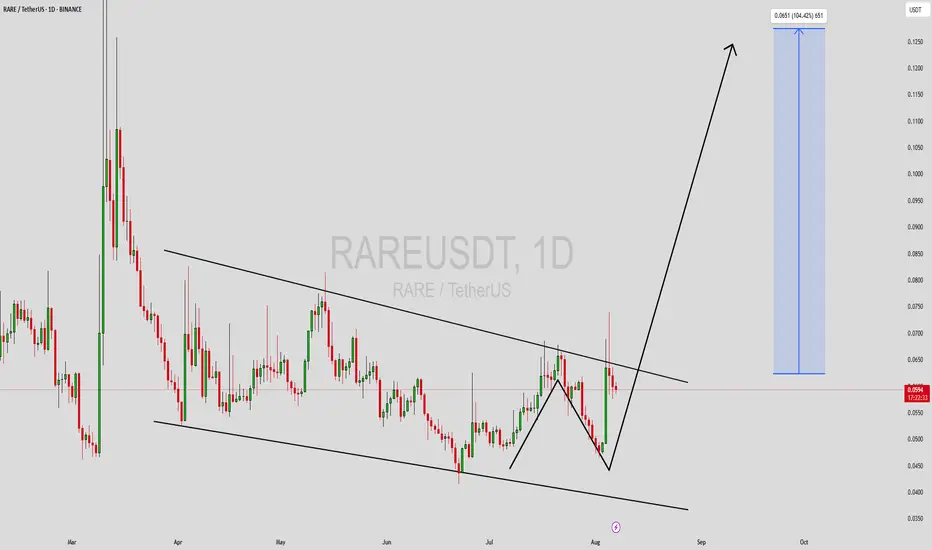
RAREUSDT Forming Bullish WaveRAREUSDT is currently forming a powerful bullish wave pattern on the daily chart, indicating a strong momentum buildup and potential for a massive breakout. This structure is often a hallmark of continued trend movement, especially when supported by increasing volume and investor interest. The price appears to be following a classic wave cycle, where each dip is met with stronger buying pressure—pointing toward a possible explosive move to the upside in the coming days or weeks.
The current setup is especially appealing to technical traders, with RAREUSDT maintaining its bullish structure above key support levels and preparing for a potential next wave that could deliver gains in the range of 140% to 150% or more. Volume analysis shows increasing activity, suggesting that smart money might already be positioning itself ahead of a bigger rally. The bullish wave pattern unfolding suggests continuation and trend strength, with higher highs and higher lows giving traders the confidence to target extended price levels.
As more investors take notice of the bullish technical pattern and volume surge, RARE becomes a coin to watch closely in the altcoin market. Its recent price action, combined with wider market optimism and social buzz, makes it a solid candidate for mid-term swing trades. With the proper risk management, this chart could be a textbook example of a breakout from accumulation into expansion.
If you're eyeing high-probability technical setups in the crypto space, RAREUSDT certainly deserves a place on your watchlist.
✅ Show your support by hitting the like button and
✅ Leaving a comment below! (What is You opinion about this Coin)
Your feedback and engagement keep me inspired to share more insightful market analysis with you!