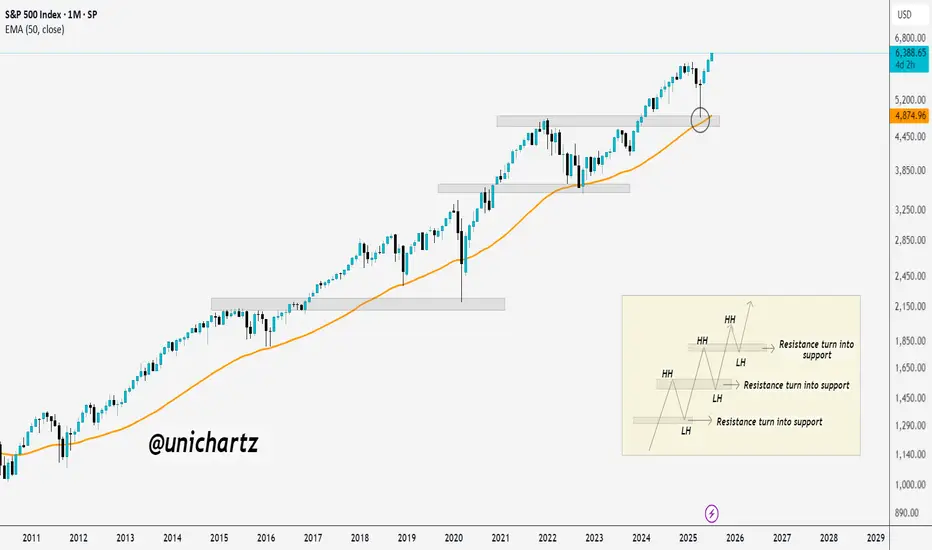
New All-Time Highs for S&P 500 – No Resistance AheadThe S&P 500 is officially in price discovery mode, printing new all-time highs with clean higher highs and higher lows.
Each old resistance flipped into strong support—textbook bullish market structure.
As long as this trend holds, there's no ceiling in sight. Bulls are fully in control.
Community ideas
4-hour channel midlineThe price has reached the midline of the 4-hour channel, and buying volume has decreased in this area.
We need to see whether the price can break above the midline or not.
If it breaks to the upside, our first target will be the top of the channel.
If it gets rejected, our target will be the bottom of the channel.

ERA USDT NEXT VIEW Era Usdt looking goods from her for long position
Looking strong technical Analysis 🏆

BofA note: Revenue strength could ease AI spending uncertaintyStrong Q can reinforce confidence in AI ad engine: With AI ROI a key stock sentiment driver, 2Q positives could include:
1) Ad rev upside reinforcing confidence in Meta’s AI ad engine,
2) strong road map for 2H ad products,
3) optimism on new revenue opportunities for AI (Llama licensing, subscriptions, etc.) With Street likely anticipating 2Q revenue upside, risks are high expectations and higher expenses offset revenue revisions. Also, EU regulatory uncertainty is likely to continue.
AI positioning optimism reinforced by performance:
Given recent CEO posts, we expect big focus on AI investment and opportunities on the call, with possible updates on Llama and AI monetization strategies. Given audience scale, we continue to see Meta as one of the best AI opportunity stocks, with potential revenue upside as AI capabilities are integrated into the ad stack. At 24.5x our 2025 EPS, and with more investment coming, continued rev. momentum (which we expect) and a convincing AI product roadmap are key for maintaining sentiment & multiple.

Ethereum Long: Using Log Chart to Analyze, Target $6600In this video, I go through the analysis using the log chart for Ethereum and shows the potential of this cryptocurrency where I expect the price to reach new high in the coming days with a longer-term target of $6600.
For shorter-term trading, I recommend placing the stop a distance below recent support on the daily chart, around $3372.
Good luck!

DXY 4Hour TF - July 27, 2025DXY 7/27/2025
DXY 4hour Bearish Idea
Monthly - Bearish
Weekly - Bearish
Dailly - Bearish
4hour - Bearish
**We analyze DXY as an indicator of USD strength on a week to week basis**
This week is looking like we can expect bearish momentum on USD but here are two scenarios breaking down the potential:
Bearish Continuation - USD pulled a strong bearish reversal all last week which pushed us below our major 98.000 support zone.
We are now testing that same 98.000 zone as resistance and are looking to see if it will hold. Ideally, we can confirm further bearish structure to gain confidence in a bearish USD for the week ahead.
Bullish Reversal- For us to consider DXY as bullish again we would need to see bullish structure above our 98.000 zone. This would include: A break back above 98.000 with an established HH and HL.

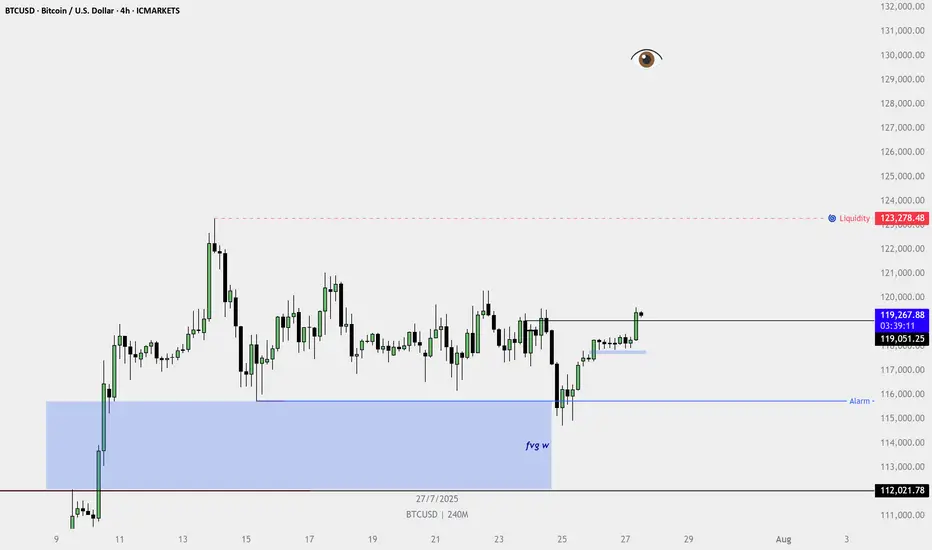
BTCUSD 4H chart is clearly showing a bullish structure.🔍 Technical Highlights:
HTF FVG Tap (Marked as "fvg w"):
Price reacted strongly from the weekly fair value gap, indicating institutional buying interest from a higher timeframe demand zone.
Higher Low + Bullish Break:
Price formed a higher low and broke above the recent swing high, confirming a shift to bullish structure.
4H Bullish FVG Formed:
After the breakout, a fresh bullish FVG formed on the 4H chart — a classic sign of momentum and continuation.
Breaker Structure Confirmed:
Price closed above a series of bearish candles, confirming buyer strength and trapping late sellers.
Internal Liquidity Taken:
The range-bound consolidation (chop) has been swept, clearing out internal liquidity and fueling the breakout.
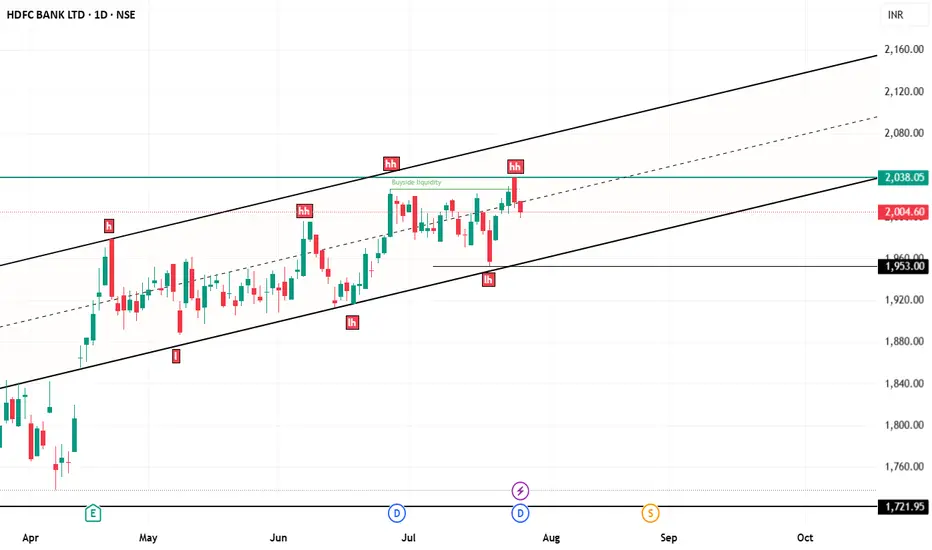
hdfc bank chart analysishdfc bank chart here in your screen
price working in parallel channel and 2038 is most important level for upside rise...
if 2038 break out with powerful vollume and candle then again we can see rally.
but a pattern here that is higer high and lower low...

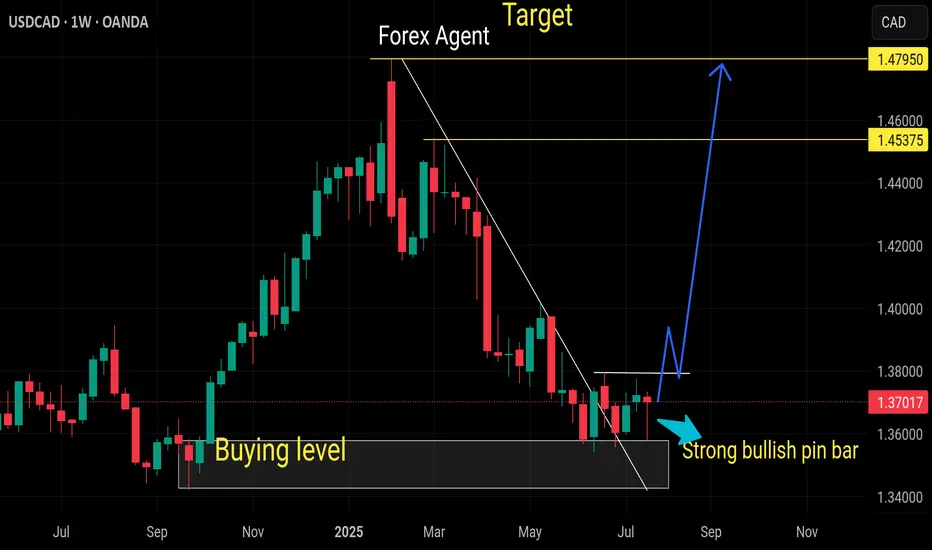
Buy usdcadStrong buyers coming now
Weekly pin rejection
Monthly oversold pair
Daily trend already breaks
HOPR chart bullishHOPR chart bullish
Currently trading at $0.78
Next resistance $0.90 and $0.10
Rsi = Bullish
Stoch = Rsi Bullish
Macd = Bullish

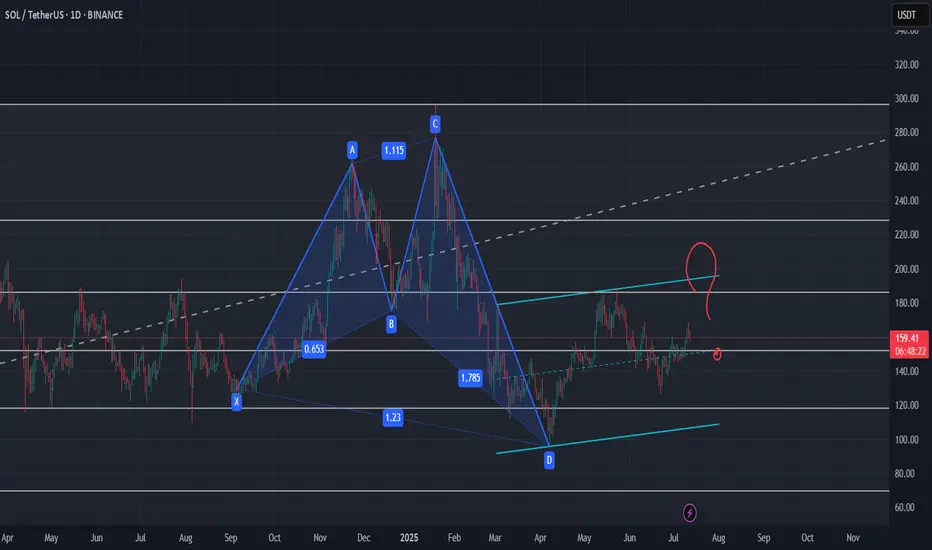
HARMONIC PATTERN on Daily for SOL ?I wonder if this pattern is the one which is highlighted by our friend and chart analyst @The_Alchemist_Trader_
Let's see if it need to test one last time the support of this channel or if it will break out for the long waited rally.
Level to keep an eye :
0.5 Fib support need to hold and clean breakout of the 0.382 Fib
Indicators : RSI, volume and volatility (liquidations)
Gold. GC1! Weekly Outlook. 27.07.2025, SundayCOMEX:GC1!
Outlining gold on HTF. Waiting for FOMC and NFP

Sugar Future - New York (Raw) Quote | Chart & Forecast SummaryKey Indicators On Trade Set Up In General
1. Push Set Up
2. Range Set Up
3. Break & Retest Set Up
Notes On Session
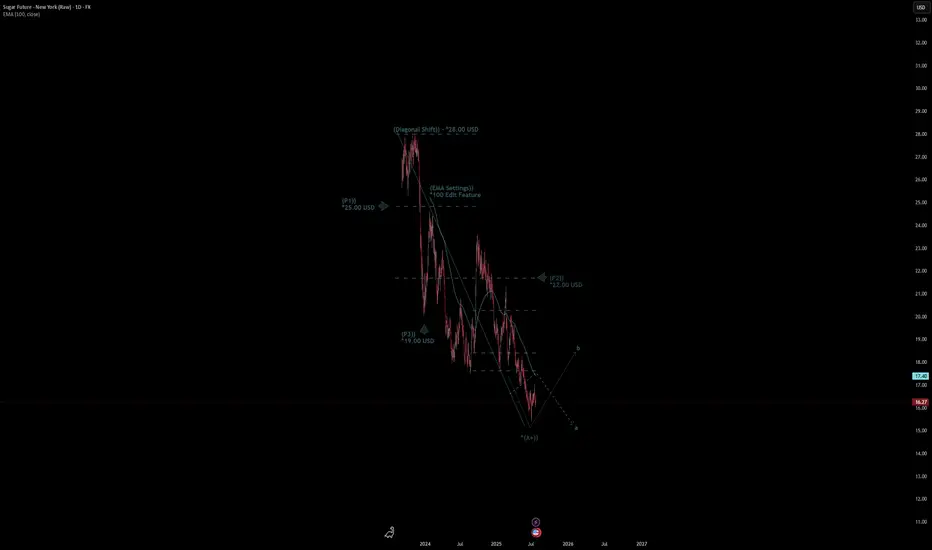
# Sugar Future - New York (Raw) Quote
- Double Formation
* (Diagonal Shift)) - *28.00 USD | Completed Survey
* (EMA Settings)) - *100 Edit Feature | Subdivision 1
- Triple Formation
* (P1)) / (P2)) & (P3)) | Subdivision 2
* (TP1) = a / Long Consecutive Range
* (TP2) = b / Short Consecutive Pullback | Subdivision 3
* Daily Time Frame | Trend Settings Condition
- (Hypothesis On Entry Bias)) | Regular Settings
- Position On A 1.5RR
* Stop Loss At 19.00 USD
* Entry At 16.00 USD
* Take Profit At 12.00 USD
* (Downtrend Argument)) & No Pattern Confirmation
- Continuation Pattern | Not Valid
- Reversal Pattern | Not Valid
* Ongoing Entry & (Neutral Area))
Active Sessions On Relevant Range & Elemented Probabilities;
European-Session(Upwards) - East Coast-Session(Downwards) - Asian-Session(Ranging)
Conclusion | Trade Plan Execution & Risk Management On Demand;
Overall Consensus | Sell
PPAP- LONG NSE:PPAP Weekly long consolidation breakout with retest may continue steady and long rally for short to medium term.

Litecoin (LTC): Looking for Breakout + Targets to be ReachedLitecoin has done very well recently, where the current price is testing the branch of EMAs, where we are expecting to see a breakout, after which we will be looking for upward movement toward our first and second targets.
Swallowa Acaademy
