XRP – Reversal Loading at the Demand Floor ?XRP is approaching a critical point within its descending channel, where price has tested the demand floor multiple times and continues to hold above the structural low marked with the red X. This area has acted as a major liquidity pocket, and the market is showing early signs of absorption rather than continuation to the downside.
The overall structure still respects the descending channel, but the reaction from the lower boundary suggests that sellers are weakening while buyers are gradually stepping in. This type of behaviour often precedes a mid-term trend reversal, especially when the market begins to form higher lows inside the same range.
A breakout above the internal trendline would shift momentum upward and open the door for a larger continuation move into the upper supply block. As long as price holds above the current structural low, the bullish scenario remains active.
Key Technical Notes:
• Strong demand response near the channel’s lower boundary
• Price defending the final structural low (red X)
• Potential bullish divergence forming as momentum begins to stabilise
• Break above the inner descending trendline can trigger acceleration
Simple Interpretation:
XRP is bouncing from major demand and trying to regain momentum. A breakout above the internal resistance trendline could confirm the start of a larger reversal wave.
Invalidation:
A clean breakdown below the red X level would invalidate the bullish scenario and open the way toward deeper support zones.
Community ideas

Idol me this, Second roundWell Well Well,
We are in a difficult position, between a huge up and a slight down. It's a risky trade that can offer a great payout.
IT IS RISKY, i repeat, IT'S a RISKY trade. --> low size
Trade to your own risk.
In : 0.03175
Leverage 8-12
Sl : Use your eyes, it's in the graph
See ya another day

BTCUSD – Technical OutlookBitcoin rejected the upper supply zone near 93,000 and is now pulling back toward the mid-range support around 89,000. This area has acted as a key pivot, and buyers have previously defended it with strength.
While price remains above this support zone, the structure stays bullish in the short term, but BTC needs to reclaim 92,000–93,000 to continue the upside. Failure to hold 89,000 could open the door to a deeper retracement toward 86,500.
Market is balanced, trading between strong supply and demand zones.

$AUDIO bottomed. Trend reversal soon!Audius has been steadily rebuilding its momentum with real product updates, expanding creator tools, and stronger community incentives. The platform is shipping consistently: new artist-token features, improved discovery, remix tools, and integrations like Feature.fm are driving higher engagement. User activity is rising, while the token sits near long-term support with declining sell pressure. With ecosystem growth, renewed partnerships, and a recovering market environment, CRYPTOCAP:AUDIO is positioned for a clear trend reversal as fundamentals and sentiment finally align.

Xauusd from Ment-methodBig move up ahead as the aggressive bull broke the long term trendline. Consider todays is Friday session, lets take a look what happen next week as this week's slow move/accumulation might indicates a stage 2 moves next.

THE TREND IS YOUR FRIEND As much as we can see buying activity erupting, we should be aware that the BULL run is over and allow the trend line guide us to the best entries where the bears are waiting

Elise | BTCUSD 4H — Break of Bearish Structure |BITSTAMP:BTCUSD
Price previously rejected from the major corrective zone and continued bearish until a final liquidity grab created imbalance and shift of character. The recent breakout from the bearish channel and bullish momentum suggests institutional repositioning, preparing for upside continuation toward higher correction levels.
Key Scenarios
🚀 Bullish Case (Primary Bias)
If price re-tests and holds above 93,500–95,300, upside continuation is expected:
🎯 Target 1: 100,500
🎯 Target 2: 105,800
🎯 Target 3: 116,200 (Major Correction Zone)
📉 Bearish Case (Invalidation)
A clean breakdown below 88,500 would shift bias back to bearish and may revisit the liquidity grab zone.
Current Levels to Watch
Entry Zone: 93,500–95,300
Support: 88,500
First Breakout Confirmation: Above 96,000
⚠️ Disclaimer: This analysis is for educational purposes only — not financial advice.

Upward ChannelExpecting to complete wave 5. Watching closely at the very top if will break out or Sell opportunity will be the next move.

solana is ready to pump?currently I see solana ascending and getting ready to decide where we are heading, the way the market looks I dont want to get in a trade and get sandwiched in.
were either going to be
* bouncing off the small yellow trend line and go up to $145 and break towards the upside ^
* bounce off the small yellow trend line hit $145 to reject that level and head down to $135 again and finally bounce back up and retest to break $145 ^
* break small trend line and go lower towards $120 again and lower.

MOODENGUSDT 1D#MOODENG is moving inside a descending channel on the daily chart. Volume has increased, and on its first attempt it was rejected from the channel resistance and the daily SMA50. Keep an eye on it. If price breaks above both levels, the potential targets are:
🎯 $0.10398
🎯 $0.11635
🎯 $0.12871
🎯 $0.14631
🎯 $0.16873
⚠️ Always remember to use a tight stop-loss and maintain proper risk management.

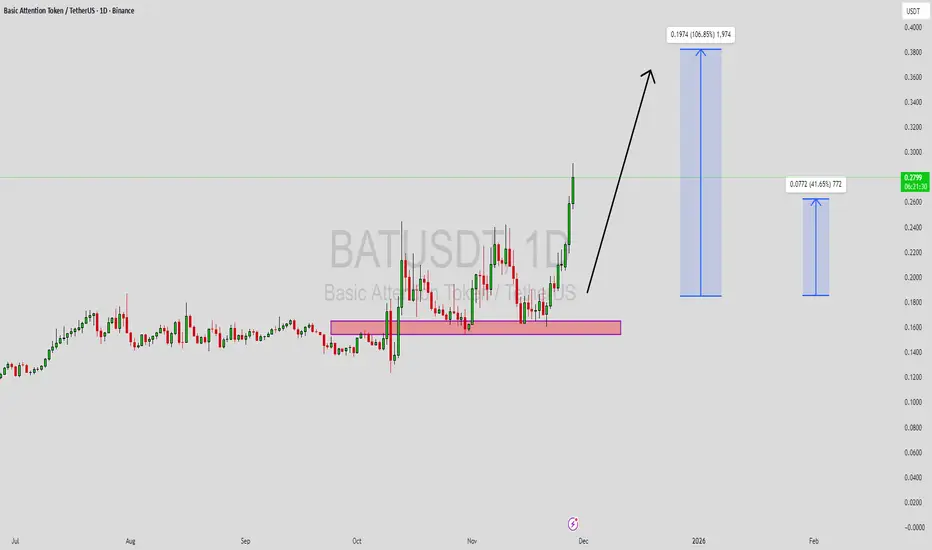
BATUSDT Forming Bullish MomentumBATUSDT is forming a clear bullish momentum pattern, a classic bullish reversal signal that often indicates an upcoming breakout. The price has been consolidating within a narrowing range, suggesting that selling pressure is weakening while buyers are beginning to regain control. With consistent volume confirming accumulation at lower levels, the setup hints at a potential bullish breakout soon. The projected move could lead to an impressive gain of around 90% to 100% once the price breaks above the wedge resistance.
This falling wedge pattern is typically seen at the end of downtrends or corrective phases, and it represents a potential shift in market sentiment from bearish to bullish. Traders closely watching BATUSDT are noting the strengthening momentum as it nears a breakout zone. The good trading volume adds confidence to this pattern, showing that market participants are positioning early in anticipation of a reversal.
Investors’ growing interest in BATUSDT reflects rising confidence in the project’s long-term fundamentals and current technical strength. If the breakout confirms with sustained volume, this could mark the start of a fresh bullish leg. Traders might find this a valuable setup for medium-term gains, especially as the wedge pattern completes and buying momentum accelerates.
✅ Show your support by hitting the like button and
✅ Leaving a comment below! (What is your opinion about this Coin?)
Your feedback and engagement keep me inspired to share more insightful market analysis with you!
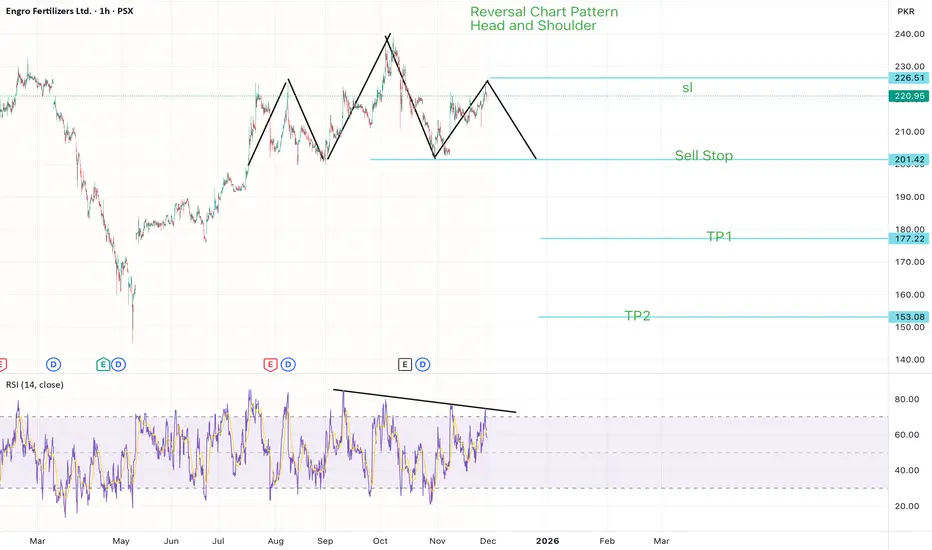
Head and Shoulder pattern in Engro Fertilizers Ltd PSXHead and shoulder pattern and so the trend is reversal and you can also the the divergence in the RSI and when the price cross 201 PKR its mean the price will be bearish and hot the tps.

Stop!Loss|Market View: NZDUSD🙌 Stop!Loss team welcomes you❗️
In this post, we're going to talk about the near-term outlook for the NZDUSD currency pair☝️
Potential trade setup:
🔔Entry level: 0.57355
💰TP: 0.57796
⛔️SL: 0.57134
"Market View" - a brief analysis of trading instruments, covering the most important aspects of the FOREX market.
👇 In the comments 👇 you can type the trading instrument you'd like to analyze, and we'll talk about it in our next posts.
💬 Description: By the end of the week, the US dollar remains under pressure for the short term, so a rise to 0.58000 is also expected for NZDUSD. A potential buy trade could be initiated by breaking the upper limit of the current accumulation in the triangle pattern that has formed at 0.57300.
Thanks for your support 🚀
Profits for all ✅

XRP DECIDES Rounding up the Bull run and getting ready to move with the bear on the best POI’s available, the trend lines will guide you

$BTC Cycle Analysis - ISM vs 4-Year CycleRiddle me this...
If crypto just runs off the ISM and it topped in March 2021 then why did we get a second HIGHER peak in November 2021 ???
All social and risk metrics topped at the same time as the ISM as well...
It's almost as if 🤔

Gold 4H Outlook – Trendline Structure AnalysisGold is testing a key confluence area where the descending red trendline (bearish structure) intersects with the ascending green trendline (short-term support).
Despite the recent push higher, price action still shows rejection wicks near 4,220–4,230, indicating exhaustion and a possible return toward structural support.
As long as gold remains below the red trendline, bearish pressure remains active. A clean rejection here may trigger a short-term pullback toward the 4,160–4,150 region, followed by a deeper retest of the horizontal support around 4,128 — a major liquidity zone that aligns with the trendline intersection.
A confirmed candle close above the red trendline invalidates this scenario and reopens the path toward 4,253.
Structure Summary:
Below red trendline → bearish reaction likely
First target zone → 4,160–4,150
Major support / key test → 4,128
Break & close above red trendline → bullish continuation
This scenario remains valid as long as price respects the red trendline.
— Avo.Trades

DOGE for the HOlidays?Hello,
This is. Probability map of Doge’s near term future behavior, based on recent “harmonic patterns” or level behavior… at various time frames… scaled to fit the recent levels… dotted are the ceiling, solid the floor ;)
Once we see that a particular pattern is tracking preferential, it can provide a very advantageous look into “future”.
Some times the hardest part is calming the nerves, and just holding position, while waiting for the forecasts to play out.
Doge… good boy!

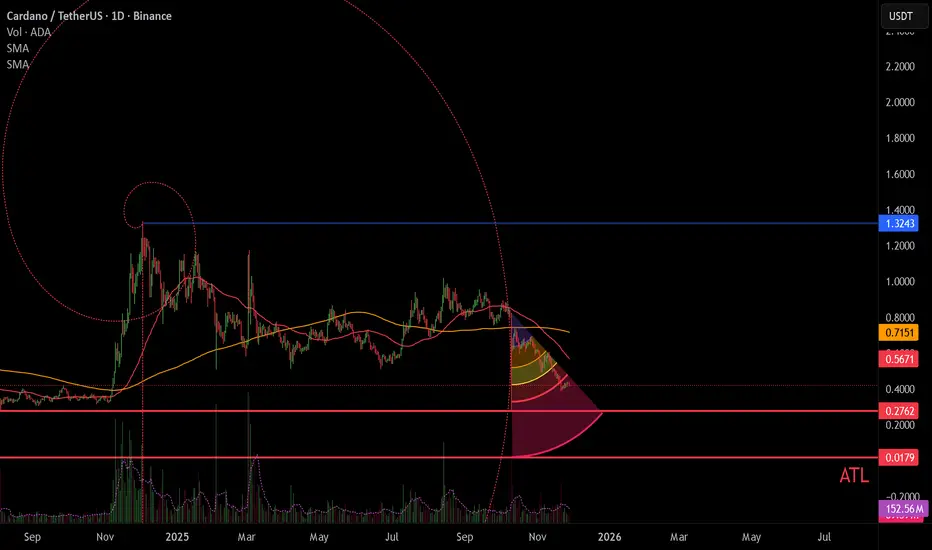
Cardano: Jump the Ghost Ship — It's Running Out of Ghosts!Fun di Mental:
ADA isn’t just breaking down on the chart — it’s breaking down everywhere.
The death cross on the daily isn’t a signal anymore; it’s a eulogy. Price slippery under key supports because there’s simply no bid left; no more greater fools. Liquidity is thin, volume is fading, and the only thing rising is the number of people pretending they “were never really into Cardano anyway.”
Cardano was always called a ghost chain, but now it has the metrics to prove it. Active addresses collapsed, DeFi TVL drained out, and the network’s economic engine is stalling so badly that SPOs are on the edge of shutting down because the rewards don’t justify the cost. When your validator base is contemplating mass rage-quitting, the trend isn’t your friend.
On November 21, 2025, Cardano suffered a “chain split”: a single malformed delegation transaction exploited a long-existing (Peer reviewed??) bug in the node software and resulted in part of the network accepting a “poisoned” ledger while the rest stayed on the “healthy” chain. That split caused block production to slow or pause for over an hour. Some exchanges and wallets temporarily halted ADA deposits/withdrawals.
Technical:
ADA is in a confirmed macro downtrend — lower highs, lower lows, and a death cross already printed (50D < 200D). This is the classic “lights-out” pattern for L1s entering terminal decline.
Moving Averages:
ADA basically front-ran its own death cross — the price nuked before the bearish crossover even printed.
The long-term SMA around $0.71 is now a ceiling of doom — a structural reminder of how far ADA has fallen and how far buyers have abandoned the asset.
Key Levels:
$0.576 – First major supply wall; not relevant unless ADA resurrects from the dead.
$0.276 – The next real destination. A high-probability magnet.
$0.017 (ATL) – Worst Case: The historical bottom (probably late 2026 - Early 2027).
Fibonacci Spiral: ADA is pressed against the inner curvature — a classic “collapse spiral.”
Fibonacci Speed Resistance Fan: Price is pinned under the steepest bands, confirming relentless seller control. Every bounce has been slapped down instantly.
Volume & Momentum:
Volume is anemic. Momentum candles are heavy red, with ADA showing the classic “ghost fade” — slow, steady suffocation with no bid support.
Outlook:
Structure points straight to $0.276 first, with the ATL absolutely on the table if fundamentals keep rotting.
Always-Sunny Sometimes-Blockchain Visionary, Charles Hoskinson
Meanwhile, Charles Hoskinson is busy building Midnight, a brand-new chain that just so happens to… replace most of what Cardano was supposed to become. When the founder starts eyeing the emergency exit, you don’t need on-chain analytics to know the vibz are B as F.
AWEUSDT Forming Falling WedgeAWEUSDT is forming a clear falling wedge pattern, a classic bullish reversal signal that often indicates an upcoming breakout. The price has been consolidating within a narrowing range, suggesting that selling pressure is weakening while buyers are beginning to regain control. With consistent volume confirming accumulation at lower levels, the setup hints at a potential bullish breakout soon. The projected move could lead to an impressive gain of around 140% to 150% once the price breaks above the wedge resistance.
This falling wedge pattern is typically seen at the end of downtrends or corrective phases, and it represents a potential shift in market sentiment from bearish to bullish. Traders closely watching AWEUSDT are noting the strengthening momentum as it nears a breakout zone. The good trading volume adds confidence to this pattern, showing that market participants are positioning early in anticipation of a reversal.
Investors’ growing interest in AWEUSDT reflects rising confidence in the project’s long-term fundamentals and current technical strength. If the breakout confirms with sustained volume, this could mark the start of a fresh bullish leg. Traders might find this a valuable setup for medium-term gains, especially as the wedge pattern completes and buying momentum accelerates.
✅ Show your support by hitting the like button and
✅ Leaving a comment below! (What is your opinion about this Coin?)
Your feedback and engagement keep me inspired to share more insightful market analysis with you!

Thanksgiving volatility is limited, precise strategy is key.#XAUUSD OANDA:XAUUSD TVC:GOLD
🙏Today is Thanksgiving, and the market will close early. Gold trading is likely to be quiet, and with insufficient liquidity, it is expected to continue to fluctuate within a narrow range.
📊However, as I said yesterday, core safe-haven demands such as the Fed's interest rate cut expectations and geopolitical factors continue to provide some support for gold prices, and the upward structure has not been broken. The holiday effect is simply limiting significant volatility. Pullbacks are all for building momentum for a subsequent bullish rally.
📈The short-term daily MA5 is moving upward, and the 4-hour moving average and Bollinger middle line are also around 4135, which together with 4125 below form short-term support. On the first pullback to the 4135-4125 area, you can consider a small long position. The key support level to watch remains unchanged at around 4115-4100, near the daily MA10. As long as this level holds, the market's bullish trend will remain intact.
🌈Regarding resistance, continue to focus on the 4170-4180 range, a breakout would lead to an attack on the 4195-4205 range.
✅In summary, our strategy remains unchanged: in the absence of data or news-related factors today, we will primarily focus on buying on dips and waiting for the market to provide opportunities to buy at lower prices.

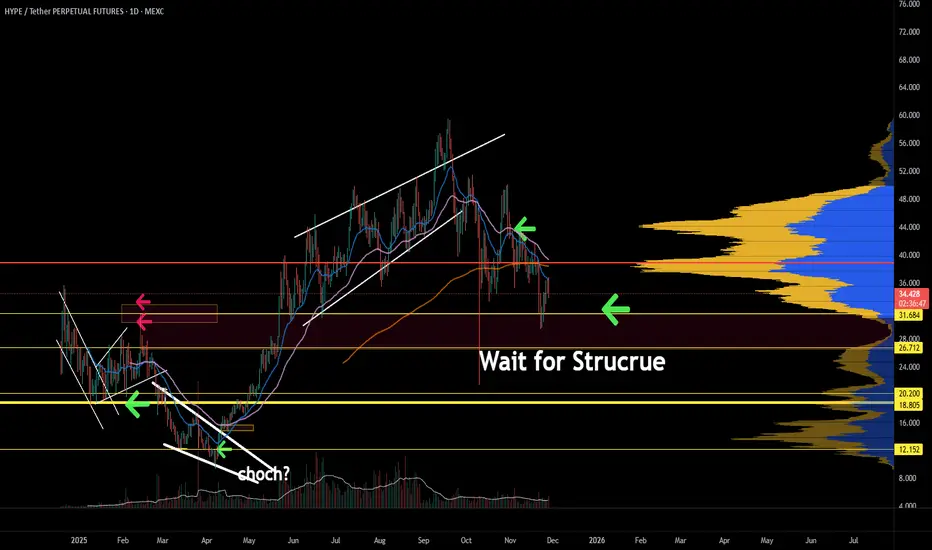
Hyperliquid needs to prove itself. HYPE just lost its mid-range support and is now tapping a major high-volume node on the VPVR. This zone is historically where buyers stepped in, but structure hasn’t confirmed a reversal yet.
🔻 Momentum: Multiple overbought rejections on the oscillator + MACD still crossing down.
🔻 Trend: Breakdown from the rising channel + failure to hold EMAs.
🟧 Current Zone: Price is sitting inside a heavy demand block, but weakness persists.
🟩 Bull Case:
Watch for a clean market structure shift (higher low + higher high) before calling the bottom. Without confirmation, this can easily drift lower into the next liquidity pocket.
🟥 Bear Case:
A rejection at this level sends HYPE into the deeper value area below. There’s not much volume support until the lower yellow band.
📌 Summary:
This is a high-interest zone, but not a high-confidence one yet.
Wait for structure. Let the reversal prove itself.
Risk/Reward 2.24 on XAUUSD-GOLD – Is Opportunity Coming?Good Morning Guys
I’ve put together a 4-hour timeframe analysis on XAUUSD – GOLD.
Once the harmonic pattern completes, I’m expectin’ a correction right around the 4215.0 level.
That’s where the pattern should wrap up, and from there price is likely to pull back.
✅ Entry Level: 4215.0
🛑 Stop: 4270.0
🎯 TP1: 4189.0
🎯 TP2: 4149.0
🎯 TP3: 4097.0
⚖️ Risk/Reward Ratio: 2.24
Also, the Supply-Demand zone sits between 4045.0 – 4000.0.
If price drops into that area, I’ll be lookin’ to buy.
Once we hit that zone, I’ll drop another signal for y’all.
Every single like from you guys keeps me motivated to share these analyses.
Big thanks to all my friends who support me with their likes – y’all are the reason I keep postin’.
