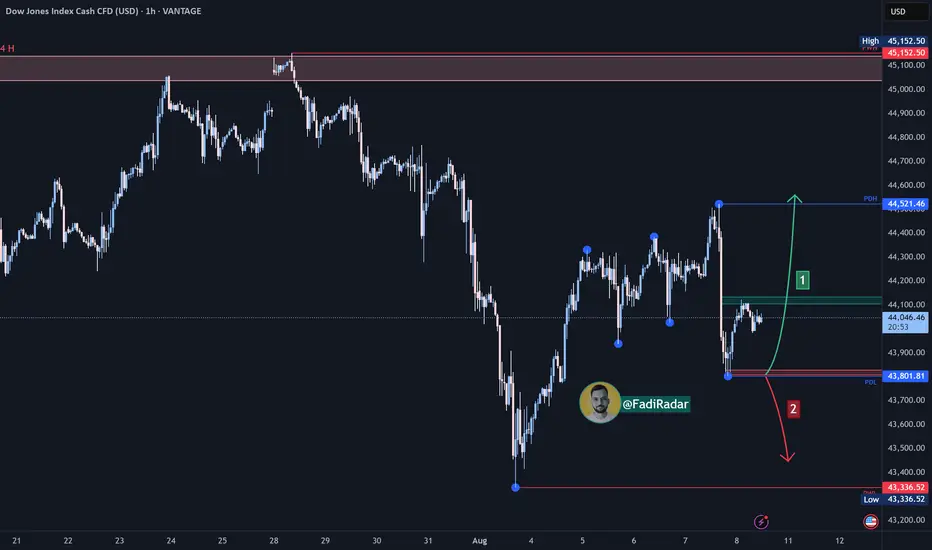
Dow Jones Index (US30 / Dow Jones) Analysis:The Dow Jones index is currently moving sideways and is trading near the $44,000 level.
🔻 Bearish Scenario:
If selling pressure leads to a break below the $43,800 area, the index may drop to test the $43,300 level, which is considered a critical support in the short term.
🔺 Bullish Scenario:
The price may test PDL (Previous Day Low) at $43,800 as a support zone and bounce upward. If the index breaks and holds above $44,100, this could lead to a continuation toward $44,520, and then to $45,000, a key resistance zone.
⚠️ Disclaimer:
This analysis is not financial advice. It is recommended to monitor the markets and carefully analyze the data before making any investment decisions.
Community ideas
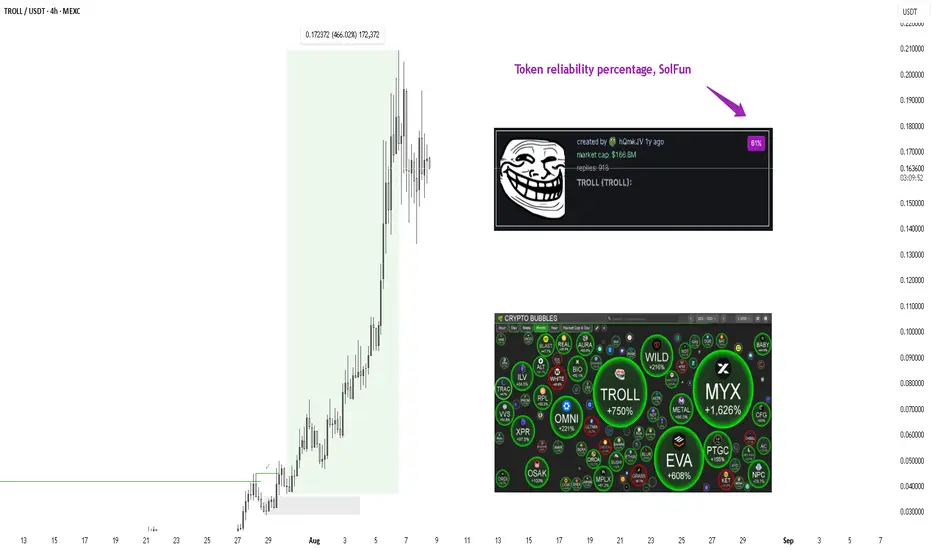
Solfun. Troll's growth: fundamentals versus technical analysis500% in one day — and not a single clue on the chart
The Troll token gained more than 500% in one day. Such movements are not uncommon for the Solana memetoken market, but this case is indicative. If someone had tried to predict the growth using technical analysis, they would have been left with nothing:
there were no patterns on the chart;
there was no break in the structure;
the indicators were silent
The reason is simple — most new tokens on Solana don't even have a trading history to build technical analysis on. In addition, the average meme token rarely lasts more than a week, and a significant portion of projects turn out to be scams.
In the case of Troll, the impetus was not the chart at all, but a Twitter post from the Pump.fun account mentioning the token. It was this factor that triggered a wave of purchases, which led to a 750% increase at its peak.
When the chart is silent, fundamentals speak
In the world of memecoins, fundamental analysis is a quick snapshot of key metrics that can be checked in the first minutes of a token's existence:
supply distribution;
the share of bots among holders;
activity on social networks;
the presence of suspicious large addresses.
If you answer each of these metrics for yourself, you can already form a basic understanding: is the token worth paying attention to, or is it better to pass it by?
You can either collect all the necessary data yourself or switch to automation by using a cumulative integral indicator that combines all of this into a single number — the token's reliability percentage.
This percentage is a key metric that many traders rely on when making decisions. It is formed from a whole set of factors:
uniformity of token distribution;
degree of decentralization;
real audience activity;
abnormal transactions;
dynamics of interest on social networks.
This is the percentage that many traders look at first: if it is below 20% , the project is immediately rejected.
Automation instead of manual analysis
Collecting such data manually takes too long. By the time a trader checks the distribution of supply, holders, and activity on social media, the desired deal may already be gone. Therefore, the market has gradually shifted to automation.
There are now many browser extensions that analyze tokens and indicate the final reliability percentage instead of the trader.
In my case, SolFun is just one such tool, a standard within the Solana ecosystem. The extension is built directly into the Pump.fun interface, works in real time, and aggregates key metrics into one convenient indicator.
In the case of Troll, SolFun showed 61% reliability — a high level for a new token amid a flood of daily scam projects.
Conclusion
The story with Troll is just an illustration of a general pattern in the Solana memetoken market: technical analysis is often useless. What matters here is the speed of obtaining information and the ability to quickly filter the flow of projects. Either manual work or connecting automation in the form of SolFun and other extensions.
The speed of analysis is especially important in an environment where every extra hour can cost you a missed deal.
EURJPY Buyers In Panic! SELL!
My dear subscribers,
EURJPY looks like it will make a good move, and here are the details:
The market is trading on 172.25 pivot level.
Bias - Bearish
Technical Indicators: Both Super Trend & Pivot HL indicate a highly probable Bearish continuation.
Target - 171.49
About Used Indicators:
The average true range (ATR) plays an important role in 'Supertrend' as the indicator uses ATR to calculate its value. The ATR indicator signals the degree of price volatility.
Disclosure: I am part of Trade Nation's Influencer program and receive a monthly fee for using their TradingView charts in my analysis.
———————————
WISH YOU ALL LUCK

XAUUSD - The bullish backdrop remains strongOverall Market Sentiment
The bullish background remains strong: the dollar index is putting pressure on gold, while geopolitical tensions and expectations of a rate cut by the Fed are increasing demand for the safe-haven asset
Direction by indicators: on Investing.com — 9 “Buy” signals against 3 “Sell” signals on moving averages and a neutral overall state
Support and resistance levels
Key support levels: $3,320 and $3,368–$3,340. A rebound from this zone could serve as a starting point for growth
Resistance: it is important to break $3,400 — a psychological and technical barrier, above which a directional move to $3,450 and beyond will open
Short-term scenario (LiteFinance): gold is testing resistance in the $3,380–$3,391 zone; a drop from there could lead to $3,330 → $3,268, and a breakout to the upside would accelerate growth to $3,493–$3,515
Union traders are noting the movement after the breakout of $3,375: possible targets are $3,390, $3,402.56 and $3,416.39. A breakout below $3,374.91 could send gold to $3,358.25, $3,350.01 and $3,341.18
1H chart analysis: Gold confidently broke through the $3,350 level, opening a bullish scenario, confirmed by macro dynamics and expectations of monetary policy easing

CARV/USDT +200%Since February 2025, has tested a major downtrend line five times, weakening the structure with each touch a classic signal that a breakout is becoming increasingly likely.
Recently listed on Binance Perpetual, CARV just performed a liquidity sweep below the key $0.29 zone, quickly reclaiming it with strong bullish price action bear trap scenario.
The current structure and momentum suggest a parabolic move is brewing, with the potential to rally up to 200% from current levels, once the breakout confirms.

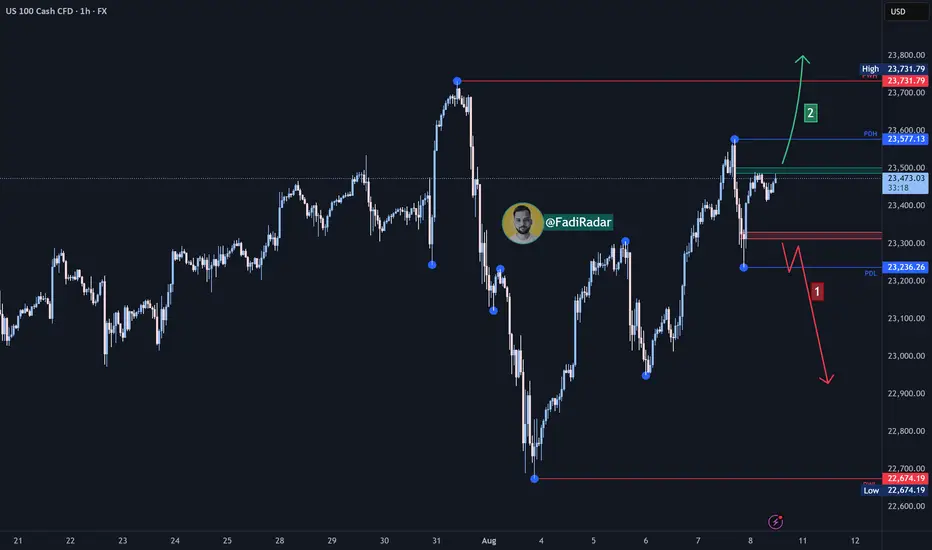
NASDAQ Index (US100 / NASDAQ) Analysis:The NASDAQ index has shown strong bullish momentum recently and is currently trading near a key resistance level at $23,500.
🔻 Bearish Scenario:
If the price fails to break above $23,500 and selling pressure emerges, we could see a downward correction toward $23,310. A break below this level could extend the decline toward $23,000.
🔺 Bullish Scenario:
If the price successfully breaks and holds above $23,500, it could support further upside toward $23,600 as the first target. With continued bullish momentum, the price might reach $23,750.
⚠️ Disclaimer:
This analysis is not financial advice. It is recommended to monitor the markets and carefully analyze the data before making any investment decisions.
AAPL: Update - Key Levels to Watch for Price DevelopmentAAPL: Update - Key Levels to Watch for Price Development
Overall nothing changed and AAPL remains a valuable and strong structure
Apple's stock (AAPL) has been range-bound between $193 and $212.50 for the past two months, repeatedly testing support near $193 on three occasions.
Each time, the price has rebounded strongly, pushing back toward $212.50—the upper boundary of this trading range.
Given this pattern, the likelihood of another move toward $212.50 remains high.
If AAPL successfully breaches $212.50, it could signal a larger bullish breakout, with upside targets at $224.50 and $240, as highlighted in the chart.
You may find more details in the chart!
Thank you and Good Luck!
❤️PS: Please support with a like or comment if you find this analysis useful for your trading day❤️

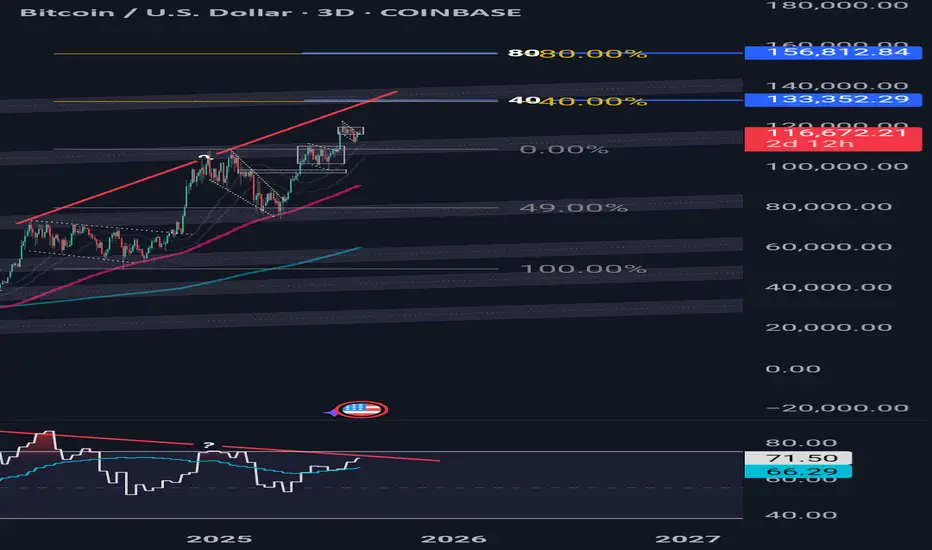
Bitcoin Still Going Strong...For nowBitcoin has been pushing up strongly since the start of the cup & handle in Oct-Nov of 2024.
But Bitcoin is showing weakness, where the bull flags you see on my chart are getting smaller the higher btc goes.
There is also negative divergence showing on my rsi, also signaling signs of weakness.
I do believe we are still bullish for now. But the first area to keep an eye on is between 133k-140k. If Bitcoin gets their I'll start to look for any shorting opportunities.
“Disclaimer: The information provided is NOT financial advice. I am not a financial adviser, accountant or the like. This information is purely from my own due diligence and an expression of my thoughts, my opinions based on my personal experiences, and the way I transact.
DeGRAM | GBPUSD fixed above the resistance level📊 Technical Analysis
● GBPUSD broke above 1.3425 resistance, confirming a breakout from the descending channel and maintaining higher lows within the current rising structure.
● Price action targets the 1.3575 resistance zone, with momentum supported by a clean breakout retest pattern.
💡 Fundamental Analysis
● Weak US ISM services PMI and softer dollar demand enhance GBP upside, while UK GDP beat expectations, signaling resilience in economic activity.
✨ Summary
Long above 1.3425; target 1.3575. Setup remains valid while price holds above 1.3310.
-------------------
Share your opinion in the comments and support the idea with a like. Thanks for your support!

LTC/USD – Momentum Cooling at the Top🔴 SHORT if $121.00 gives way – retrace potential toward $119.50
Litecoin is stalling after rejection near $123.98, with RSI softening from overbought levels. Price remains above the 200 SMA, but failure to hold $121 could trigger a short-term correction before any renewed bullish attempt.
📊 Keywords: #LTCUSD #RejectionZone #CryptoShortSetup #PriceActionWatch

[SeoVereign] ETHEREUM BEARISH Outlook – August 10, 2025In this idea, I would like to present a bearish perspective on Ethereum.
This perspective was derived based on the Elliott Wave Theory.
Until this pattern is confirmed, I have been continuously tracking the Elliott Waves and adding reasons for the bearish scenario one by one.
As a result, I have concluded that the next major move is likely to be downward, and while searching for a specific entry point, I detected the recent trendline break.
If this wave is clearly confirmed, I believe there is a high possibility of a decline to around the average take-profit level of 3763 USDT without much difficulty, and therefore, I am considering entering a short position.
All the details have been drawn on the chart, so please refer to it.
Thank you very much for reading, and as time goes by and the chart becomes clearer, I will continue to update this idea accordingly.
Thank you.

XAUUSD Ascending Channel Run to Supply Trade IdeaGold (XAUUSD) remains in a bullish trend 📈, forming higher highs and higher lows within a well-defined ascending channel ↗️. Price is approaching a recent swing high near resistance 🧱, and I’m watching for a short-term pullback into channel support 🔄 before a potential continuation higher toward the supply zone above 🎯.
This structure aligns with Wyckoff’s markup phase ⚡, where pullbacks serve as tests (LPS) before further upside. As long as price holds above the channel’s lower boundary 🛡️, the bullish bias remains intact — a break below would invalidate the setup ⚠️. Not financial advice.

BTC/USDT Analysis – Continued Growth
Hello everyone! This is the daily update from a CryptoRobotics trader-analyst.
Yesterday, Bitcoin tested the local volume area at $115,800–$114,900 and then continued its upward movement, reaching the lower boundary of the strong resistance zone at $117,600–$118,600 (accumulated volume), followed by a pullback.
Currently, the price is hovering around the volume support zone near ~$116,400. Selling pressure is relatively weak and is being absorbed by buyers — which is confirmed by delta data. This makes it reasonable to expect another wave of buying and a deeper test of the resistance zone. After that, we’ll watch closely for the seller’s reaction.
Buy zones:
• ~$116,400 (local volume support)
• $113,300–$112,700 (local absorption of selling)
• $110,000–$107,000 (accumulated volume)
Sell zone:
• $117,600–$118,600 (accumulated volume)
This publication is not financial advice.

INJ/USDT Setup Live | Bullish Plan to Hit Target @ 16.100🚀 INJECTIVE BREAKOUT RAID: Thief Layers the Grid for the Next Crypto Heist 💣🧠
💼 Asset: INJ/USDT — Injective vs Tether
🧭 Plan: Bullish Grid Strategy
🎯 Target: 16.100
🛑 Stop Loss: 12.500
🔫 Entry: Any Price — We Layer Like Pros
🦹♂️ Yo Market Robbers, Snipers & Grid Lords! 🦹♀️
Injective's about to pay big bags, and the Thief is already inside the system. 🔓
This ain’t no simple play — this is layered entry warfare, the grid strategy special. We ain’t chasing price, we’re setting traps, limit by limit, like silent assassins. 🧊🎯
📊 ENTRY STRATEGY
Thief sets layered limit orders like landmines:
💥 Entry: Any level — let the price come to YOU.
🧱 Grid-style entries with sniper precision. Patience is power.
🛑 STOP LOSS SETUP
Below enemy lines —
🔻 Hard SL @ 12.500 to avoid detection.
🎭 Disappear if the zone gets compromised.
🎯 TARGET ZONE
High-value vault spotted @ 16.100
Get in, loot, and vanish like a shadow in the blockchain. ⛓️💸
📈 WHY THIS RAID WORKS
Market favoring bulls — trend riding 🔥
Liquidity gaps above = potential explosion 💣
Sentiment flipping bullish — Thief smells blood 💉
Layering lets you enter without alerting the guards 🚨
🧠 Thief Wisdom
Don’t chase pumps. Let the market fill your bags passively.
Stay emotionless. Stay planned. Stay funded. 💼📈
💖 Boost the Thief Crew
If this mission blueprint matches your grind, smash the ❤️ Boost, drop a comment, and let’s rob the market together — one clean heist at a time. 🧤🕵️
More plays loading soon. Until then…
Rob Smart. Rob Quiet. Rob Rich. 💰🐱👤

BTC/USDT: Key Levels to Watch Now!Bitcoin remains in a macro bullish structure, but recent price action shows consolidation after breaking through major resistance levels earlier this month. Similar to previous cycles, BTC tends to form short-term ranges after strong rallies before deciding the next move.
Currently, BTC is trading near $116,500–$117,000, just above a key support zone from $115,200 to $114,500. This area aligns with previous breakout levels and the 20 EMA on the 4H chart, making it critical for the short-term trend.
*Bullish Scenario: Holding above $115,200 and breaking $118,600 with strong buying volume could push BTC toward $120,500–$122,000 within days.
*Bearish Scenario: A close below $114,500 could trigger a correction toward $112,800–$111,900. Losing this level may extend the retracement to $110,200 (major demand zone).
Summary:
BTC is consolidating near key support. Past scenarios suggest a breakout above $118,600 could fuel the next bullish leg, but losing $114,500 risks a deeper pullback toward $112,800. The next 2–4 days should define short-term direction.


Bitcoin Go 140kAfter a strong break of the trend line, it is ready to launch to the targets of 125,000, 132,000, and 142,000. The MACD and RSI also gave a bullish signal.
125000
132000
142000
🤪🤪🤪

GBPAUD Reverses from Key Zone – Long Setup in Play!Today I want to share with you a Long position on GBPAUD ( OANDA:GBPAUD ).
GBPAUD started to rise well from the Important Support line , Support zone(2.032 AUD-1.987 AUD) , and Potential Reversal Zone(PRZ) and managed to close the 4-hour candle above 2.053 AUD (important) .
In terms of Elliott wave theory , GBPAUD seems to have completed the main wave 4 . The main wave 4 structure was a Double Three Correction(WXY) .
Also, along the way, we can see a Bullish Marubozu candle , which could indicate a continuation of the uptrend .
I expect GBPAUD to break the Resistance lines soon and attack the Resistance zone(2.078 AUD-2.066 AUD) .
First Target: 2.065 AUD
Second Target: 2.076 AUD
Note: Stop Loss(SL): 2.040 =Worst SL
Please respect each other's ideas and express them politely if you agree or disagree.
British Pound/ Australian Dollar Analyze (GBPAUD), 4-hour time frame.
Be sure to follow the updated ideas.
Do not forget to put a Stop loss for your positions (For every position you want to open).
Please follow your strategy and updates; this is just my Idea, and I will gladly see your ideas in this post.
Please do not forget the ✅' like '✅ button 🙏😊 & Share it with your friends; thanks, and Trade safe.

TradeCityPro | Bitcoin Daily Analysis #148👋 Welcome to TradeCity Pro!
Let’s move on to Bitcoin’s analysis. Yesterday, Bitcoin made an upward move, but now it’s back around the same levels and has essentially faked most of that move. Let’s see what its next move could be.
⏳ 4-Hour Timeframe
Two changes have been made to the chart. First, I turned off the Fibonacci tool because the key levels in this corrective phase have already been identified, so there’s no need to use Fibonacci levels right now.
✔️ The second change is that I moved the Maker Buyer zone slightly higher because I think this placement is more accurate and the price has reacted better to it.
✨ With this updated zone, we can see that yesterday the price reached it, got rejected, and is now moving down.
📊 Volume during this correction has been decreasing, which is a positive sign for buyers. However, RSI faked the 61.67 zone, which isn’t great from a momentum perspective, but since the market doesn’t have a clear trend right now, it’s not very important for us.
💥 In my view, as long as the price stays above 115364, this correction is logical and doesn’t harm the bullish leg. But if the correction deepens, the probability of a drop back to 112233 increases.
💫 Confirmation of a bullish move will come after breaking the current zone. For the start of longer-term bullish legs, the 120041 and 122733 triggers are very important.
⏳ 1-Hour Timeframe
In the 1-hour timeframe yesterday, we could have opened a position using a candle setup, which could have given us a 2:1 risk-to-reward. But if you didn’t take profit, you likely hit the stop-loss by now.
🔔 I personally opened this position on my sub-account, while on my main account, I currently hold long-term Bitcoin positions with wider stops.
📈 At the moment, for opening a new position on Bitcoin, we can enter on a break of 116829. However, I’ll personally wait for the price to test this zone multiple times, form a clear main trigger, and then enter upon its breakout.
🔽 As for shorts, there’s no short trigger as long as Bitcoin is above 115364.
❌ Disclaimer ❌
Trading futures is highly risky and dangerous. If you're not an expert, these triggers may not be suitable for you. You should first learn risk and capital management. You can also use the educational content from this channel.
Finally, these triggers reflect my personal opinions on price action, and the market may move completely against this analysis. So, do your own research before opening any position.

MarketBreakdown | USDJPY, NZDUSD, EURJPY, US100
Here are the updates & outlook for multiple instruments in my watch list.
1️⃣ #USDJPY daily time frame 🇺🇸🇯🇵
The market is trading in uptrend.
After the price updated a high, it retraced.
I see a consolidation now and a formation of a narrow
horizontal trading range.
A bullish breakout of a resistance of the range and a daily
candle close above that will provide a strong trend-following bullish signal.
An uptrend will most likely resume then.
2️⃣ #NZDUSD daily time frame 🇳🇿🇺🇸
A test of a historically significant major demand cluster triggered a strong
bullish reaction. The price violated a strong resistance and closed above that.
I think that the market will most likely continue growing.
3️⃣ #EURJPY daily time frame 🇪🇺🇯🇵
The pair is trading within a horizontal parallel channel.
With the absence of high impact fundamental news today,
I think that the market will most likely continue consolidating
and the price may retrace from the resistance.
4️⃣ #NASDAQ Index #US100 daily time frame 🇺🇸🇨🇭
Looks like the market is preparing to update the ATH.
A confirmed violation of a minor daily resistance and a valid
Change of Character on intraday time frames indicate clear
strength of the buyers.
I guess that 23700 level will be tested soon with its highly probable breakout.
Do you agree with my market breakdown?
❤️Please, support my work with like, thank you!❤️
I am part of Trade Nation's Influencer program and receive a monthly fee for using their TradingView charts in my analysis.

US CRUDE OIL(WTI): Important Breakout📉USOIL has fallen and closed below a significant daily support level,
which has now become a strong resistance.
I anticipate a downward trend towards the support level at 60.76.

XAGUSD H4 | Bullish bounce off 38.2% Fibonacci support?Based on the H4 chart analysis, we could see the price fall to the buy entry which is a pullback support that aligns with the 38.2% Fibonacci retracement and could bounce from this level to the upside.
Buy entry is at 37.67, which is a pullback support that lines up with the 38.2% Fibonacci retracement.
Stop loss is at 36.89, which is a pullback support.
Take profit is at 39.39, which is a swing high resistance.
High Risk Investment Warning
Trading Forex/CFDs on margin carries a high level of risk and may not be suitable for all investors. Leverage can work against you.
Stratos Markets Limited (tradu.com ):
CFDs are complex instruments and come with a high risk of losing money rapidly due to leverage. 65% of retail investor accounts lose money when trading CFDs with this provider. You should consider whether you understand how CFDs work and whether you can afford to take the high risk of losing your money.
Stratos Europe Ltd (tradu.com ):
CFDs are complex instruments and come with a high risk of losing money rapidly due to leverage. 66% of retail investor accounts lose money when trading CFDs with this provider. You should consider whether you understand how CFDs work and whether you can afford to take the high risk of losing your money.
Stratos Global LLC (tradu.com ):
Losses can exceed deposits.
Please be advised that the information presented on TradingView is provided to Tradu (‘Company’, ‘we’) by a third-party provider (‘TFA Global Pte Ltd’). Please be reminded that you are solely responsible for the trading decisions on your account. There is a very high degree of risk involved in trading. Any information and/or content is intended entirely for research, educational and informational purposes only and does not constitute investment or consultation advice or investment strategy. The information is not tailored to the investment needs of any specific person and therefore does not involve a consideration of any of the investment objectives, financial situation or needs of any viewer that may receive it. Kindly also note that past performance is not a reliable indicator of future results. Actual results may differ materially from those anticipated in forward-looking or past performance statements. We assume no liability as to the accuracy or completeness of any of the information and/or content provided herein and the Company cannot be held responsible for any omission, mistake nor for any loss or damage including without limitation to any loss of profit which may arise from reliance on any information supplied by TFA Global Pte Ltd.
The speaker(s) is neither an employee, agent nor representative of Tradu and is therefore acting independently. The opinions given are their own, constitute general market commentary, and do not constitute the opinion or advice of Tradu or any form of personal or investment advice. Tradu neither endorses nor guarantees offerings of third-party speakers, nor is Tradu responsible for the content, veracity or opinions of third-party speakers, presenters or participants.

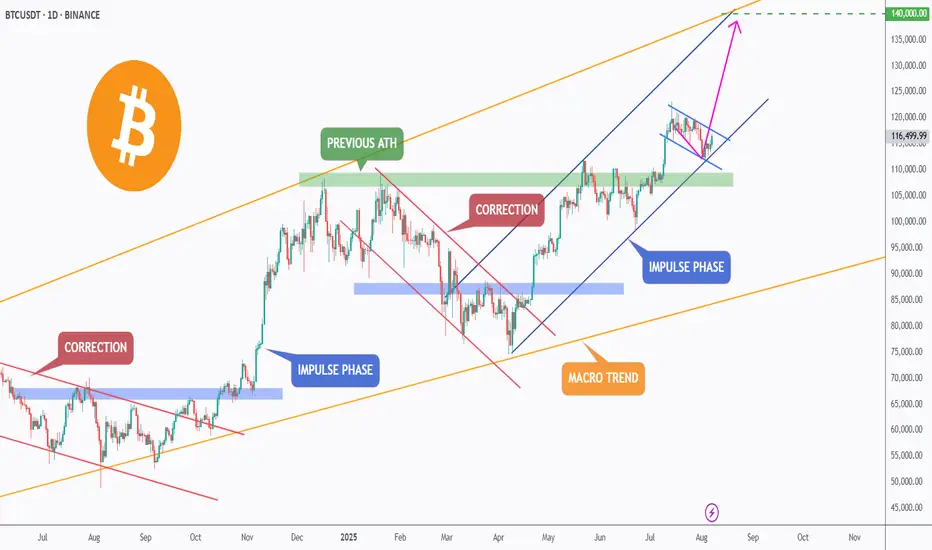
BTC – Breakout Loading?Bitcoin continues to respect its macro bullish trend (🟠), trading within a large ascending channel that has guided price action for over a year.
After breaking above the previous ATH 🟢, BTC entered a correction phase 🔻, retesting the green zone — a key structure now acting as support.
The bulls stepped back in, initiating a new impulse phase 🔵. Currently, BTC is consolidating within a small blue descending channel — forming a classic bullish flag 🏁 pattern.
⚠️ For the bulls to take over and trigger the next impulsive wave toward $140,000 🎯, we need to see a confirmed break above this small blue channel. This would signal trend continuation and open the door to the upper boundary of the macro channel.
✅ Key levels to watch:
- Support: ~$110,000 (green demand zone) 🟩
- Resistance: Top of the blue flag 🟦
- Target: $140,000 💰
A breakout from here could fuel the next major rally — stay sharp and follow the trend!
💬 What’s your bias here? Are you bullish or waiting for a deeper pullback?
📚 Always follow your trading plan regarding entry, risk management, and trade management.
Good luck!
All Strategies Are Good; If Managed Properly!
~Richard Nasr