BTC get out while you still can!I've been warning people about this for weeks. History doesn't repeat itself, but it certainly rhymes. BTC had a double tope and the 50 / 200SMA show cooling and both showing clearly that it's moving one direction and it's not up. Gravity with this one is strong (historically) and so is the volatility. Crypto bros will go back to eating beans and rice!
MSTZ and BTCZ could be good plays here....best of luck and always do your own due diligence!
Community ideas

Bitcoin Dip Coming Soon1. Historical Example (Left Side of the Chart - around 2021-2022):
"NFT" Label at the Top: The trader has labeled a peak around late 2021 with "NFT." This likely signifies a period of market euphoria or a local top, possibly correlated with a peak in NFT hype.
Failure to Make New Highs / Bearish Structure: After this peak, the price action shows lower highs and lower lows, indicating a downtrend.
Break of Support: The price broke down from a previous support area.
Targeting Previous Demand: The arrow points down towards a shaded maroon box. This box represents a significant area of previous demand/support FVG (roughly $15,000 - $30,000 in this hypothetical chart) where buyers previously stepped in, or where price consolidated before a major move up. The expectation was that price would revisit this significant prior zone.
2. Current/Projected Scenario (Right Side of the Chart - 2025 onwards):
"NFT" Label at the Current Top: Again, an "NFT" label is placed near the recent high (around
105,000 − 105,000− 110,000 in this chart). This suggests the market is again at a euphoric peak or a significant local top.
Potential Double Top / Rejection: The price has made a significant high and seems to be struggling to push further, showing signs of rejection (as indicated by the recent candles with upper wicks and a potential downturn). This could be forming a double top or a lower high relative to the absolute peak.
Two-Stage Short Target:
First Target (Short Arrow): The shorter arrow points down to a horizontal line around the $75,000 - $80,000 level. This is likely a near-term support level, perhaps a previous swing low or an area of recent consolidation. A break below the current highs might lead to a test of this level.
Second, Larger Target (Long Arrow): The longer arrow points down to a much larger shaded maroon box. This box (roughly $30,000 - $40,000 in this chart) represents a significant, longer-term demand/support zone. This zone was a major area of consolidation or previous resistance that turned into support before the most recent leg up to the $100k+ levels.
Rationale for the Deeper Target: If the near-term support (around 75k−75k−80k) fails to hold, the trader expects a more significant correction.

APPLE The Target Is DOWN! SELL!
My dear friends,
APPLE looks like it will make a good move, and here are the details:
The market is trading on 200.92 pivot level.
Bias - Bearish
Technical Indicators: Supper Trend generates a clear short signal while Pivot Point HL is currently determining the overall Bearish trend of the market.
Goal - 198.42
About Used Indicators:
Pivot points are a great way to identify areas of support and resistance, but they work best when combined with other kinds of technical analysis
Disclosure: I am part of Trade Nation's Influencer program and receive a monthly fee for using their TradingView charts in my analysis.
———————————
WISH YOU ALL LUCK

EUR/USD analysis and pending orderTwo days ago, there was a FED meeting, where it was stated that the benchmark interest rate will be kept at 4.25-4.50% level.
What is important is what they told - the expectations - economicp rojections are lower, and inflation is higher.
Maybe they’ll decrease rates in future?
Right now, it’s not so important. It’s summer already, and by the old “Sell in May, and go aways” mentality, I don’t expect some huge impact on the market.
I know… Iran, Israel, Trump, maybe even Putin? Anybody can do some stupit stuff and everything can go to Hell.
And it’s Friday, not very smart time to open trades, so I’m putting pending order.
I decided for EUR/USD.
Timeframe is 4h.
On my chart I can see clear uptrend in the last couple of weeks, especially in the last 3 months.
Also, I see lower highs.
Upward trend is breached… Where it could stop?
Overall, I don’t expect the pair will come near parity, even though ECB lowered rates before FED did.
But some “selloff”, probably.
I used good old Fibonacci, draw it, and the price could potentialy drop to 50% level or even ideal 61…8%-78.6% zone.
Pending entry: 1.15577
TP: 1.12645
SL: 1.1671
If it activates today, I’ll leave it over the weekend.

Precise short orders in 3370-3375 area are launched!Gold has been volatile recently, with intraday fluctuations ranging from 1 to 200 US dollars, which greatly increases the difficulty of operation for retail investors. On the surface, there are many opportunities, but there are only a few real big market opportunities. If you miss the rhythm, you can only watch your funds shrink. Remember that risk management is crucial.
From the 4-hour analysis of gold, there are repeated resistances from bulls before the downward break; once it breaks down, the market will go further down, and the focus below is 3340. The upper short-term is 3370-3380, and the important resistance is 3400. Only by breaking through the bulls can the rebound continue. In terms of operation, sell high and buy low, and pay attention to the breakthrough!
There are too many long orders accumulated at the current high level of gold, and the market will not rise sharply easily. The current international situation is so tense, and gold is still slowly declining. In this situation, it is difficult to rebound sharply.
Operational suggestions: For short orders above, focus on the layout of the 3370-3375 area, strictly set a stop loss, target more than 20 points, control risks, and follow the trend.

BTC is stuck in a tightening triangle — compression phaseVolatility building up into June 18–19.
Expect a big breakout.
Main scenario: breakout to the upside with a “God Candle” and new momentum for altcoins after prolonged BTC dominance.
Alts have been suppressed, but that’s part of the setup — don’t get tricked by the fake moves.
Stay patient, don’t lose focus, and be ready for a sharp move!

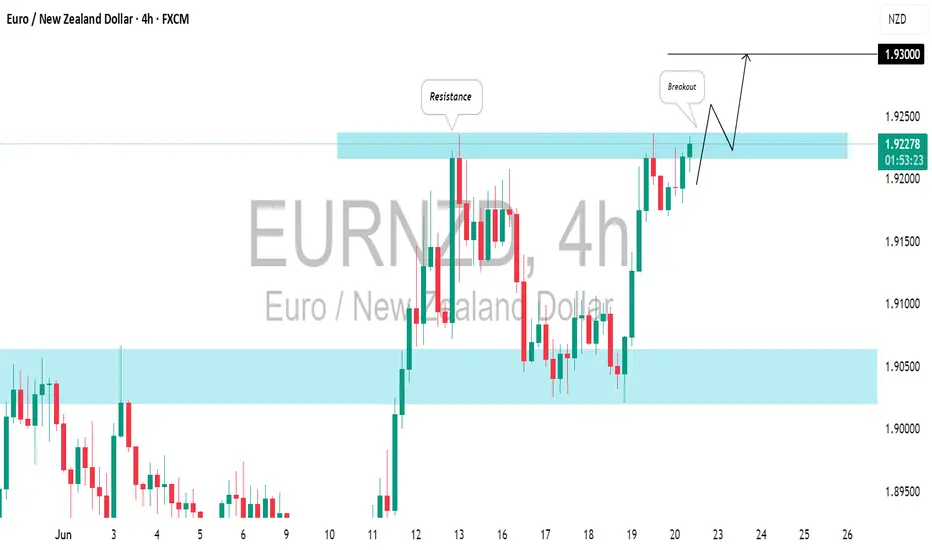
EUR/NZD Daily AnalysisAs we can see, price was printing lower highs from mid April this year, and at the same time, was getting squeezed into the 1.8850 level.
With the buyers defending 1.8850 successfully, it was just a matter of time before either resistance or support was breached.
In June we saw a break to the upside and the trendline tested for several days before buyers took price higher than it's been in over a month.
If you agree with this analysis, look for buys setups that meet your strategy rules.

$mamo idea - IDK, just ideatingNASDAQ:MAMO has been free falling since it hit its ATH. I'm wondering if it's going to find support? Not sure - I haven't looked at any other patterns. I'll do that and update this at some point.

EURNZD: Waiting For Another BreakoutBased on the current trend, I believe you would concur that ⚠️EURNZD is likely to keep rising.
A bullish breakout above the highlighted blue resistance and a 4H candle closing above 1.9240 would
serve as a key confirmation, potentially driving prices up to 1.9300.
Could the Gold bounce from here?The price is falling towards the pivot which acts as a pullback support and could bounce from this level to the 1st resistance which is also a pullback resistance.
Pivot: 3,337.35
1st Support: 3,294.91
1st Resistance: 3,413.32
Risk Warning:
Trading Forex and CFDs carries a high level of risk to your capital and you should only trade with money you can afford to lose. Trading Forex and CFDs may not be suitable for all investors, so please ensure that you fully understand the risks involved and seek independent advice if necessary.
Disclaimer:
The above opinions given constitute general market commentary, and do not constitute the opinion or advice of IC Markets or any form of personal or investment advice.
Any opinions, news, research, analyses, prices, other information, or links to third-party sites contained on this website are provided on an "as-is" basis, are intended only to be informative, is not an advice nor a recommendation, nor research, or a record of our trading prices, or an offer of, or solicitation for a transaction in any financial instrument and thus should not be treated as such. The information provided does not involve any specific investment objectives, financial situation and needs of any specific person who may receive it. Please be aware, that past performance is not a reliable indicator of future performance and/or results. Past Performance or Forward-looking scenarios based upon the reasonable beliefs of the third-party provider are not a guarantee of future performance. Actual results may differ materially from those anticipated in forward-looking or past performance statements. IC Markets makes no representation or warranty and assumes no liability as to the accuracy or completeness of the information provided, nor any loss arising from any investment based on a recommendation, forecast or any information supplied by any third-party.

EURNZD: Bearish Move From Resistance 🇪🇺🇳🇿
EURNZD is going to retrace from a strong daily resistance cluster.
As a confirmation signal, I see a bearish breakout of a support line
of a rising wedge pattern on an hourly time frame.
Goal - 1.9144
❤️Please, support my work with like, thank you!❤️
I am part of Trade Nation's Influencer program and receive a monthly fee for using their TradingView charts in my analysis.

Ripple (XRP): Seeing Smaller Bullish Movement To AccumilateRipple coin has extended itself heavily since november but what we noticed is how close the 200EMA line on the daily timeframe has come to the market price, which is our main point of interest as of now.
More in-depth info is in the video—enjoy!
Swallow Academy

#BTC URGENT UDPATE Plus ALTCOINS Strategy.CRYPTOCAP:BTC UPDATE:
Bitcoin looks critical at the moment. The 50 EMA supports nearly $103K if this level breaks, we could see a drop toward $98.5K.
The current structure doesn’t look promising, and it’s wise to stay on the sidelines for now.
Altcoins may offer better opportunities once those lower levels are reached.
The strategy is to ladder in slowly when there are signs of reversal, until then we stay put!
Remember: nothing goes up forever, and nothing goes down forever.
Geopolitical tensions might be fueling this move, but I believe better days are ahead.
Stay patient.
Avoid high-leverage trades during this choppy, sideways price action.
Stay tuned, I’ll keep you updated the moment signs of a reversal appear.
Let me know what you think in the comment section and hit that like button if this post helped you in any way.
Thank you
#PEACE

The Midyear Mindset Reset: Reboot Your Trading Before Q3Because nothing says "trader growth" like admitting you’ve been winging it for six months.
👋 Welcome to Halftime — How’s Your P&L Looking?
June’s closing bell isn’t just a date on the calendar — it’s that awkward moment where traders stare into the middle distance, coffee in hand, and quietly whisper: “Well… that went differently than I expected.”
Whether you’ve been racking up wins, nursing drawdowns, or simply surviving market whiplash, midyear is nature’s way of handing you a clean slate. Before Q3 throws its inevitable curveballs, now’s your chance to pause, reset, and actually look at what the heck you’ve been doing. And, of course, prepare for the next batch of earnings reports .
Spoiler: if your trading strategy this year has involved equal parts hope and caffeine, you’re not alone.
🔥 The Year So Far: Markets Kept It… Interesting
Let’s quickly recap 2025 so far (because trauma processing is healthy).
The Magnificent Seven? More like the Magnificent Two-And-A-Half. Meta NASDAQ:META and Microsoft NASDAQ:MSFT ran victory laps while everyone else tripped over AI headlines or regulatory landmines.
Nvidia NASDAQ:NVDA moonwalked into trillion-dollar territory, then stumbled after export bans — but somehow still has every fund manager whispering “Blackwell” like it’s a secret password.
Bitcoin BITSTAMP:BTCUSD set new highs north of $110K (who needs fiat when you can have memes?).
The Fed teased cuts, inflation teased persistence, and Trump teased… well, everyone.
And summer trading arrived with its usual low-volume traps, giving us breakouts that break hearts and liquidity that disappears faster than your broker’s customer support.
In short: volatility? Check. Opportunity? Absolutely. Discipline? That depends on whether you’re still following your rules or trading on vibes.
By June, most traders have crafted elaborate narratives in their heads. You know the type: "This breakout is different," "The Fed has to cut next month," and "There’s no way Nvidia can keep running like this."
The problem is, markets don’t care about your narrative. They care about price, volume, sentiment — and sometimes, absolute chaos. That beautifully clean chart setup? It’s not asking for your prediction. It’s begging you to respond with discipline, not bravado.
The traders who thrived in the first half didn’t win by forecasting every twist in the macro plotline. They won by following the tape. The breakout happened? They took it. The stop-loss hit? They respected it. That’s not luck — that’s execution.
🫶🏻 Emotional Capital: The Real Balance You Should Be Watching
P&L tells one story. Emotional capital tells another.
By June, a lot of traders aren’t out of money — they’re out of discipline. They’ve been revenge trading after a string of losses, chasing AI headlines that already ran, and convincing themselves they can “make it all back” on the next oversized position.
Do you know that feeling?
Resetting your trading mindset at midyear means recalibrating that emotional bankroll. Start by reviewing your trading journal (yes, you’re supposed to have one ). Revisit the trades that made sense and the ones that make you cringe. Recognize your patterns — your strengths, but also your weaknesses. Success leaves clues and there are lessons in failures.
💭 Clean Up the Clutter
There’s a special type of fatigue that sets in after six months of consuming too much trading content. You start layering on indicators like toppings at a frozen yogurt bar — RSI, MACD, Stochastics, VWAP, Fibonacci, Elliott Waves, Gann fans... until your charts light up like the billboards in Times Square.
The truth is, the best traders heading into Q3 are simplifying. They’re not chasing complexity; they’re chasing clarity. They know their setups, they trust their process, and they wait for clean signals.
Summer trading especially demands this discipline. Liquidity gets thinner, breakouts fail more often , and the tape gets choppy.
Complex systems may amplify the noise. Strip it down. Focus on price structure. Simplify your strategy so you can execute when real opportunities appear — not when your 12th oscillator blinks green.
⚾ You Don’t Need a Home Run
At this stage of the year, many traders fall into what we’ll call the desperate hero phase. They feel behind. They want to make up for drawdowns. They want “the trade” that fixes everything. If you’ve missed making bank over the first half of the year, chances are, you want to catch up — and fast.
Here’s a secret: The best traders aren’t always looking for grand slams. They’re playing small ball too — consistent singles, tight risk, controlled losses, steady gains.
Q3 isn’t about doubling your account. It’s about staying alive long enough for your edge to show up and play out. The traders who make it to year-end consistently profitable aren’t the ones chasing massive wins. They’re the ones compounding quiet, boring, disciplined trades.
Midyear Reset: Your Q3 Trading Checklist
Here’s your brutally simple plan for the back half:
✅ Journal your biggest mistakes from H1
✅ Cut your watchlist in half
✅ Size smaller than feels exciting
✅ Trust clean setups over crowded trades
✅ Stay curious — but stay selective
✅ Leave the FOMO trades to the TikTok influencers
So the real question heading into Q3 isn’t whether markets will go up or down. It’s whether you will trade better or keep winging it.
Happy midyear reset. Trade smarter, not harder.

Bearish reversal?The Kiwi (NZD/USD) is rising towards the pivot and could reverse to the pullback support.
Pivot: 0.6036
1st Support: 0.5965
1st Resistance: 0.6080
Risk Warning:
Trading Forex and CFDs carries a high level of risk to your capital and you should only trade with money you can afford to lose. Trading Forex and CFDs may not be suitable for all investors, so please ensure that you fully understand the risks involved and seek independent advice if necessary.
Disclaimer:
The above opinions given constitute general market commentary, and do not constitute the opinion or advice of IC Markets or any form of personal or investment advice.
Any opinions, news, research, analyses, prices, other information, or links to third-party sites contained on this website are provided on an "as-is" basis, are intended only to be informative, is not an advice nor a recommendation, nor research, or a record of our trading prices, or an offer of, or solicitation for a transaction in any financial instrument and thus should not be treated as such. The information provided does not involve any specific investment objectives, financial situation and needs of any specific person who may receive it. Please be aware, that past performance is not a reliable indicator of future performance and/or results. Past Performance or Forward-looking scenarios based upon the reasonable beliefs of the third-party provider are not a guarantee of future performance. Actual results may differ materially from those anticipated in forward-looking or past performance statements. IC Markets makes no representation or warranty and assumes no liability as to the accuracy or completeness of the information provided, nor any loss arising from any investment based on a recommendation, forecast or any information supplied by any third-party.

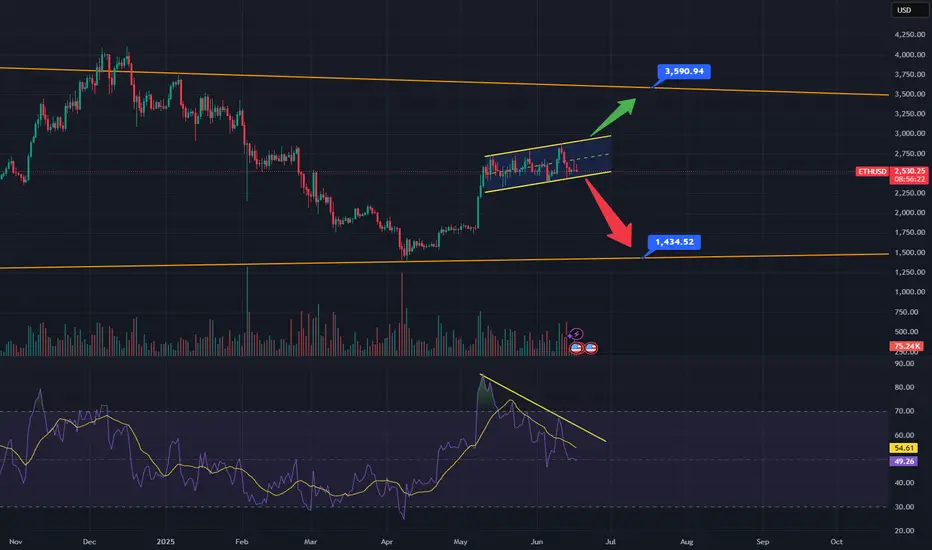
ETH: Breakout or Breakdown?As you can see ETH has been trading inside of this rising channel since the beginning of May. Rising channels favor a break to the downside, I've also highlighted some bearish divergence on the RSI which also points to a move down. The orange lines are long term weekly trend lines. The bottom orange line connects the 2022 lows through to the April lows, if price breaks down, expect a retest of the underside of the channel before moving down to the orange line around $1435. This would only be the third hit and third hits rarely breakdown. If it defies logic and breaks out above, look for it to move up to the top orange line around $3600, which connects the 2021 bull market highs through the march 24', May 24' and December 24' highs. If it comes into this area, it would be a 5th hit of a major weekly trendline, 5th hits have a very high probability of breaking out to the upside, if this happens it would be very bullish. In this scenario I would expect ETH to come down and test the top of said trendline as support before moving to new all-time highs. A Fibonacci retracement from the 2020 lows to the 2021 highs would put new price targets at $6,670 at the -0.382 as well as $7,800 at the -0.618.
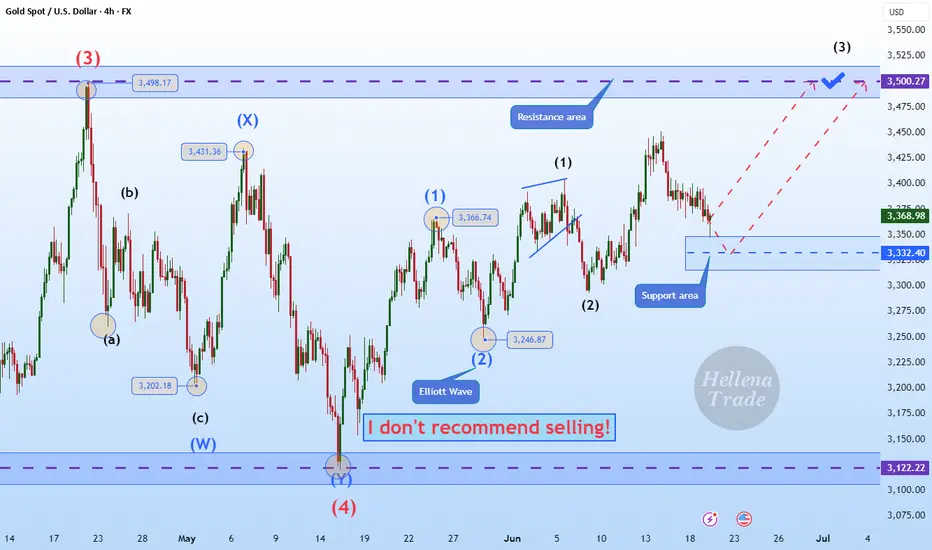
Hellena | GOLD (4H): LONG to resistance area of 3500 (Wave 3).Colleagues, the correction did take place and was quite deep, as I wrote earlier.
However, I am leaving my target unchanged—the resistance area and the maximum of wave “3” of the higher order at 3500.
The waves remain in their previous places, because none of the rules of wave analysis have been violated.
Manage your capital correctly and competently! Only enter trades based on reliable patterns!
$XRPUSDT 6h Chart. $XRP/USDT 6H chart shows a clean breakout above the descending trendline, followed by a successful retest at the key demand zone.
This confluence suggests bullish momentum is building up.
As long as price holds above the $2.1023 support, the setup points toward a potential 17% upside move targeting the $2.4873–$2.5035 range.
DYRO, NFA

UPDATE ON AERO SHORTS ,Perfect short area $0.95-0.98UPDATE ON AERO SHORTS
Perfect short area $0.95-0.98
Still targeting $0.77 or Down
Look like dumping time soon
Right now at $0.95
Not a Financial advice

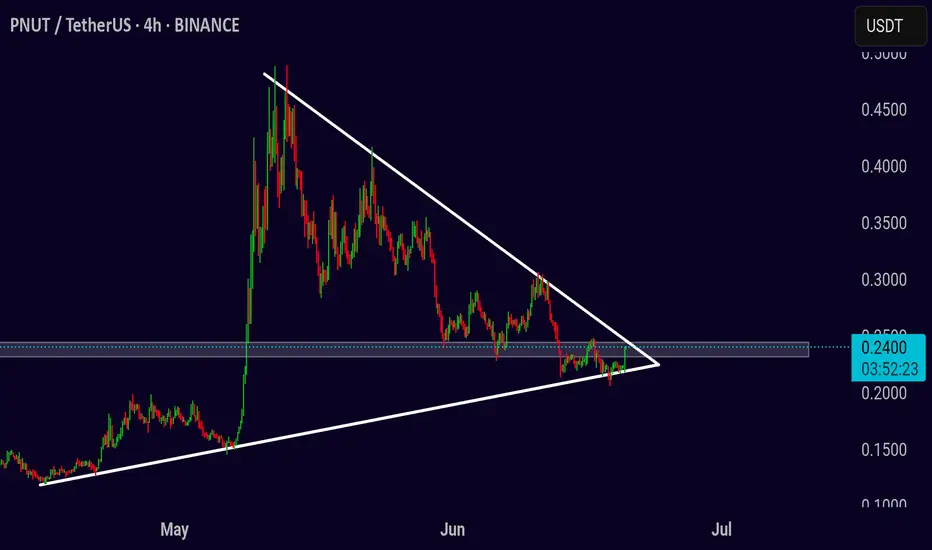
PNUT/USDT – Breakout Watch from Symmetrical TrianglePNUT/USDT – Breakout Watch from Symmetrical Triangle
Chart pattern: Symmetrical Triangle
Timeframe: 4-Hour
Published: June 20, 2025
PNUT/USDT is nearing the apex of a symmetrical triangle that has been forming over several weeks. The price is tightening between rising support and descending resistance, indicating a breakout is likely approaching soon.
Price is currently testing the upper boundary near 0.24. A breakout from this level with strong volume may trigger a bullish move, while rejection could keep price inside the range a little longer.
Bullish scenario
Entry: 4H close above 0.245 with volume
Target 1: 0.28
Target 2: 0.33
Stop-loss: Below 0.22
Bearish scenario
Entry: Break below 0.215
Target 1: 0.18
Target 2: 0.14
Stop-loss: Above 0.24
Wait for confirmation before acting — momentum will likely follow once the triangle breaks.
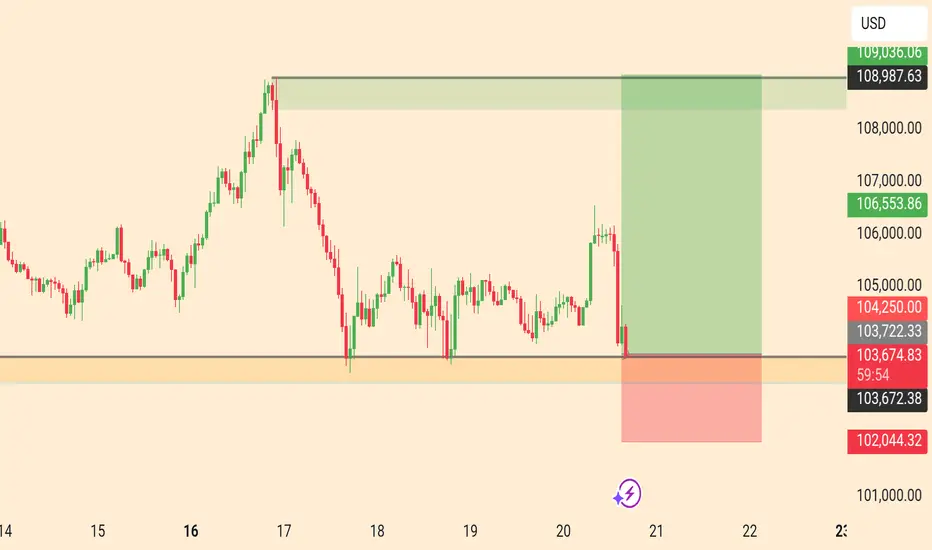
BTCUSD MOVES H1 ANNALSIS OUTLOOK BULLISH 20/6/2025buy 10.3700
others limit 10.3300
Take profit 10.4200
take profit 10.4800
take profit 10.5500
stop los 10.2500
Lingrid | GBPCAD Bearish Opportunity at Confluence ZoneFX:GBPCAD is rebounding from the bottom of its support zone, forming a rounded recovery toward a confluence of resistance levels near 1.8507. Price is nearing the intersection of a downtrend line and a horizontal key level, creating a high-risk rejection zone. A failure to break above this confluence could initiate a bearish swing toward 1.8430 or lower.
📈 Key Levels
Buy zone: 1.8430–1.8460
Sell trigger: bearish rejection at 1.8507
Target: 1.8305
Buy trigger: strong close above 1.8576
💡 Risks
Breaking 1.8507 could lead to extended upside
Economic news or CAD volatility may disrupt pattern
Price may stall in the resistance cluster before choosing direction
Traders, if you liked this idea or if you have your own opinion about it, write in the comments. I will be glad 👩💻

Gold (XAU/USD) Technical Analysis – Bearish Breakdown in Play📉 Gold (XAU/USD) Technical Analysis – Bearish Breakdown in Play | June 20, 2025 🟡
🕒 Timeframe: 4-Hour
📍 Asset: Gold Spot / U.S. Dollar (XAU/USD)
🖼️ Chart Source: TradingView by AngelaFxTrading
🔍 Chart Overview
The 4H chart displays a clear bearish breakdown from an ascending trendline (blue), followed by a rejection at a key horizontal resistance zone (highlighted in purple).
🧠 Key Technical Insights
📌 1. Resistance Zone Rejection
Price Level: ~$3,370 - $3,390
Price attempted multiple breakouts above the resistance zone but consistently failed, indicating strong seller presence. The red arrow marks a lower high, suggesting waning bullish momentum.
📈 2. Trendline Break
The rising blue trendline has been decisively broken. This signals a potential trend reversal from bullish to bearish.
🧭 3. Support Levels to Watch
Minor Support: $3,294.43 (short-term reaction zone)
Major Support: $3,244.87 (target of the projected drop)
🔮 4. Bearish Projection
Blue arrows indicate a measured move expectation, targeting the $3,244.87 level.
A bearish flag/pennant formation post-break suggests continuation lower.
⚠️ Key Considerations
Fundamentals: Note the icons at the bottom — upcoming USD-related news/events 📅 could inject volatility.
Confirmation: For bears, a clean rejection from the resistance retest would confirm entry zones.
🧭 Trading Bias:
🔻 Short-term Bearish
As long as price remains below the purple resistance and under the broken trendline, selling pressure dominates.
🛑 Invalidation Zone
A daily close above ~$3,390 would invalidate this bearish setup and suggest a return to bullish momentum.
