GOLD ROUTE MAP UPDATEHey Everyone,
Another PIPTASTIC day on the charts for us with our 1H chart playing out as analysed with our final target completed today.
After completing 3593, 3613 and then 3638, we stated that we would now look for ema5 cross and lock above 3638 to open 3658. We got the lock and confirmation followed with the target hit - PERFECTION!!
We are now seeing rejection on this level and will use the lower Goldturns for support and bounce. If the range above opens further please review our daily chart and weekly chart updates with higher range levels to continue to track the movement until we update a new 1h chart.
We will continue to buy dips using our support levels taking 20 to 40 pips. As stated before each of our level structures give 20 to 40 pip bounces, which is enough for a nice entry and exit. If you back test the levels we shared every week for the past 24 months, you can see how effectively they were used to trade with or against short/mid term swings and trends.
The swing range give bigger bounces then our weighted levels that's the difference between weighted levels and swing ranges.
BULLISH TARGET
3593 - DONE
EMA5 CROSS AND LOCK ABOVE 3593 WILL OPEN THE FOLLOWING BULLISH TARGETS
3613 - DONE
EMA5 CROSS AND LOCK ABOVE 3613 WILL OPEN THE FOLLOWING BULLISH TARGET
3638 - DONE
EMA5 CROSS AND LOCK ABOVE 3638 WILL OPEN THE FOLLOWING BULLISH TARGET
3658 - DONE
BEARISH TARGETS
3562
EMA5 CROSS AND LOCK BELOW 3562 WILL OPEN THE FOLLOWING BEARISH TARGET
3528
EMA5 CROSS AND LOCK BELOW 3528 WILL OPEN THE SWING RANGE
3492
3470
EMA5 CROSS AND LOCK BELOW 3470 WILL OPEN THE SECONDARY SWING RANGE
3438
3408
As always, we will keep you all updated with regular updates throughout the week and how we manage the active ideas and setups. Thank you all for your likes, comments and follows, we really appreciate it!
Mr Gold
GoldViewFX
Community ideas

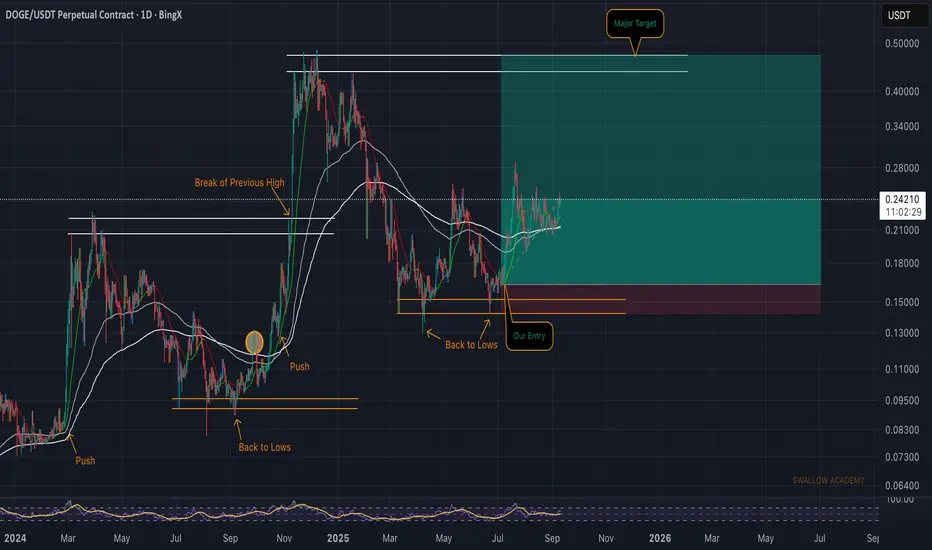
Dogecoin (DOGE): About To Go ParabolicWe’ve been onto CRYPTOCAP:DOGE for quite some time now, and since our last update, the price has given us a solid bounce, securing the EMAs along the way.
From here, the path is clear—we only have one way, and it’s up. The major target remains locked at the higher zone, where we expect the next strong reaction.
Swallow Academy
EURJPY: Test of Critical Demand Zone 🇪🇺🇯🇵
EURJPY is stuck on a major daily horizontal demand zone.
A recent breakout of a resistance line of a falling parallel channel
on an hourly time frame indicates an intraday strength of the buyers.
I will expect a pullback at least to 173.0 level.
❤️Please, support my work with like, thank you!❤️
I am part of Trade Nation's Influencer program and receive a monthly fee for using their TradingView charts in my analysis.

Gold continues to rise, setting new record highs.Gold continues to rise, setting new record highs. The market is currently consolidating, but the overall structure remains bullish. The rally has been supported by a weaker U.S. dollar and growing expectations of aggressive Fed policy easing.
However, the overbought conditions and potential profit-taking could limit further upside in the short term. At this stage, gold is consolidating, and the fundamental background remains stable. Since market-moving news is difficult to predict in advance, traders should closely watch technical levels.
Support Area Price may retest lower support zones before resuming its uptrend The next possible upside target is around 3675.
You any find more details in the chart.
Trade wisely best of Luck Buddies.
Ps; Support with like and comments for better analysis.

EUR/AUD Long positionBased on the price action and the divergences given by the RSI i believe that this currency will have a push up. COT data also support this idea with EUR being 65.26% long in positions and AUD 79.11% short in positions. This is only an idea and not advice.

PROMPTUSDT Accumulation Leading to Major BreakoutPROMPTUSDT has been consolidating within a clear accumulation zone, and the recent breakout from the descending falling wedge structure signals the possibility of a strong bullish reversal.
The accumulation zone offers a good buying opportunity with invalidation clearly defined below the zone. As long as this level continues to hold, the bullish plan remains valid.
Immediate profit targets are placed around $0.3983, while the extended move points towards $0.8036, with the final setup target projected near $1.4404. A rally of this magnitude would confirm the completion of the accumulation phase and open the door for a new bullish cycle.
Failure of the accumulation zone to hold, however, could trigger further downside risk making risk management key at this stage.
What’s your outlook on PROMPT do you believe this accumulation will fuel the next major breakout?

BTC bullish, targeting $115K and $120KWhat I have here is a series of fib fans and a fib retracement. You can see we hit the 61.8 and 50% retraces (red arrows), perfectly. There is a confluence of targets above. Momentum is supportive.

TradeCityPro | Bitcoin Daily Analysis #174👋 Welcome to TradeCity Pro!
Let’s dive into Bitcoin analysis. Today the U.S. inflation data was released, so let’s see how it impacted the market.
⌛️ 4-Hour Timeframe
Earlier today, the PPI index came in favorably for the market, and Bitcoin responded with an upward move following the news.
🔔 Yesterday, however, we saw some unusual global events. Israel carried out a military strike in Qatar, and at the same time, Nepal’s government collapsed following a popular revolution.
✨ These developments were negative for risk assets like Bitcoin, and as a result, the price was rejected from its resistance zone.
✔️ That said, news like this usually impacts markets only temporarily. Today, Bitcoin once again found support at the trendline and pushed higher with strong volume back into the key zone.
📊 Volume has risen significantly, and with today’s bullish PPI release, the current candle is closing above the resistance area.
💥 At the same time, the RSI is breaking through the 64.92 level, which greatly increases the likelihood of Bitcoin starting its next bullish leg. So if you’re already holding a long position, it’s worth keeping it open—there are no clear signs of weakness in the trend yet, and the market still has room to move upward.
🧩 If you don’t have a position open, you can look for entries on lower timeframes once resistance breaks. However, keep in mind that I personally already opened my positions with earlier triggers, and any new triggers appearing today come with higher risk.
❌ Disclaimer ❌
Trading futures is highly risky and dangerous. If you're not an expert, these triggers may not be suitable for you. You should first learn risk and capital management. You can also use the educational content from this channel.
Finally, these triggers reflect my personal opinions on price action, and the market may move completely against this analysis. So, do your own research before opening any position.

DOT - Confirmed!DOT Technical Outlook
On the weekly timeframe, DOT has confirmed a breakout from its long-term downtrend, followed by a successful retest. This establishes a solid technical foundation, with confluence now forming between the weekly and daily structures.
On the daily chart, price action has moved decisively above the previous bearish zone, signaling renewed momentum. In the short term, the key resistance levels to monitor are $5, $6, and $8. A sustained breakout above these thresholds would provide confirmation for a broader bullish scenario.
From a technical perspective, the upward trend has been validated. The next catalyst for continuation will likely come from upcoming market developments and potential positive news flow, which could act as triggers to remove remaining resistance barriers.
Overall, the technical setup suggests that DOT is positioned for further upside, with a constructive outlook in the near to medium term.

Bitcoin - Head and Shoulders to 115k - then dump below 105k!Bitcoin is currently corming a bullish reversal head and shoulders pattern! The price is curently near the right shoulder providing us with a great buying opportunity. What is the profit target? This is a very special situation, because we have an unfilled FVG (Fair Value GAP) right above the HaS neckline. I belieave the price could breakout this HaS pattern, but will get stopped by the GAP or by the major swing high above the GAP. A lot of traders have their stop loss orders above this major swing high, so this is where the whales can take liquidity and send it down.
After that, we may see a huge dump because it's September and it's statistically the worst performing month for Bitcoin and also for the stock market. This is my short term update on the price of Bitcoin, and my plan for September. I hope you like it!
Write a comment with your altcoin + hit the like button, and I will make an analysis for you in response. Trading is not hard if you have a good coach! This is not a trade setup, as there is no stop-loss or profit target. I share my trades privately. Thank you, and I wish you successful trades!

Gold Analysis – 15-Minute Timeframe (September 10 , 2025)Has gold formed a Quasimodo (QM) pattern? We’re not certain yet. If price reacts from the current zone, it may retrace toward the blue area. Otherwise, one more chance for a pullback remains — a rejection from the previous high.
If that level fails to hold, gold has potential to rally toward the 3720 zone.
⛔ No entry without confirmation.
✅ Risk management is essential.
📈 Wishing you profitable and disciplined trading.

Pumpcoin scalp long to $0.005033Took this trade a while ago
Sl: 0.004753
tp area is at least 1:1
Monitor from there exit.

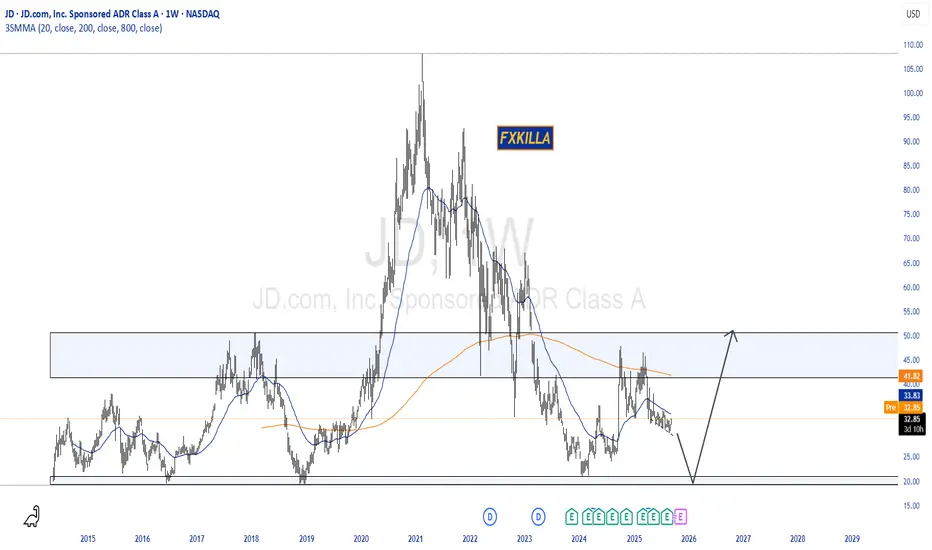
JD HIGH PROBABILITY SETUP SOON!!!🚨 JD HIGH PROBABILITY SELL/BUY SETUP 🚨
* Here We Can See Clearly The Next Potential Moves For JD Coming Hours/Days.
* Keep Your Eyes Close On Your Trading Positions.
* Happy PIP Hunting Traders.
FXKILLA.
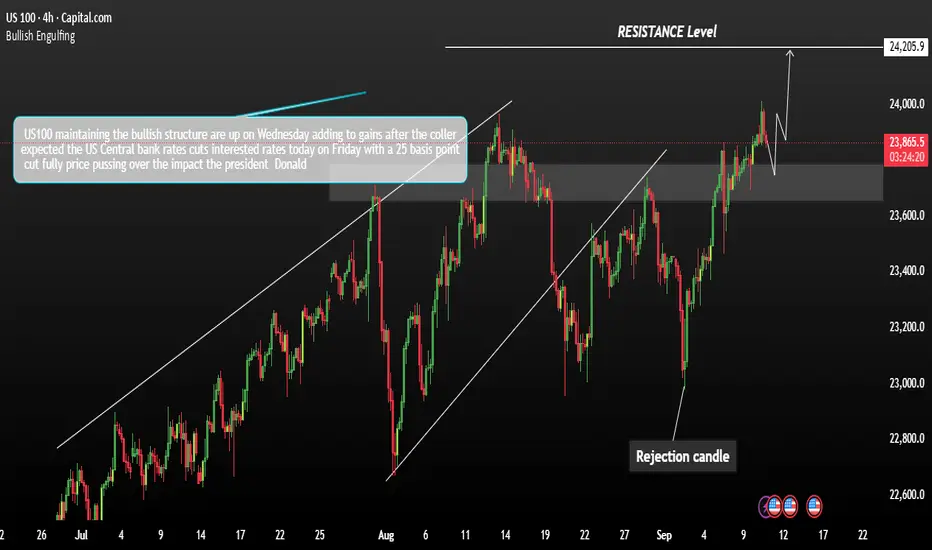
USNASDEQ 100 Futures are Price consolidation High Top US100 futures are higher on Wednesday, extending gains after a cooler-than-expected US Producer Price Index (PPI) report. The data eased inflation concerns, supporting risk sentiment. Oracle (ORCL) shares are surging, up more than 30% in pre-market trading following strong earnings and upbeat guidance.
The index remains bullish in structure. Price is expected to test the support area near 23,200. As long as the index holds above this level, momentum favours a move higher toward 24,200 in the next leg up.
You may find more details in the chart.
Trade wisely best of Luck.
Ps; Support with like and comments for better analysis Thanks for Support.
Market Analysis: Gold Rockets to New HighMarket Analysis: Gold Rockets to New High
Gold price rallied to a new all-time high above $3,670.
Important Takeaways for Gold Price Analysis Today
- Gold price started a major increase from $3,500 against the US Dollar.
- A key bullish trend line is forming with support at $3,635 on the hourly chart of gold.
Gold Price Technical Analysis
On the hourly chart of Gold, the price formed a base above $3,500. The price remained in a bullish zone and started a strong increase above $3,550.
There was a decent move above the 50-hour simple moving average and $3,620. The bulls pushed the price above the $3,640 and $3,650 resistance levels. Finally, the price climbed to a new all-time high at $3,674 before there was a pullback.
The price dipped below the 23.6% Fib retracement level of the upward move from the $3,511 swing low to the $3,674 high, and the RSI declined below 50. Initial support on the downside is near $3,635 and the 50-hour simple moving average.
There is also a key bullish trend line forming with support at $3,635. The first major support is near the 50% Fib retracement at $3,592. If there is a downside break below $3,592, the price might decline further. In the stated case, the price might drop toward $3,575. Any more losses might push the price toward $3,510.
Immediate resistance is near $3,655. The next major hurdle for the bulls is $3,675. An upside break above $3,675 could send Gold price toward $3,688. Any more gains may perhaps set the pace for an increase toward $3,700.
This article represents the opinion of the Companies operating under the FXOpen brand only. It is not to be construed as an offer, solicitation, or recommendation with respect to products and services provided by the Companies operating under the FXOpen brand, nor is it to be considered financial advice.

Market Analysis: WTI Crude Oil StrugglesMarket Analysis: WTI Crude Oil Struggles
Crude oil is showing bearish signs and might decline below $62.25.
Important Takeaways for WTI Crude Oil Price Analysis Today
- Crude oil price failed to clear the $65.60 region and started a fresh decline.
- There is a short-term bullish trend line forming with support at $62.25 on the hourly chart of XTI/USD.
WTI Crude Oil Price Technical Analysis
On the hourly chart of WTI Crude Oil, the price struggled to clear $65.60 against the US Dollar. The price started a fresh decline below $64.60.
The bears gained strength and pushed the price below $62.00. Finally, the price tested $61.20 and recently started a recovery wave. There was a move above $62.00, the 50-hour simple moving average, and the 23.6% Fib retracement level of the downward move from the $65.63 swing high to the $61.23 low.
The bears are now active near $63.00. If there is a fresh increase, the price could face a barrier near $63.05. The first major resistance is near the 50% Fib retracement at $63.40. The next stop for the bulls could be near $64.60. Any more gains might send the price toward $65.60.
Conversely, the price might start another decline and test a short-term bullish trend line with support at $62.25 and the 50-hour simple moving average.
The next major support on the WTI crude oil chart is $61.20. If there is a downside break, the price might decline toward $60.50. Any more losses may perhaps open the doors for a move toward $60.00.
This article represents the opinion of the Companies operating under the FXOpen brand only. It is not to be construed as an offer, solicitation, or recommendation with respect to products and services provided by the Companies operating under the FXOpen brand, nor is it to be considered financial advice.

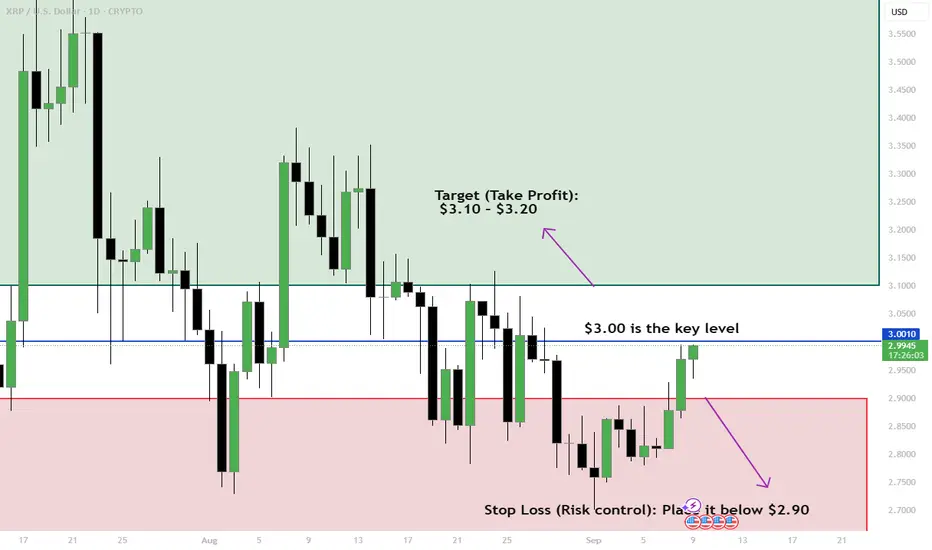
XRP Trading Scenarios (Daily Chart)Hey traders! Let’s break down what’s happening with XRP around the $3.00 level. This price area is very important right now, it could decide the next move. 🚀 or 📉
✅ Bullish Case (If XRP breaks $3.00 upwards)
What to watch: If the daily candle closes above $3.00, that means buyers are strong.
Entry idea: Wait for a break and retest of $3.00 (price goes above $3.00, then comes back down slightly to confirm it as new support).
Target (Take Profit): $3.10 – $3.20
Stop Loss (Risk control): Place it below $2.90
👉 Tip for beginners:
Don’t FOMO in! Always wait for the candle to close above $3.00 to confirm the breakout.
❌ Bearish Case (If $3.00 rejects downwards)
What to watch: If XRP fails to break $3.00 and gets pushed down, sellers are in control.
Entry idea: Look for a rejection pattern near $3.00 (long wicks, bearish engulfing, etc.) before entering short.
Target (Take Profit): $2.85 – $2.75
Stop Loss (Risk control): Place it above $3.05
👉 Tip for beginners:
Patience is key! A clear rejection will give you a safer entry instead of guessing.
🔑 Quick Reminders
Always use Stop Loss → This protects you from big losses.
Trade with a plan → Don’t jump in without knowing your entry, target, and stop.
$3.00 is the key level → Above it = bullish bias, below it = bearish pressure.
Don't forget to follow me, boost this post and comment your ideas.
-Neo
Idea for ETHThis is short term idea for ETH.Agree? based on rtm i see drives following through eachother and drive 1 being ignored by a secret signal which i expect for a sell from above as a main idea.

XAUUSD – The Bullish Momentum Continues, Targeting 3,700 USD?Hello traders, as we can see, gold surged strongly yesterday , breaking through key resistance and closing near the highs. Safe-haven flows continue to pour into the precious metal, while the USD weakens on expectations that the Fed may soon ease its policy. This development further strengthens the belief that gold remains firmly in an uptrend.
The US PPI report forecast shows producer inflation dropping sharply from 0.9% to 0.3% . This signals that the Fed may cut rates sooner, weakening the USD and further boosting gold. Amid global uncertainty, gold continues to stand out as the safe-haven asset of choice.
On the H4 chart, XAUUSD is still moving within an ascending channel, consistently forming Higher Highs and Higher Lows. The price is currently trading around 3,647 USD, holding firmly above both EMA34 and EMA89. The 3,630 USD zone has become a key support level, where a slight pullback could occur before the next leg higher.
The most reasonable strategy is to Buy on dip around 3,630 – 3,635 , with a stop loss below 3,610. Short-term targets lie near 3,680, while the extended target is 3,700 USD – a major resistance level where profit-taking pressure may intensify. With this setup, the risk-to-reward ratio is highly attractive.
Wishing you all successful trades!

DXY Head and Shoulders Retest H4Change of bias on DXY - if the current bounce of price in support is a retest of this H&S pattern then we may see prices fall to the 94 - 95 region.
NB: the upward-facing arrow is just a rough estimation of the retest target. Prices may fall from a much lower level than that.

DOGEUSDT.P 1WDOGE Update
Key Level: $0.27
Pattern: Double Bottom & Triangle
Bullish Target: $0.50 (on breakout)
Action: Watch for volume on a break above $0.27.
DYOR & NFA

BTC's situation+next targets and expected movementsThe price seems to have completed the corrective wave, and from now on, it's time for a price increase, which will continue up to around $150k .
_ _ _ _ __ _ _ _ _ _ _ _ _ _ _ _ _ _ _ _ _ _ _ _ _ _ _ _ _ _ _ _
✅Thank you, and for more ideas, hit ❤️Like❤️ and 🌟Follow🌟!
⚠️Things can change...
The markets are always changing and even with all these signals, the market changes tend to be strong and fast!!

GBP/USD - SIMPLIFY POTENTIAL OUTCOMEDear Friends in Trading,
“I share only my perspective. In this industry, learning never ends, but progress comes when we learn from mistakes without repeating them.” - ANROC
A new 3D candle shows it best - CONTRACTION
I sincerely hope my point of view offers a valued insight.
Thank you for taking the time study my analysis.
