30/5/25 Can Bulls Form a Retest of May 29 High? Or Down?
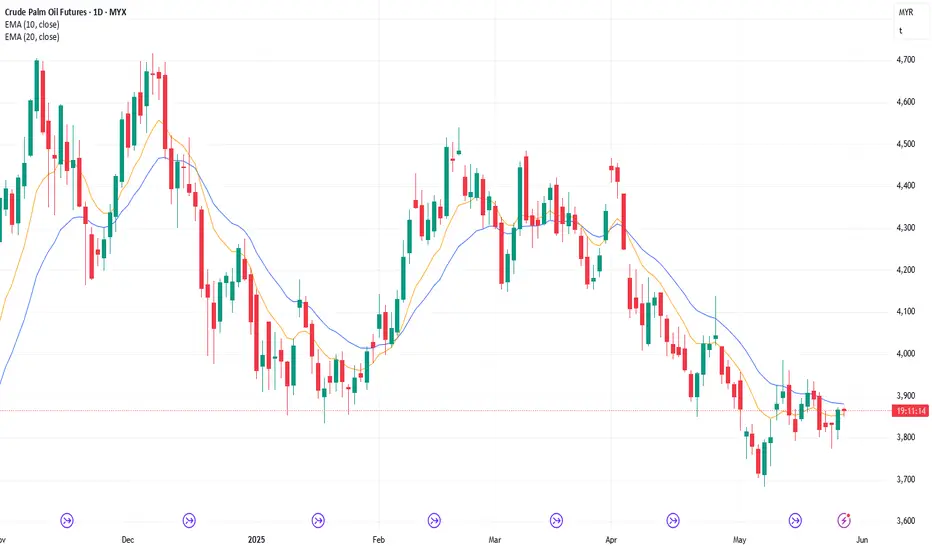
Thursday’s candlestick (29 May) was a bull bar closing above the middle of its range with a prominent tail above.
In our last report, we said traders would see if the bulls could create a follow-through bull bar closing above the 20-day EMA, or if the market would reverse below the 20-day EMA again, like the previous two times (May 15 and May 21).
The bulls created a follow-through bull bar above the 20-day EMA, something they could not do in the last 2 times (May 15 and May 21).
The candlestick has a long tail above which indicates the bulls are not yet as strong as they hope for.
They want a reversal from a double bottom bull flag (May 16 and May 26).
They see the current move as a pullback and want a retest of the May 29 high tomorrow, even if it forms a lower high.
They need to create a breakout above 4000 with follow-through buying to increase the odds of a reversal.
If the market trades lower, they want the 20-day EMA or the May 26 low to act as support, forming a higher low and a wedge bull flag (with the first two legs being the May 16 and May 26 lows).
The bears want a reversal from a wedge bear flag (April 25, May 14, and May 29).
They want the move to lack follow-through buying above the 20-day EMA like the last 2 times (May 15 and May 21). They want the market to reverse below the 20-day EMA tomorrow.
If the market trades higher, they want the 3950 - 4000 levels as the resistance area. So far, this is the case.
Exports for the first 25 days seem good, +7%
Production is up marginally so far. June's production should be more or less around May's level.
Refineries' appetite to buy in recent days seems ok.
For tomorrow (Friday, May 30), traders will see if the bulls can create a retest of the May 29 high, even if it only forms a lower high.
Or will the market reverse below the 20-day EMA again, like the previous two times (May 15 and May 21)? If so, especially if it is strong, we may get a retest of the May 26 low in the coming days.
Andrew
Palmoil

29/5/25 - Poor FT & Reverse Below 20-day EMA again?
Wednesday’s candlestick (28 May) was a bull bar closing near its high.
In our last report, we said traders would see if the bulls could create a follow-through bull bar closing above the 20-day EMA, or if the market would stall at the 20-day EMA again.
The bulls created a follow-through bull bar closing slightly above the 20-day EMA.
They want a reversal from a double bottom bull flag (May 16 and May 26).
Since today closed above the 20-day EMA, the bulls need to create a follow-through bull bar closing above the 20-day EMA, something they could not do in the last 2 times (May 15 and May 21).
If the market trades lower, they want the May 26 low to act as support, forming a wedge bull flag (with the first two legs being the May 16 and May 26 lows).
The bears want a reversal from a wedge bear flag (April 25, May 14, and May 28).
They want the market to lack follow-through buying above the 20-day EMA like the last 2 times (May 15 and May 21).
If the market trades higher, they want the 20-day EMA or the 3950 - 4000 as the resistance area.
Exports for the first 25 days seem good, +7%
Production is up marginally so far. June's production should be more or less around May's level.
Refineries' appetite to buy in recent days seems ok.
For tomorrow (Thursday, 29 May), traders will see if the bulls can create a follow-through bull bar closing above the 20-day EMA.
Or will the market reverse below the 20-day EMA again, like the previous two times (May 15 and May 21)? If so, we may get a retest of the May 26 low in the coming days.
Andrew

28/5/25 Bulls Need FT Bull Bar Closing Abov 20-day EMA
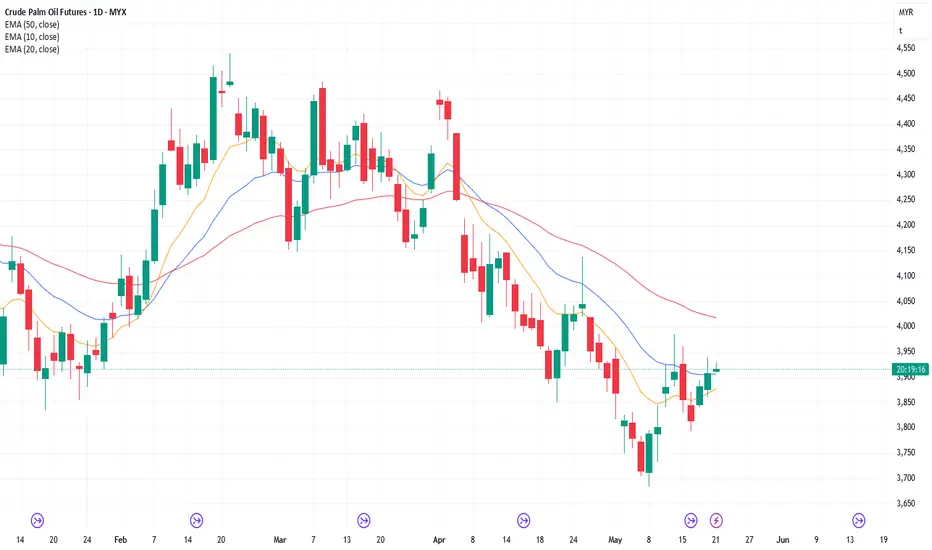
Tuesday’s candlestick (27 May) was a bull bar closing near its high.
In our last report, we said traders would see if the bulls could create a follow-through bull bar closing near its high. If so, the odds of a retest of the 20-day EMA or the 3950 area will increase. Or if the bears would still be able to create more follow-through selling.
The bulls managed to create a strong bull entry bar.
They want a reversal from a double bottom bull flag (May 16 and May 22).
They hope to get at least a retest of the 20-day EMA (around 3880). The market tested near today (high 3873).
Next, they need to create a follow-through bull bar closing above the 20-day EMA to increase the odds of a reversal.
The bears want a reversal from a double top bear flag (April 25 and May 14) and another smaller double top bear flag (May 14 and May 20).
The problem with the bear's case was that the follow-through selling was limited (May 26).
If the market trades higher, they want the 20-day EMA or the 3950 - 4000 as the resistance area.
They want a reversal from a wedge pattern (with the first two legs being May 14 and May 20).
Exports for the first 25 days seem good, +7%
Production is up marginally so far.
Refineries' appetite to buy in recent days seems ok.
For tomorrow (Wednesday, 28 May), traders will see if the bulls can create a follow-through bull bar closing above the 20-day EMA. If so, the odds of a retest of the 3950-4000 area will increase.
Or will the market stall at the 20-day EMA again?
Andrew
27/5/25 - FT Bull Bar or More FT Selling?
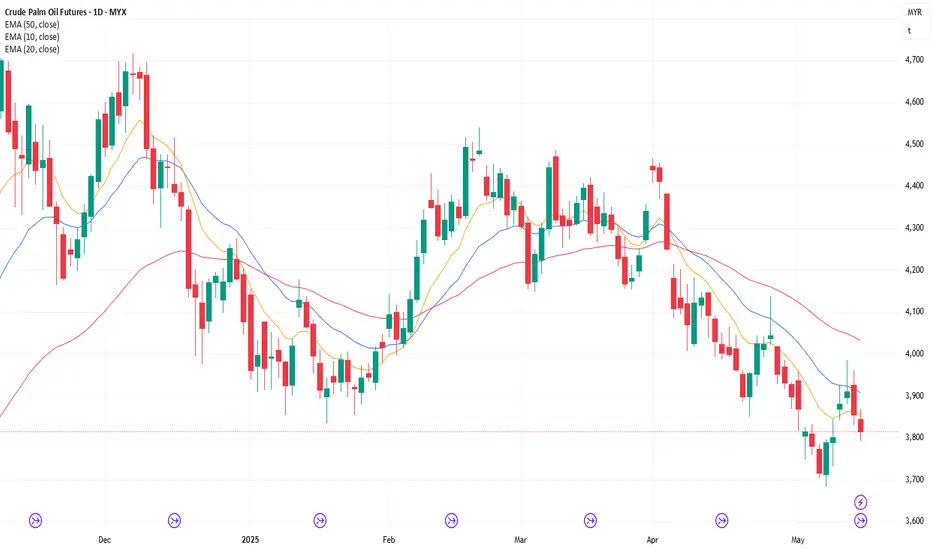
Monday’s candlestick (26 May) was a bear doji closing near its high with a long tail below.
In our last report, we said the market could still trade at least a little lower. Traders would see if the bears could create a follow-through bear bar closing near its low, or if they would fail to do so, and the candlestick would close with a long tail below or with a bull body instead.
The market traded below the May 16 low, but the follow-through selling was limited and the market reversed to near its high.
The bears want a reversal from a double top bear flag (April 25 and May 14) and another smaller double top bear flag (May 14 and May 20).
They want another strong leg down to retest the May 8 low.
They must continue creating follow-through selling to increase the odds of lower prices.
The bulls want a reversal from a double bottom bull flag (May 16 and May 22).
They need to create a follow-through bull bar tomorrow to increase the odds of a reversal.
They hope to get at least a retest of the 20-day EMA (around 3880).
Exports for the first 25 days seem good, +7%
Production is up marginally so far.
Refineries' appetite to buy in recent days seems ok.
For tomorrow (Tuesday, 27 May), traders will see if the bulls can create a follow-through bull bar closing near its high. If so, the odds of a retest of the 20-day EMA or the 3950 area will increase.
Or will the bears be able to create more follow-through selling still?
The consecutive doji in the last two trading days indicate an area of temporary balance.
Andrew

26/5/25 Bears Need Strong Follow-through Selling
Friday’s candlestick (23 May) was an inside bear doji.
In our last report, we said traders would see if the bears could create a follow-through bear bar closing near its low. If so, the weekly candlestick will close near its low, increasing the odds that the market will trade at least slightly lower next week.
The bears got some follow-through selling albeit not a strong one. Considering Soybean Oil was trading higher for the day, the bulls were not able to create a bull bar which indicates the bulls are not yet strong.
The bears see the recent move as a retest of the May 14 high and want it to form a lower high. This was the case.
They want a reversal from a double top bear flag (April 25 and May 14) and another smaller double top bear flag (May 14 and May 20).
They see Friday simply as a pullback and want follow-through selling next week.
They want another strong leg down to retest the May 8 low.
The bulls want a reversal from a double bottom bull flag (May 16 and May 22).
They want another big leg up, testing the 4000 area.
They must create strong bull bars trading far above the 20-day EMA to increase the odds of a reversal. So far, they have not yet been able to do so.
Exports for the first 20 days seem ok, +5%
Production is up marginally so far.
Refineries' appetite to buy in recent days seems good—slightly slower last week.
The market could still trade at least a little lower next week.
For tomorrow (Monday, 26 May), traders will see if the bears can create a follow-through bear bar closing near its low. That would increase the odds of testing near the May 8 low.
Or will the bears fail to create a follow-through bear bar, and the candlestick close with a long tail below or with a bull body instead?
Andrew

23/5/25 Bears Got Strong Entry Bar, Need FT Selling Tomorrow
Thursday’s candlestick (22 May) was a big bear bar closing near its low.
In our last report, we said traders would see if the bears could create a strong bear entry bar closing near its low, or if the market would continue to trade sideways around the 20-day EMA area instead.
The bears got a big bear entry bar testing near the May 16 low area.
They see the recent move as a retest of the May 14 high and want it to form a lower high. This was the case.
They want a reversal from a double top bear flag (April 25 and May 14) and another smaller double top bear flag (May 14 and May 20).
They want another strong leg down to retest the May 8 low.
Since they got a strong bear entry bar today, they need to create a follow-through bear bar, breaking below the May 16 low, increasing the odds of a retest of the May 8 low.
The bulls want a reversal from a double bottom bull flag (May 16 and May 22).
They want another big leg up, testing the 4000 area.
They must create strong bull bars trading far above the 20-day EMA to increase the odds of a reversal.
Exports for the first 20 days seem ok, +5%
Production is up marginally so far.
Refineries' appetite to buy in recent days seems good. Slightly slower this week.
For tomorrow (Friday, 23 May), traders will see if the bears can create a follow-through bear bar closing near its low. If so, the weekly candlestick will close near its low, increasing the odds that the market will trade at least slightly lower next week.
Or will the bears fail to create a follow-through bear bar, and the bulls get a retest near the 20-day EMA instead? If this is true, it indicates that the bear's case is weak.
Andrew

22/5/25 Stall at 20-day EMA, Can Bears Get Bear Entry Bar?
Wednesday’s candlestick (21 May) was an inside bear bar closing in its lower half and closing below the 20-day EMA.
In our last report, we said traders would see if the bulls could create another follow-through bull bar closing above the 20-day EMA, or if the market would continue to stall around the 20-day EMA area. If this is the case, the odds of a retest of the May 16 low will increase.
The market opened higher in the morning but traded sideways to down for most of the day in a tight range. The bulls could not create another follow-through bull bar, and the market is currently stalling at the 20-day EMA.
The bears see the recent move as a retest of the May 14 high and want it to form a lower high. So far, the pullback is a lower high.
They want a reversal from a double top bear flag (April 25 and May 14) and another smaller double top bear flag (May 14 and May 20).
They want the 20-day EMA to act as resistance, followed by another strong leg down to retest the May 8 low. So far, the market is stalling around the 20-day EMA.
They need to create a strong bear entry bar tomorrow to increase the odds of a retest of the May 16 low.
The bulls want a reversal from a higher low major trend reversal (May 16).
They want a large second leg sideways to up. So far, the second leg up is forming a lower high and stalling around the 20-day EMA.
They must create strong bull bars trading far above the 20-day EMA to increase the odds of a reversal.
Exports for the first 20 days seem ok, +5%
Production is up marginally so far.
Refineries' appetite to buy in recent days seems good. Slightly slow yesterday.
For tomorrow (Thursday, 22 May), traders will see if the bears can create a strong bear entry bar closing near its low.
Or will the market continue to trade sideways around the 20-day EMA area?
Andrew

21/5/25 Can Bulls Create More FT Buying? Or Stall at 20-day EMA?
Tuesday’s candlestick (20 May) was a bull bar closing slightly above the middle of its range with a long tail above, and closing around the 20-day EMA.
In our last report, we said traders would see if the bulls could create a follow-through bull bar closing above the 20-day EMA, or if the market would trade slightly higher, but stall below the May 14 high and close below the 20-day EMA again.
The market traded higher in the morning and formed a sideways pullback in the afternoon.
The bears see the current move as a retest of the May 14 high and want it to form a lower high.
They want a reversal from a double top bear flag (April 25 and May 14).
They want the 20-day EMA to act as resistance, followed by another strong leg down to retest the May 8 low.
If the market trades higher, they want the 14 May high to act as resistance.
The bulls want a reversal from a higher low major trend reversal (May 16).
They want a large second leg sideways to up.
They must create a strong retest of the May 14 high and a strong breakout with sustained follow-through buying.
The bulls must create strong bull bars trading far above the 20-day EMA to increase the odds of a reversal.
Exports for the first 20 days seem ok, +5%
Production is up marginally so far.
Refineries' appetite to buy in recent days seems good.
For tomorrow (Wednesday, 20 May), traders will see if the bulls can create another follow-through bull bar closing above the 20-day EMA.
Or will the market continue to stall around the 20-day EMA area? If this is the case, the odds of a retest of the May 16 low will increase.
The market dynamic for Wednesday is about the same as Tuesday for now.
Andrew
19/5/25 Bears Need More FT Selling, Bulls Want May 14 High
Friday's candlestick (May 16) was a follow-through bear bar with tails.
In our previous report, we said traders would see if the bears could get a strong follow-through bear bar. If they do, the odds of retesting the May 8 low increase. Or if the market would trade slightly lower, but close with a long tail below or a bull body, forming a higher low instead.
The bears got a follow-through bear bar, albeit not a big one.
They see the recent rally as a pullback and hope that the move has alleviated the oversold conditions and want a resumption of the trend.
They want a reversal from a double top bear flag (April 25 and May 14).
They need to create more follow-through selling to increase the odds of a retest and breakout below the May 8 low.
If the market trades higher, they want it to form a lower high. They want it to stall below the 20-day EMA (around 3900). They want any pullback higher to lack follow-through buying.
The bulls see the current move as a retest of the prior trend's extreme low (May 8).
They want the market to form a higher low followed by at least a small second leg sideways to up to retest the recent leg high (May 14 high), even if it only forms a lower high.
The bulls must create strong bull bars trading far above the 20-day EMA to increase the odds of a reversal.
Exports for the first 15 days seem decent, +10 to 15%
Production is up marginally so far.
Refineries' appetite to buy in recent days seems good.
For tomorrow (Monday, 19/5/25), traders want to see if the bears can get another follow-through bear bar. If they do, the odds of retesting the May 8 low increase.
Or will the market form a retest of the May 14 high, even if it only forms a lower high?
The weekly candlestick closing near its low slightly favor the market to trade at least a little lower sometime this week.
Andrew
16/5/25 Bears Need Strong FT to Resume Trend FCPO
Thursday's candlestick (May 15) was a big bear bar closing in its lower half with prominent tails.
In our previous report, we said traders would see if there would be a retest of the 4000 high area, and if the retest of the 4000 level is weak, sellers may return. Or would the bears be able to create a strong bear entry bar, which can lead to a retest of the May 8 low, even if it only forms a higher low.
The market traded formed a weak retest of the prior high in the night session, reaching the 3960 area, but sold off during the day.
The bears got a strong bear entry bar.
They see the recent rally as a pullback and hope that the move has alleviated the oversold conditions and want a resumption of the trend.
They want a reversal from a double top bear flag (April 25 and May 14).
They need to create a follow-through bear bar following Thursday's bear entry bar to increase the odds of a retest and breakout below the May 8 low.
The bulls want a failed breakout below the January low.
They want a TBTL (Ten Bars, Two Legs) pullback, lasting about 2 weeks.
They want the market to form a higher low followed by at least a small second leg sideways to up to retest the recent leg high (May 14 high).
The bulls must create strong bull bars trading far above the 20-day EMA to increase the odds of a reversal.
Soybean Oil is trading at the limit down today. Will we see a situation where there are consecutive days of limit down? If yes, this can't be good for palm oil.
Exports for the first 15 days seem decent +10 to 15%
Production is up marginally so far.
Refineries' appetite to buy in the last 2 days seems good.
For tomorrow (Friday, 16/5/25), traders want to see if the bears can get a strong follow-through bear bar. If they do, the odds of retesting the May 8 low increase.
Or will the market trade slightly lower, but close with a long tail below or a bull body, forming a higher low? If this is the case, that could indicate a lack of strength in the selling pressure.
Breakouts from trading ranges can fail, and odds slightly favor the trading range to continue until there is a strong breakout with sustained follow-through selling/buying.
Andrew

15/5/25 Retest 4000 high or Can Bears Get a FT Bear Bar?
Wednesday's candlestick (May 14) was a bull doji closing in its lower half with a long tail above.
In our previous report, we said the traders want to see if the bulls can create sustained follow-through buying, closing above the 20-day EMA or if the market would trade higher, but stalls around the 20-day EMA area (around 3950) and close with a long tail or a bear body instead (if this is the case, that would indicate the bulls are not as strong as they hope to be).
The market traded higher above the 20-day EMA, but reversed off the day's high to close below it (the 20-day EMA). The long tail above and the candlestick closing in its lower half indicate the bulls are not yet strong.
The bears see the current move as a pullback. They hope that the pullback in the last 5 days has alleviated the oversold conditions and want a resumption of the trend.
They want it to stall around the 20-day EMA (around 3950), or around the 3970-4000 area, forming a double top bear flag with the April 25 high. Today (Wed, May 14), the market tested near the 4000 level and reversed off it, closing below 3950.
If the market trades higher, they want it to form a double top with the May 14 high (around the 4000 area)
They see today's candlestick (Wed, May 14) as a reversal bar and want a reversal from a double top bear flag with the April 25 high.
They need to create a strong follow-through bear bar tomorrow to increase the odds of a reversal down.
The bulls got a reversal from a lower low major trend reversal and a wedge pattern (Apr 9, Apr 22, and May 8). They want a failed breakout below the January low.
They want a TBTL (Ten Bars, Two Legs) pullback, lasting about 2 weeks.
If there is a pullback lower, they want the market to form a higher low followed by at least a small second leg sideways to up to retest the current leg high (now May 14 high).
So far, the market traded above the 20-day EMA today (Wed, May 14) but could not close above it.
The bulls must create follow-through buying and trading far above the 20-day EMA to increase the odds of a reversal.
The wedge pattern increases the odds of a small 2-legged sideways to up pullback. So far, the minimum requirement has been fulfilled.
For tomorrow (Thursday, 15/5/25), traders want to see if there will be a retest of the 4000 high area. If there is, will it break above it or form a lower high? If the retest of the 4000 level is weak, sellers may return.
Or will the bears be able to create a strong bear entry bar? If yes, we may get a retest of the May 8 low, even if it only forms a higher low.
Breakouts from trading ranges can fail, and odds slightly favor the trading range to continue until there is a strong breakout with sustained follow-through selling/buying.
Andrew

14/5/25 Bulls Need More Follow-through Buying FCPO
Tuesday's candlestick (May 13) was a bull doji closing slightly below the middle of its range with prominent tails above and below.
In our previous report, we said the market may gap up early. Traders would see if the bulls could create a follow-through bull bar closing near its high, or if the market would trade higher, but the candlestick closes with a long tail above or a bear body instead.
The market gapped higher, followed by an intraday pullback, then traded off the day's low to close with a small bull body. The bulls got some follow-through buying, although not as strong as they hoped, yet.
The bears see the current move as a pullback.
They want it to stall around the 20-day EMA (around 3950), or around the 3970-4000 area, forming a double top bear flag with the April 25 high.
If the market trades higher, they want the 4050 or the April 25 high to act as resistance.
They want the pullback to be weak, sideways, and lacking in strong follow-through buying (overlapping candlesticks, bear bars, doji(s), and prominent tails above candlesticks).
The bulls want a reversal from a lower low major trend reversal and a wedge pattern (Apr 9, Apr 22, and May 8). They want a failed breakout below the January low.
They hope to get at least a small two-legged sideways to up pullback lasting a few days. The pullback phase has begun.
If there is a pullback, they want at least a small second leg sideways to up to retest the current leg high (now May 13 high).
They want a TBTL (Ten Bars, Two Legs) Pullback, lasting about 2 weeks.
They must create follow-through buying, trading far above the 20-day EMA to increase the odds of a reversal.
While the selloff since the April 2 high to May 8 low was strong, the move has lasted a long time and is slightly climactic.
The wedge pattern increases the odds of a small 2-legged sideways to up pullback. The move is likely underway.
So far in the night market, the candlestick is an inside bull bar.
For tomorrow (Wednesday, 14/5/25), traders want to see if the bulls can create sustained follow-through buying, closing above the 20-day EMA. If they can do that, the odds of a 2-legged sideways to up pullback will increase.
Or will the market trade higher, but the market stalls around the 20-day EMA area (around 3950) and close with a long tail or a bear body instead? If this is the case, that would indicate the bulls are not as strong as they hope to be.
Breakouts from trading ranges can fail, and odds slightly favor the trading range to continue until there is a strong breakout with sustained follow-through selling/buying.
Andrew

13/5/25 Bulls Need Strong Follow-through Buying FCPO
Friday's candlestick (May 9) was a bull doji closing above the middle of its range.
In our previous report, we said traders would see if the bulls could create sustained follow-through buying. If they can do that, the odds of a 2-legged sideways to up pullback will increase. Or if the market would trade higher, but the candlestick closes with a long tail above it or with a bear body instead. If this is the case, it would mean strong bears and weak bulls.
The market traded higher, followed by an intraday retest of the May 8 low, forming a higher low. Palm oil then traded off the day's low to close with a small bull body in its upper half. The bulls got some follow-through buying, although not as strong as they hoped, yet.
The bears want a strong breakout below the January low, followed by a measured move based on the height of the 5-month trading range, which would take the market to the 3200 area.
If the market trades higher, the bears want it to stall around the 20-day EMA (around 3950), forming a double top bear flag with the April 25 high.
They want the pullback to be weak, sideways, and lacking in strong follow-through buying (overlapping candlesticks, bear bars, doji(s), and prominent tails above candlesticks).
The bulls want a reversal from a lower low major trend reversal and a wedge pattern (Apr 9, Apr 22, and May 8). They want a failed breakout below the January low.
They hope to get at least a small two-legged sideways to up pullback lasting a few days. The pullback phase may have begun.
They must continue creating follow-through buying to increase the odds of testing near the 20-day EMA.
They want a TBTL (Ten Bars, Two Legs) Pullback, lasting about 2 weeks. The pullback phase may be underway.
While the selloff since the April 2 high to May 8 low was strong, the move has lasted a long time and is slightly climactic.
The wedge pattern increases the odds of a small 2-legged sideways to up pullback. The move could be underway.
Traders want to see if the bulls can create sustained follow-through buying tomorrow. If they can do that, the odds of a 2-legged sideways to up pullback will increase.
For tomorrow (Tuesday, 13/5/25), the market may gap up early. Traders will see if the bulls can create a follow-through bull bar closing near its high.
Or will the market trade higher, but the candlestick closes with a long tail above or a bear body instead (after gapping up)? If so, the bulls are not yet strong and lack strong follow-through buying.
Breakouts from trading ranges can fail, and odds slightly favor the trading range to continue until there is a strong breakout with sustained follow-through selling/buying.
Andrew

9/5/25 Start of 2-Legged Sideways to Up Pullback? Bulls Need FT
Thursday's candlestick (May 8) was an outside bull bar closing near its high.
In our previous report, we said the market could still trade at least a little lower. Traders would see if the bears could create another follow-through bear bar, or if the market would trade lower, but the candlestick closes with a long tail below or a bull body.
The market traded slightly lower, but reversed to close as a big bull bar with a prominent tail below.
The bears want a strong breakout below the January low, followed by a measured move based on the height of the 5-month trading range, which would take the market to the 3200 area.
If the market trades higher, the bears want it to stall around the 20-day EMA (around 3950), forming a double top bear flag.
They want the pullback to be weak and sideways (overlapping candlesticks, bear bars, doji(s), and prominent tails above candlesticks).
The bulls want a reversal from a lower low major trend reversal and a wedge pattern (Apr 9, Apr 22, and May 8). They want a failed breakout below the January low.
They hope to get at least a small two-legged sideways to up pullback lasting a few days. The pullback phase may have begun.
Since Thursday's candlestick was an outside bull bar, the bulls need to create a follow-through bull bar to increase the odds of testing near the 20-day EMA.
They want a TBTL (Ten Bars, Two Legs) Pullback, lasting about 2 weeks.
The market broke out below the January low on Monday with follow-through selling on Tuesday and Wednesday.
Thursday's candlestick traded lower but reversed into an outside bull bar.
While the selloff since April 2 was strong, the move has lasted a long time and is slightly climactic.
The wedge pattern increases the odds of a small 2-legged sideways to up pullback.
So far, the market has traded slightly higher in the night market.
Traders want to see if the bulls can create sustained follow-through buying tomorrow. If they can do that, the odds of a 2-legged sideways to up pullback will increase.
For tomorrow (Friday, 9/5/25), traders will see if the bulls can create a follow-through bull bar.
Or will the market trade higher, but the candlestick closes with a long tail above or a bear body instead? If this is the case, it would mean strong bears and weak bulls.
Breakouts from trading ranges can fail, and odds slightly favor the trading range to continue until there is a strong breakout with sustained follow-through selling/buying.
Andrew

8/5/25 - More Strong FT Selling or Profit Taking Soon? FCPO
Wednesday's candlestick (May 7) was a bear bar closing near its low.
In our previous report, we said traders would see if the bears could create more follow-through selling below the January low, or if the candlestick closes with a long tail below or a bull body instead.
The bears continue to get follow-through selling below the January low.
The bears want a strong breakout below the January low, followed by a measured move based on the height of the 5-month trading range, which would take the market to the 3200 area.
In the night market session, the candlestick is currently a small bear bar trading near its low, and near Wednesday's low.
If the bears can get strong consecutive bear bars, that would increase the odds of a successful breakout.
The bulls want a reversal from a lower low major trend reversal and a wedge pattern (Apr 9, Apr 22, and May 8).
They hope to get at least a small two-legged sideways to up pullback lasting a few days soon.
They must create strong bull bars over the next several days to increase the odds of a failed breakout.
The market broke out below the January low on Monday with follow-through selling on Tuesday and Wednesday.
The market could still trade at least a little lower tomorrow.
Traders want to see if the bears can create sustained follow-through selling over the next several days. If they can do that, the odds of a successful breakout and a measured move will increase.
So far in the night session, the candlestick is a small bear bar trading near its low.
For tomorrow (Thursday, 8/5/25), traders will see if the bears can create another follow-through bear bar.
Or will the market trade lower, but the candlestick closes with a long tail below or a bull body?
The bulls need to do more to show they're back in control. So far, they haven't been able to do so.
Andrew

7/5/25 - Bears Got FT Selling, Can Get Dangerous
Tuesday's candlestick (May 6) was a bear bar closing in its lower half with small tails.
In our previous report, we said traders would see if the bears can create more follow-through selling below the January low, or if the market would form a small retest of yesterday's low (but possibly a higher low), but stall and trade higher instead.
Bulls attempted to create intraday reversals but the follow-through buying was limited. The market closed as a bear bar for the day.
The bears want a strong breakout below the January low followed by a measured move based on the height of the 5-month trading range which would take the market to the 3200 area.
In the night market session, the candlestick is currently a bear bar trading near its low, and below Monday's low.
If the bears can get strong consecutive bear bars, that would increase the odds of a successful breakout.
The bulls want a reversal from a double bottom (with the January low). They want a failed breakout and a reversal from a lower low major trend reversal.
They hope the bottom of the trading range will act as support.
They must create strong bull bars over the next several days to increase the odd of a failed breakout.
The market broke out below the January low on Monday. The bulls attempted to create a failed breakout on Tuesday but the follow-through buying is still limited.
Traders want to see if the bears can create sustained follow-through selling over the next several days. If they can do that, the odds of a successful breakout and a measured move will increase.
So far in the night session, the candlestick is a follow-through bear bar trading below Monday's low.
For tomorrow (Wednesday, 7/5/25), traders will see if the bears can create more follow-through selling below the January low.
Or will the candlestick close with a long tail below or a bull body? If this is the case, especially if the bulls can create follow-through buying over the next several days, they could swing the odds to a failed breakout.
Andrew

6/5/25 Can Bears Create More FT Selling or Fail to Do So?
Monday's candlestick (May 5) was a bull doji closing near its high with a long tail below. It has the shape of a bull reversal bar, but the candlestick has a small bull body.
In our previous report, we said traders would see if the bears could create more follow-through selling breaking below the April 22 low. If there is a breakout, traders will see if there are strong follow-through selling. Or would the market form a pullback towards the 20-day EMA over the next few days instead?
The market gapped down and broke below January's low. While there was some follow-through selling, the long tail below the candlestick and the bull body indicate the bears are not as strong as they hope to be.
The bears want a a strong breakout below the April 22 January low followed by a measured move based on the height of the 5-month trading range which would take the market to the 3200 area.
The long tail below the last two candlesticks indicates profit-taking activity as prices probe lower.
The bears must create a strong breakout below January's low with follow-through selling to increase the odds of a successful breakout.
If the market trades higher, they want the 20-day EMA to act as resistance and form a double top bear flag with the April 25 high.
The bulls want a reversal from a double bottom (with the January low). They want a failed breakout and a reversal from a lower low major trend reversal.
As strong as the current selling is, the bulls see it as a sell vacuum and a bear leg within the trading range.
They hope the bottom of the trading range will act as support.
They see Monday's candlestick possibly acting as a signal bar. They must create a strong entry bar with follow-through buying to increase the odds of testing the 20-day EMA.
The market broke out below the January low on Monday, but the candlestick closed near its high and had a bull body with a long tail below. It was not a strong breakout bar.
Traders want to see if the bears could create sustained follow-through selling.
Or will the market stall below the January low and form a pullback towards the 20-day EMA instead?
So far in the night session, the market traded above yesterday's high but reversed into a small bear bar.
For tomorrow (Tuesday, 6/5/25), traders will see if the bears can create more follow-through selling below the January low.
Or will the market form a small retest of yesterday's low (but possibly forming a higher low), but stall and trade higher instead?
The market remains in a large trading range (4500 - 3850). Traders may Buy Low and Sell High within the trading range.
That means buying in the lower third of the trading range, and selling in the upper third until there is a strong breakout from either direction with follow-through buying/selling.
Breakout from trading ranges can fail and odds slightly favor the trading range to continue.
Andrew

FCPO Week 19 2025: Lower or consolidate?So far it is bearish until there is a significant signal that bullish is back on. If price going lower and failed to defend the previous week low then we will likely see price going lower and possibly testing the 3700 area.

5/5/25 - More FT Selling or Pullback to 20-day EMA? FCPO
Friday's candlestick (May 2) was an outside bear bar closing in its lower half with a long tail below.
In our previous report, we said traders would see if the bears could create a retest and breakout attempt below the April 22 low and if there is a breakout, traders would see if there are strong follow-through selling. Or would the market form a pullback towards the 20-day EMA over the next few days instead?
The market opened higher but reversed to break below the April 22 low. However, the market reversed off the low, closing above the April 22 low.
The bears want a a strong breakout below the April 22 low followed by a measured move based on the height of the 5-month trading range which would take the market to the 3200 area. The long tail below Friday's candlestick indicates the breakout is not yet as strong as the bears hope to be.
The bears must create a strong breakout with follow-through selling to increase the odds of a successful breakout.
If the market trades higher, they want the 20-day EMA to act as resistance and form a double top bear flag with the April 25 high.
The bulls want a reversal from a double bottom (Apr 22). They want a failed breakout and a reversal from a lower low major trend reversal.
As strong as the current selling is, the bulls see it as a sell vacuum and a bear leg within the trading range.
They hope the bottom of the trading range will act as support.
They must create strong bull bars trading far above the 20-day EMA to show they are back in control.
Traders expect a small sideways to down leg to retest the April 22 low. They got what they wanted.
Next, traders want to see if the bears could create a breakout below the April 22 low with sustained follow-through selling.
Or will the market form a pullback towards the 20-day EMA instead? If this is the case, traders will see the move's strength. Will it be strong and close far above the 20-day EMA? Or will the market stall at the 20-day EMA again, forming a double top bear flag?
For tomorrow (Monday, 5/5/25), traders will see if the bears can create more follow-through selling breaking below the April 22 low. If there is a breakout, traders will see if there are strong follow-through selling.
Or will the market form a pullback towards the 20-day EMA over the next few days instead?
The market remains in a large trading range (4500 - 3850). Traders may Buy Low and Sell High within the trading range.
That means buying in the lower third of the trading range, and selling in the upper third until there is a strong breakout from either direction with follow-through buying/selling.
Breakout from trading ranges can fail and odds slightly favor the trading range to continue.
Andrew

1/5/25 Pullback or Will Bears Get Follow-through Selling? FCPO
Wednesday's candlestick (Apr 30) was a bear bar closing around the middle of its range with a long tail below.
In our previous report, we said traders would see if the bears could create a retest and breakout attempt below the April 22 low or if Wednesday's candlestick would close with a long tail below instead (if this is the case, it will indicate some profit-taking around the trading range low (3850 area)).
The market did not break out below the April 22 low and the candlestick closed with a long tail below.
The bears want a retest of the recent leg low (Apr 22) followed by a strong breakout and a measured move based on the height of the 5-month trading range.
The bears must create strong follow-through selling to increase the odds of a successful breakout.
If the market trades higher over the next several days, they want the 20-day EMA to act as resistance and form a double top bear flag with the April 25 high.
The bulls want the current move to form a higher low (vs Apr 22) and a double bottom (Apr 22).
If the market trades below the April 22 low, they want a failed breakout and a reversal from a lower low major trend reversal.
As strong as the current selling is, the bulls see it as a sell vacuum and a bear leg within the trading range.
They hope the bottom of the trading range will act as support.
They must create strong bull bars to show they are back in control.
Traders expect at least a small sideways to down leg to retest the April 22 low. They got what they wanted.
Next, traders want to see if the bears could create a breakout below the April 22 low with sustained follow-through selling.
If the market trades higher, they will see the move's strength and whether it will form a lower high to April 25 high, forming a double top bear flag.
For tomorrow (Friday, 2/5/25), traders will see if the bears can create a retest and breakout attempt below the April 22 low. If there is a breakout, traders will see if there are strong follow-through selling.
Or will the market form a pullback towards the 20-day EMA over the next few days instead?
The market remains in a large trading range (4500 - 3850). Traders may Buy Low and Sell High within the trading range.
That means buying in the lower third of the trading range, and selling in the upper third until there is a strong breakout from either direction with follow-through buying/selling.
Breakout from trading ranges can fail and odds slightly favor the trading range to continue.
Andrew

30/4/25 - Can Bears Get a Breakout with FT Selling? FCPO
Yesterday's candlestick (Apr 29) was a bear bar closing in its lower half with a small tail below.
In our previous report, we said traders will see if the bears can create a follow-through bear bar. If they do, it could lead to a retest and breakout attempt below the April 22 low.
The bears got a follow-through bear bar on Tuesday.
They want a retest of the recent leg low (Apr 22) followed by a strong breakout and a measured move based on the height of the 5-month trading range.
If there is a breakout below the April 22 low, the bears must create strong follow-through selling to increase the odds of a successful breakout.
The bulls want the current move to form a higher low (vs Apr 22) and a double bottom (Apr 22).
If the market trades below the April 22 low, they want a failed breakout and a reversal from a lower low major trend reversal.
As strong as the current selling is, the bulls see it as a sell vacuum and a bear leg within the trading range.
They hope the bottom of the trading range will act as support.
They must create strong bull bars to show they are back in control.
The selloff from April 2 to April 22 was strong enough for traders to expect at least a small sideways to down to retest the April 22 low. It is currently underway.
Traders will see the strength of the move. If strong, traders may expect a breakout attempt below the April 22 low. So far, the move appears strong.
The market formed another bear bar in the night market testing near the April 22 low (just 25 points away from the low).
For tomorrow (30/4/25), traders will see if the bears can create a retest and breakout attempt below the April 22 low. If there is a breakout, traders will see if there will be strong follow-through selling.
Or will Wednesday's candlestick close with a long tail below instead? If this is the case, it will indicate some profit-taking around the trading range low (3850 area).
The market remains in a large trading range (4500 - 3850). Traders may Buy Low and Sell High within the trading range.
That means buying in the lower third of the trading range, and selling in the upper third until there is a strong breakout from either direction with follow-through buying/selling.
Breakout from trading ranges can fail and odds slightly favor the trading range to continue.
Andrew

FCPO Week 18 2025: 50-50.Last week price failed to make a new low but instead making a push higher. It might hint that the trend is shifting to bullish but at the current moment it is 50-50. A big bearish key reversal on Friday might indicate that bearish is not done yet. Furthermore look at the weekly candle. The upper and lower wicks are about the same length and the body is more or less in the middle. Next week price action in the 50-50 area might give a clue on where price will go next. However only a close higher or lower of the current high and low of the area will provide confirmation of the future price movement.

FCPO 22 April 2025 - Breakout With Follow-through Selling
Yesterday's candlestick closed as a bear bar near its low.
In our previous report, we said the odds slightly favor the market to trade at least a little lower. Traders would to see if the bears could create a follow-through bear bar to confirm the breakout below the 4000 level. If they do, we may see a retest of the January low around the 3850-3800 area.
The bears got a follow-through bear bar and the night session also traded lower and has tested near the 3860 area.
The bears want a retest of the January low. They got what they wanted.
They want a large second leg sideways to down with the first leg being the April 2 to April 9 low.
They hope to get a strong breakout below the January low area to test the 3800 area.
The bulls want a reversal from a wedge pattern (Mar 25, Apr 9, and Apr 21) and a lower low major trend reversal.
The problem with the bull's case is that they couldn't create strong bull bars with follow-through buying.
They see the current move as a sell vacuum and a bear leg within the trading range.
If the market trades lower, they want a failed breakout below the 3850 area.
They must create strong bull bars to show they are back in control.
Exports for the first 20 days are up ITS: 11.89%, AmSpec: 18.5%.
Production is slowly picking up, but not in a big way yet.
Refineries' appetite to buy physical remains lukewarm with the recent sharp falling market.
The market remains Always In Short.
So far, the move down since April 1 is in a tight bear channel with strong bear bars. The selling pressure is stronger than the buying pressure (bull bars with no follow-through buying).
The breakout below the April 16 low is strong with follow-through selling.
Traders want to see if the bears can create a strong retest of the 3850-3800 area and close tomorrow as a strong bear bar near its low.
Or will the candlestick close with a long tail below and above the middle of its range instead?
If there is a climactic spike down, traders will see if there will be profit-taking activity after that (over the next several days).
For now, odds slightly favor the market to trade at least a little lower.
Traders will see if the 3800-50 area can act as support or if the market will break down below with strength.
