PLTR – is the party over?? whats next ?From 10$ to 33.49$ in 22 days - why ? I think its called … FOMO!
Company has big contracts with the Gov and feds, ok we know but those contracts are NOT new .. and earnings are about 9 cents a share .. 9 cents a share.
Ok lets cover company basics first to make sure we understand what all the noise is about
Palantir is a data analytics platform with one major distinction from the rest – it includes everything meaning the software is front end, back end, data base and server. It has 2 main products :
Gotham : used mainly by the government in the intelligence sector and its main purpose is to identify patterns in the data and serve it to the end user.
Foundry : Central operating system for integration of data from several platforms to one main one, and enables the end user to reach a much faster analytics point. It is used mainly in the commercial sector.
The company currently has 131 customers which are about 50% growth in one year which is impressive. The business model is to acquire new clients based on “free trail” period which is costing the company loses and slowing their growth, but once the client is in -Palantir software takes over the whole process and keeps expanding with apps, software and other add on that increase the profit margin -but this is a very slow and long process, unlike Splunk or other data and analytics software.
So back to my point - is the stock worth 30+$ ? NO its not even worth 25$, we are just seeing a severe case of market FOMO (prob has to do with the 20 mil new robin hood traders joining in 2020 – welcome guys😊), so we must stay alert because we just had the second corrective wave to 21 (62% drop from H/H), and I presume the stock will rally once more and this will all tumble down like a house of cards – stocks are valued by profits, EPS, expansion, innovation or being a company that is one step ahead and until I get a clear sign of one of those + growth from PLTR I will take the profits we made on it so far and wait for the storm to pass
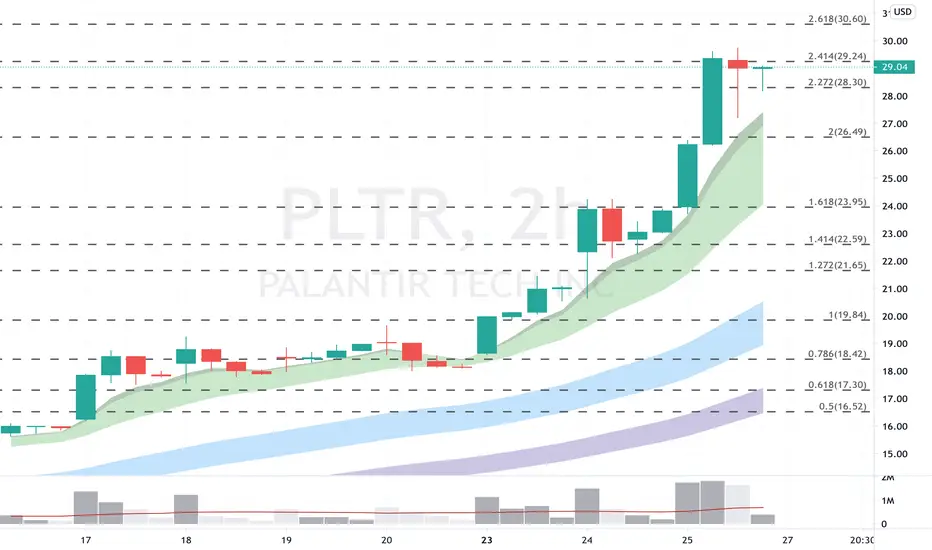
Technical:
208% rise in 22 days of trading ,highest high is about 33.5$ and lowest point of the correction is 21$, the blue square(below graph) is showing us that we are between the 618 to 50 line in a bit of renewed convergence.
stock finished its 4th wave -the correction wave and we are going into the fifth wave and the final one - after that we will have some brutal correction days ahead, its important to note I put the 5th wave lower than the 3rd one which is not reasonable but because the 3rd wave was so massive I have hard time to believe the 5th wave will cross the 33$ in the upcoming month or two.
THE BOTTOM LINE : after saying some negatives on the company the technical show us a preparation for a second rally (fifth stage of the impulse wave) that will probably reach the 30 line but this time it will be a bit healthier as the stock retraced and rested. After that we will have a lot of retracement – volatility at its finest – BE CAREFULL!
Happy Xmas and trade safe!
Closer look (1H chart):
Parabolic

Support levels for PLTRYou can be bullish and still see that this run needs a correction. Some trend-based fib extensions acting as support below.
Bitcoin Thanksgiving Sell OffWe are seeing just consistent sell volume on BTC today, as the market as a whole sells off a bit. Shaking out the weak hands near ATH is frankly not unreasonable to expect. How low the price goes is anyone's guess. I have been hitting some very small buys on its way back in the $16k range. Next chart will display long term weekly MA support levels, and following that pivot levels.

XRP Potential $1.15 Target In The Next 2 DaysXRP Has been growing immenslly since a few days. Luckily for us, XRP is following a clear pattern.
The pattern appears to take around 2.5 days to complete, resulting in a ~65% increase in USDT value.
Whether we will see the pattern unfold a third time will be clear in less than a day. If XRP manages to break out of the upper wedge, I expect the price to reach $1.00 at the very minimum, with potential upside towards $1.15.
Consider $1 as a major resistance. A lot of bullish pressure needs to build up in order to break this resistance. If the price manages to close above $1 on a daily candle, expect the price to rise even further, potentially with the All-Time-High as its new target.

$21,000 - BITCOIN BY NOVEMBER 30THHey traders, in this chart we took a short term parabolic view on Bitcoin , i tried to make the chart self-explanatory and detailed. However if you still have some questions do leave a comment below and if you find it helpful hit a thumbs-up 👍🏻.
Also share your idea below and let me know how you think the market would react.
I'd like to give some credits to @trading-guru picked up the short term insights from his ideas.

Ethereum will go parabolic agaist BitcoinETh will broke the fib gold pocket and it is apparantly will do a parabolic move

Ethereum's Massive Bull Run Has Just StartedEthereum is rising very rapidly in the last few weeks. Whereas the rising was more gradual at the start, it's starting to show signs of parabolic behaviour since a few days. This parabolic move blasted the price through the upward sloping channel, signaling more bullish movement to come.
Since there aren't any big resistances in the vicinity, the price has a lot more room to grow. Resistance 1 and Resistance 2 are the first major areas of big selling pressure, therefore it would be wise to reduce your long position around there. If both resistances were to be beaten, nothing will stop Ethereum from reaching the $1000 mark or even targeting a new All-Time-High.

CUP and HANDLE?Hey guys,
Technical Analysis is a thing which represents the past and allows predictions for the future.
Since Cryptocurrencies are a phenomenon and instituionals have not entered the market yet, it has hard to adapt such indicators and fractals into bitcoin.
Even in classic markets like the stocks market, bonds & derivates, Technical Analysis is something which works, because people believe in it. And since everybody believes it, it works out for everyone!
Nevertheless, we can try it out in crypto as well! :-)
The Cup and Handle formation:
As a stock forming this pattern tests old highs, it is likely to incur selling pressure from investors who previously bought at those levels; selling pressure is likely to make price consolidate with a tendency toward a downtrend trend for a period of four days to four weeks, before advancing higher. A cup and handle is considered a bullish continuation pattern and is used to identify buying opportunities.
It is worth considering the following when detecting cup and handle patterns:
Length - Generally, cups with longer and more "U" shaped bottoms provide a stronger signal. Avoid cups with a sharp "V" bottoms. (IS GIVEN)
Depth - Ideally, the cup should not be overly deep. Avoid handles that are overly deep also, as handles should form in the top half of the cup pattern. (IS GIVEN)
Volume - Volume should decrease as prices decline and remain lower than average in the base of the bowl; it should then increase when the stock begins to make its move higher, back up to test the previous high. (IS GIVEN)
As you can see, this formation works! But careful, it does not mean it works out, because only some lines match with the idea od a Cup and Handle!
I Hope you enjoyed this idea, let me know if you think this is actually good or absolutely garbage,
your quality-trader

BTC/USD- $30,000 (Dec-Jan) - $100,000 (Sep-Dec 2021)Hey traders, in this chart we highlighted the halving effect observing the the time to major ATHs after the halving event.
After first halving on chart we could see it took bitcoin about 500 Days to reach an all time high of about $1000.
After second halving same thing repeated we had another 500> days to hit an ATH of $20,000
Currently we sitting on the third halving and just est. 200days after last halving event, inasmuch as i believe
we will surpass previous ATH of $20,000 before year end and a possible hit of $30,000 by January 2021
My expectations for a new ATH will be by next Autumn/Winter come September to December 2021.
Do share your thoughts and let me know what you think.

DOGE/USDT Massive Parabolic Break-OutToday, DOGE has finally broken through the upward channel that it has been following for a few weeks. Not only did it break through, but it did so with a very strong few candles, accompanied with high volume.
In the snapshot below you can see that the upper trend line was decimated, signaling a strong bullish move in the coming days.
I expect Dogecoin to behave like it did in the past: strong bullish daily candle to start the parabolic movement, followed by even greater bullish daily candles. A move like this can keep going anywhere between two to five days. Consider taking some profits at either Resistance 1 or Resistance 2, since selling pressure is prone to be strong there. Tread very cautious when the price reaches above Resistance 2, it might reverse very strongly within the blink of an eye.

Text-Book Quality Parabolic Rise on BTC/USD! - By Trading-GuruThis fantastic parabolic ascending on BTC/USD is simply of text-book quality. In this analysis I will walk you through the narrative of how this parabola was formed. I will show to you in retrospect the things we can learn from the price behavior at that time, so that we can take lessons from it and recognize such a pattern more quickly in the future.
Furthermore, I show the bullish scenario of what will happen when this parabola holds. You can see that the price will increase exponentially, giving us a $19,000 prospect still within November of this year.
Lastly, I want to highlight what can happen if the parabola breaks. I did some research into other historical parabolas along with the text-book explanation of what will happen in those cases. And the results aren't pretty, if it does break the price can go down very very rapidly. As exponential as it has increased. So tread carefully everyone.
Here is the order of touchpoints on this parabola that with every step gave us slightly more evidence about the incoming increase in price:
The first of the touchpoints on this parabola were from the 5th of September. We see that the price has hit a temporary low near the $10,000 mark after a big hit in the price coming from $12,000
The second touchpoint happened on October 8th. We can already see here that every time the price dips the bottom is a bit higher than it used to be. For the first time, you can start to see a bullish trend.
From the 19th of October it becomes more evident that the price is rising, the touchpoint here was enough to let the price jump into the air. BTC is officially taking off, in just two days the price increased by 10%!
Early November we see multiple interesting touchpoints. The price is still bullish but struggling. It reached around $14,000 three times in a row and it got rejected on every attempt. Then, when it hit the parabola the price jumped up again!
And finally, the incoming last touchpoint in a few days. If the parabola holds we can expect the price to struggle around the $16,000 level for another 1.5 days. Then if it touches the parabola and it holds, we can expect the next jump in price.
By end November this parabola predicts a price of over $19,000 for BTC! Bringing it close to the resistance of the all-time-high. If you're going in with a long position I suggest to take profit below the ATH as it is very unpredictable what will happen near that level
Follow me for consistent high quality updates, with clear explanations and charts.
Please like this post to support me.
- Trading Guru
--------------------------------------------------------------
Disclaimer!
This post does not provide financial advice. It is for educational purposes only!

BITCOIN ENTERING PARABOLICin the beginning there was heaven and earth
and god said: let there be debt, and so there was
then the debt consumed the earth
and god said: let there be bitcoin so all the creatures of the earth can escape debt slavery
and so it was
and bitcoin rose higher and higher until all debts on earth were wiped away


Update: Is Bitcoin Going Parabloc? - YesLast time I made a similar post about Bitcoin's parabolic behaviour, we were still below 15k. Only 11 days later and we might already be hitting 17k soon.
Bullish sentiment is higher than ever. Together with the stock markets, Bitcoin profits from the US elections and the reduction in uncertainty. Pair this bullish sentiment with the constant addition of USDT into the market and we have a recipe for parabolic growth.
The next minor resistance is around 17k. Consider taking some profits there. If the price manages to beat the 17k resistance like it did with the 14k major resistance, there's nothing stopping Bitcoin from reaching 20k again.

BTCUSD | New ATH coming in parabolic patternBitcoin and the aggregated crypto market are seeing growth as the stock market rallies. This comes shortly after Pfizer announced that their vaccine for the rapidly spreading virus has 90% effectiveness.
This is great news for the stock market in terms of reducing global uncertainty and boosting the economy, but it is bad news for safe haven assets like gold – which have nosedived.
Bitcoin is still steady in $15 000 - $16 000 region. Nevertheless, one of analysts believes a move past $16 000 is just a very beginning. You can see his Bitcoin price action forecast till the end of the November with a possible monthly displacement till December 2020.
He found Bitcoin price action will confirm parabolic pattern in case of finishing 3rd consolidation base on November 15th at the area above $15 700. This scenario can lead the price to a new ATH around $23 600 level in case of burst which occurs after parabolic pattern completion. You can see risk management and target levels for the analysis at the chart
Will Bitcoin reach a new ATH in the following months? It will be a miracle and a disaster at the same time. Last time Bitcoin grew enormously in parabolic pattern we had 2 years of depression at the cryptocurrency market. Anyway we cannot affect the market so let's just prepare a bag of pop corn and see how the situation develops!
DISCLAIMER
Do Your Own Research. The content is intended to be used and must be used for informational purposes only. It is very important to do your own analysis before making any investment based on your own personal circumstances.

Bank nifty good short candidateBank Nifty Spot CMP 28600
Bearish Equivalent ABCD pattern formation
PRZ in range :- 28215- 28550
Targets :- 25000--24000-23000.
Pattern get active once index trades below 28200 levels
Pattern violation above recent peak which ever is made,,

JMIA to $50 by February?JMIA is the amazon of Africa. I think we are going to see it go parabolic. Here is the daily. Leaps! jump in!

Overextended, due for a pullbackOverbought, at the top of the Bollinger bands, supported by the EMA cloud but likely to pull back to the 20MA, 50MA below that. Long on this stock but it is due for a pullback.

Parabolic Run Happening Now? 20K by Thanksgiving?Looks like another parabolic run is happening right now. BTC has the perfect storm of technicals and fundamentals to drive another patented BTC parabolic run. If it matches summer 2019 linear scale gains, and length of run.. BTC can reach 20k by Thanksgiving.

NIO is moving madBuy the Dip, that's if it even happens. The rising wedge looks promising, but a long call on NIO rn is solid.

LINKBTC BreakoutPossibility of LINKBTC breaking out through previous highs. Higher lows may suggest an uptrend.

XMRBTC BreakoutSeems like XMRBTC may go up after breaking out through the previous highs. Higher lows can indicate a new trend.

SNAP on the brink of going parabolicI believe that SNAP is on the verge of some truly violent price increase. The business itself continues to thrive fundamentally and will only increase in the future.
