TRON is the new BITCOIN!This p.o.s. is the new Bitcoin apparently. Should hold support at current level and continue parabolic trend toward targets. Theres no telling where this shitcoin stops baby!
Parabolic

A Beautiful Cup n Handle Break for BTCBTC was in a rough spot retracing to 6,000 in February, it has now recovered almost 100% of its fall to the downside and is tetering on breaking out. A short torm goal from a 11.7k breakout is around 15k. Crisp long play if there is a short pullback.


My bitcoin parabullic bulltard chartWell, as you can see, btc had two parabolic movements in the past, in case we see a fractal, we should start bouncing in a new and faster parabolic movement (i see it unlikely now) IN CASE btc goes parabolic, top would be around 66-88k.
(parabolic moves from top to top)
past:
1st parabolic movement from 16 usd to 260usd: 1500%
82% retracement.
2nd parabolic movement from 260usd to 1170: 335%
88% retracement followed by a long consolidation period.
pic 1
s3.amazonaws.com
Present:
(top to top)
1st parabolic movement from 1170 to 19850usd: 1500% (sounds familiar?)
this is the part where i doubt, we only retraced 70% from previous ath.
So in case btc decides to retrace 80% like previous retracements i placed that blue line.
My bet:
1ST SCENARIO:
2nd parabolic movement (in case we keep going and forget 80% retracement) from 19850 to 88800usd: 334% (sound familiar?)
86% retracement - bottom around previous ath (19k and weekly support, 12k. like previous run, bottom were found around previous ath and weekly resistance (check pic 1)
pic 2
s3.amazonaws.com
2ND SCENARIO.
Btc doesnt bounce and go for 80% retracement. We consolidate for a long period until we touch pink trendline.
(check pic 1 to see where it starts)
pic 3
s3.amazonaws.com
pic 4
s3.amazonaws.com
s3.amazonaws.com
As you can see in this scenario i expect bitcoin to revisit that pink trendline that in my opinion is very very important.
both cases are very bullish in the long term.


ADBE is very parabolic!It's remarkable how parabolic Adobe is. How long can this keep going on?
Is a correction in store? Or can Adobe keep flying to the moon?

Parabilic Price Action: What happens next?In this video I try to illustrate what happens following Parabolic Price Action (when price goes vertical up or down).
In this example I show the initial move up in BTC and then roll price forward to the most recent move up in BTC. Both vertical moves were followed my reversals.
Moral of the story is when price goes Parabolic (up or down) expect a correction.

Bullish on ADA/BTC - 1 HrGreetings Everyone,
Everything on this chart is heavily dependent on BTC -0.25% fluctuations.
ADA/BTC looks like it might be coming out of accumulation. Although major downtrend has not been broken, we may see a little green in between. Trade at your own risk. This should only be a buy on breakout confirmation in my opinion. Happy trading!


LTCUSD 1H PARABOLIC SAR + MOVING AVERAGE TRADING STRATEGYWaiting to see if a bullish parabolic green dot will paint for a long trade
This trade is from our free pdf "PARABOLIC SAR + MOVING AVERAGE STRATEGY"
PM me if you have any questions, I will be happy to help.

BTC - Incoming LAST DIP!Before going into the details I'd like to note that this isn't BTC's first rodeo coming back from a dip. Looking at the previous 5 dips, this projection is in line with how it recovers and STAYS PARABOLIC. If this chart is wrong and BTC goes to its .786 at $8,800 support, then I'm selling all my BTC and staying out for a LONG TIME. Because that's a long road to recovery.
That being said, We have a nice road to recovery here with a strong bounce on a .618 level up to $10,800 today. Expecting the pull back to bounce off the strong baseline that's been formed since initial recovery from 6k. This baseline is also perfectly in line with a convergence of FIB levels .5 and .618 This is PERFECT STORM and is a big deal as it will provide a TON of spring and volume to get us out of this structure. The projected FIB extension is based off of market history for levels, but I'm not as sure on those levels. I am bias however that 13888 will be a number we hit very soon in March. Clif High is my homeboy :P

BTC Golden ratio similaritiesUpdated idea of BTC for long term
Tips are welcome to this BTC address: 1KYDPJ4XEribrakTSTnTrEX4C3syhcFxpo
Its just my opinion, don't take it too serious
This is not financial advice nor a fact that
this pattern is going to happen

Parabolic Advance Breached -> Range BoundI see a clear long-term pattern developing.
First we had a strong parabolic advance, which once breached, lead to range bound trading for ± a year.
Then we had another strong parabolic advance, which once again breached, appears to be leading to range bound trading again.
I will keep a careful eye on how this develops, to see if there are any signs that a new advance is developing, but based on other TA, I suspect we will remain with this range for the foreseeable future.

Bitcoin without volume, going down again? In my opinion, the last bottom wasn't the real bottom, it havn't retested, neither crossed 9k. If this continues like that, can retry the last bottom again, and create a W, or breake the bottom and going deep into 5k.
No news, still a lot development, but instead of focuse in 1000 coins, people are getting more involved into the ICO for the super high returns. Actually investing in an ICO is what gives you more returns, some of them, only investing 100$ can give you +10.000 in returns..... yes, x100 times or 10000% ROI.
As big markets are rising in volatility, and the bitcoin is not too bad, in few weeks (next onth, or Abril), we will see 1 trillion market easy.
If bitcoins rises too fast, will crash fast again, is better slow and steady.
On of the best things that criptomarket can do, is moving part of the BTC to the altcoins. Then, when BTC rises, altcoins can go down, and like this. The problem, is a lot of people instead of reinvesting, they sell for fiat. And the market is when tumbles.
Hope you like more my text than my graph. This one is not very Technical analysis, is a bit more FA.

Keep calm and buy BTC, next target 12.6kAs we see, from recently drop we bounced to the fib
and started recovering again, so keep calm and buy BTC,
everything going as it should
Have a nice day and be positive
Its just my opinion, don't take it too serious
This is not financial advice nor a fact that
this pattern is going to happen

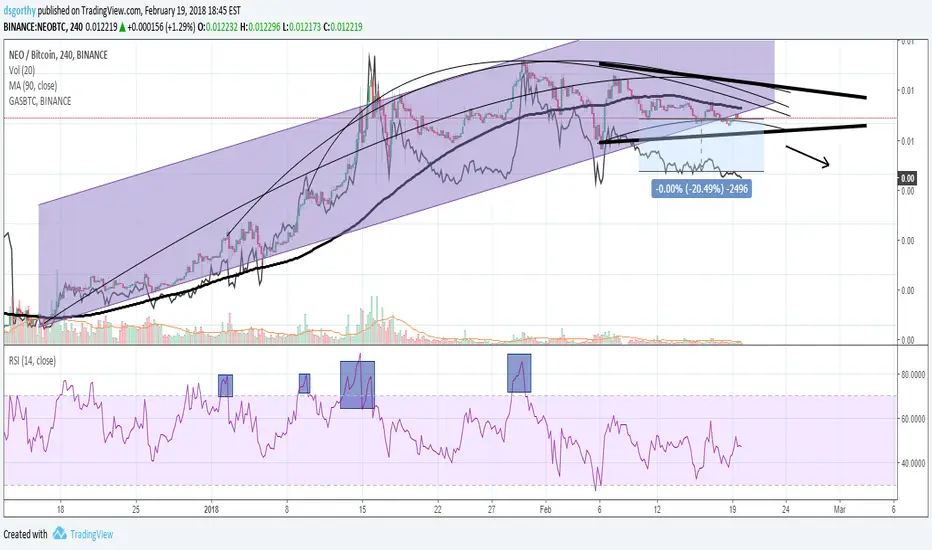
NEO vs GAS Trend Reversal. End of a Bull Run?I've been seeing a lot of signs of a trend reversal with both BINANCE:NEOBTC and BINANCE:GASBTC . As is shown in the comparison, they largely follow each other, with BINANCE:GASBTC being more sensitive to a reversal than BINANCE:NEOBTC . In the short-term, we've exited our ascending channel as both trends flattened out. I'm not ready to exit my positions yet, but if we continue with the flat trend that we've been seeing, I predict we'll see both coins lose ground as COINBASE:BTCUSD makes a run. If you're holding long-term, this isn't necessarily a huge signal to sell. If you are looking to close out positions to avoid losses, consider following my trading pattern.
Both of these coins may, and will likely, make another run in the future. I'd like to hear your thoughts on BINANCE:NEOBTC and BINANCE:GASBTC , especially if you're trading/looking to trade! Please comment below, as the more input we see, the more informed we are!
*** This is not a recommendation to buy or sell, this is for educational purposes only! ***
Bitcoin unstableThis trend shows Bitcoin during healthy growth, and what happens when the growth is unhealthy and parabolic. The whales have periodically gotten out of the market in waves during uptrends, because they realize that this growth can't be sustained. Stoch RSI has been unsustainable for days now.
I expect a giant crash back to the channel

Verge in an Eliott wave symmetrical/contracting triangle. looks like we are forming a symmetrical/contracting triangle. If we break this pattern, our fist target is wave 1 (yellow 1) of wave 3, which happens to land on the fib 0.618 which is 0.00000890 satoshis. whether we complete the symmetrical triangle or not, the first target is still the same, .618 fib! lets do it!

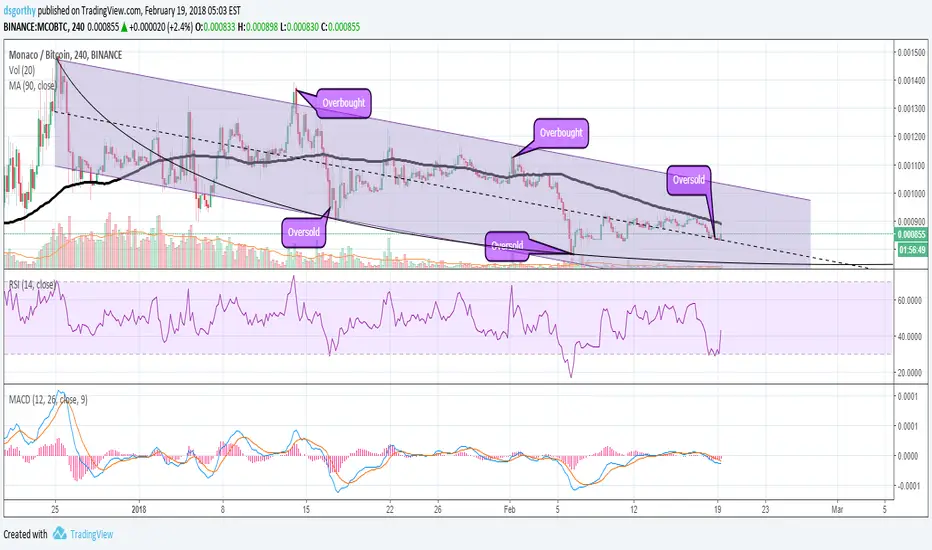
Monaco (MCO) Technical Analysis. Downtrend Coming to an End?Beautiful cards and a cheaper way of exchanging currencies, BINANCE:MCOBTC is a mid-cap coin attempting to change the way we think about commerce. I'm long-term bullish about this coin but am looking at some short-term TA to see if its time to get out and wait for a buy-in point or just stick with the coin that I have now. As with many of my TAs, I see a few positive indicators:
Established downward-trending channel with several tests in the past few weeks
Flattening parabolic line that indicates a potential reversal ahead
Oversold RSI indicators showing in the middle of the channel instead of at the bottom
It looks like the bears are getting tired of selling and are losing momentum. Now that we have the weak money out, I think it's time we see a BINANCE:MCOBTC rally! Note that we are still within our downward channel, but I do see evidence that suggests that we're about to exit our channel and flatten/reverse direction. I'd like to hear your thoughts on BINANCE:MCOBTC , especially if you're trading/looking to trade! Please comment below, as the more input we see, the more informed we are!
*** This is not a recommendation to buy or sell, this is for educational purposes only! ***
Come and join to bull trainI think nothing need to say
BTC tips address: 1KYDPJ4XEribrakTSTnTrEX4C3syhcFxpo
Its just my opinion, don't take it too serious.
This is not financial advice nor a fact that this pattern is going to happen. (but I think it will)

Breakout of parabolic beartrendIdea: Possible last dip before end of current short term bear trend. Will bounce at relevant (slightly lower) fib line or resistance level. :-) Comments?

Potential Long Entry - BTC bouncing on the 0.236 fibWe're currently about to touch on the 0.236 fib line with what seems to potentially be the end of a short parabolic bearish trend that began on the 17th of December (orange), with RSI also indicating that BTC is currently oversold, meaning a rally is likely - The overall long term parabolic bull trend is still intact (purple) - BTC dropping into a nice little buy area, may be a good opportunity to fill your boots in preparation for the next bull run.
Keep it simple, don't go overboard with indicators, don't sell the dip, don't feed the bears. The best time to buy is when there's blood in the streets, BTFD!

cannabi$$ watch this sectorthis stock has been dormant for sum time now but its at .53cents and its on the move
