ETH trend channel and parabolic I think with all this new money pouring into crypto ETH could break up the resistance trend line like BTC did and go parabolic!
Parabolic

Parabolic BTC for XmasJust toying around with a 7-day repeating pattern with exp. growth. Fun thought!

Bitcoin returns to parabolic trendNine days ago I fiddled with some red lines and thought about a return to parabolic pricegrowth of Bitcoin. The next days might return the price to the parabolic increase - while CBoE futures join the system and we wait for the big one: the CME, possibly breaking out on the upside once again. Target: 25000 USD? Why? Because we like 'round' numbers, especially 25% of 100k. Comments?

BTC/USD quick analysis and projection
BTC has been in the spotlight with its recent parabolic movement. Using trend analysis we have a short 24 hour break to the upside making new ATH on Coinbase/Gdax at roughly $19,726. Forming a consolidation pattern that is desperately needed. Fibonnacci retracement has support at $14,075 that needs to hold to stay in pattern. This is also a buy entry level to add to current long BTC/USD position.
If .618 Fibonnacci retracement level/support level holds it is also a potential buy entry for opening new BTC/USD long position with a target of $21,843.
StochRSI is oversold but there is very little volume coming in so caution is warranted for opening new BTC/USD long positions. Look for extra confirmations of continuing support at that level or price channel holding/uptrend forming with higher lows and higher highs.
Let me know what you think!
More to come :) Thank you!

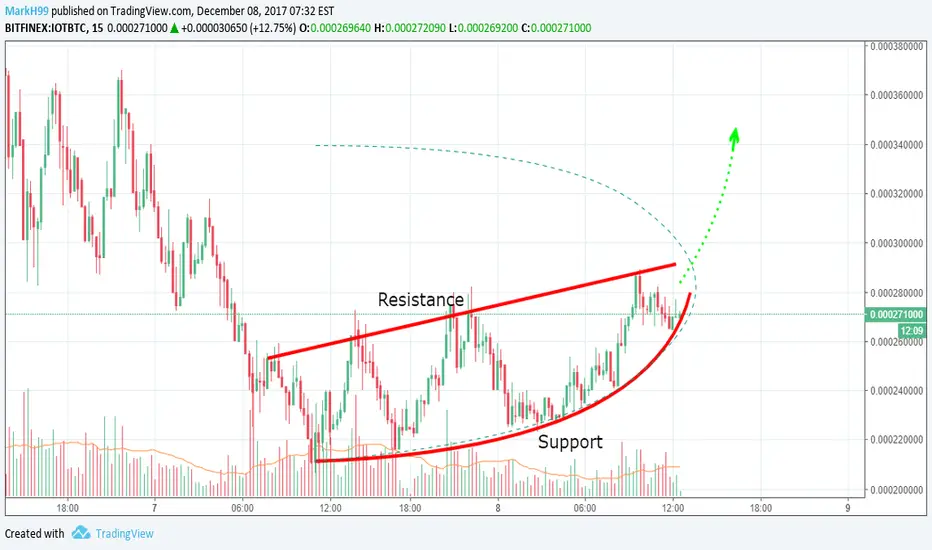
Parabolic Support line IOTAAfter a big decrease in value of IOTA, it looks like it's growing again. If it continues like this, I think IOTA will reach a new peak.
10k flirting before going parapolicSo we just broke a major resictance here (purple striped line) which should and kind of already turned into major support possibly setting us up for unpresidented levels.
We might hang out here for a bit, if everything stays in tact, within the triangle .. our 10k flirting range!

BTC INFINATE LOOP?!?!You can see where the first ark is made, and now second, just bigger, and bigger. It cannot curve beyond parabola anymore, so if it continues to be stuck in this infinite loop pattern it will self destruct with a bang eventually.
So I looked for the most bullish support area to catch a new trend line and take a BTC Breather so we can go to 14.5k

bts to rebound bts reboun?
drew sone kubes thru its mean and am observing its degree of acceleration in the upward direction.
micro parabolic growth - we are at the bottom of a big U. Only this dip may be the last "bottom" before we take quick jump to 2x land. Gains look small compared to others, but BTS will outperform, and provides much lower risk.

BTC: The Parabolic MoveThe parabolic move is undoubtedly the most sought after pattern for traders and investors with huge upside in a short space of time with followed by a blow off top.
Typically there are several periods of consolidation or 'bases' which are established with increasing range between each of the moves.
The final phase is a usually the most violent in its upside before a strong correction which breaks several of the previous levels of support.
I think its fair to say Bitcoin is within such a move and most likely coming to the end.
Im calling top at a maxout of this move being $20k but could end sooner.
A collapse could see bitcoin return to somewhere between $2 and $3k- i would lean towards $3k
Im certainly not bearish quite yet, but we saw some serious volatility at $10k - imagine what it will be like at $20k.
A lot of people will have made a lot of money and profits will be taken:
Just to put this in to perspective, lets say you bought 100 BTC at the start of the year for $100k. By $20k/BTC this will be $2m in holdings. This is enough for any average man to retire upon. Watch how quickly the libertarian hodl attitude melts away when they are literally kissing goodbye to their lottery ticket. The panic will be significant and is probably underestimated due to the euphoric feeling we all have today.
My advice would be not to short this beast. There is plenty of potential to nearly double in price. Take some profits on the way up.. You can’t go bust by doing that.
Hope you found this useful.
All the best.
FILBFILB

BTC/USD Parabola As long as the old trend line holds, we are on a parabolic run in Bitcoin. Will update when new trend line might be in play. My best guess is that we see 12K and then a correction down in the orange zone around low 10K possibly 9.5K. In this scenario the parabolic movement stays intact and continues upwards with an even steeper trend. 20K before end of this year.

CBEO - On-going Parabolic TrendHold CBEO until the the price breaks out of the parabolic trend. Exceptionally large preceding green bar (on linear graph), then <= red bar with high volume will be the indicator for exiting.

CGNX Parabolic TrendInvest in CGNX until the the price breaks out of the parabolic trend. Exceptionally large preceding green bar, then <= red bar with high volume will be the indicator for exiting.
There is current somewhat concerning drop with a fair amount of volume, so wait for confirmation of low volume and regression to middle of trend prior to entry.

Nvidia Parabolic TrendInvest in NVDA until the the price breaks out of the parabolic trend. Exceptionally large preceding green bar, then <= red bar with high volume will be the indicator for exiting.

[Parabolic view] $20,000 BTC - Feb 2018As BTC price is currently exponential I believe that using curves is more accurate. So I combined both curves and lines following the main tops & dips of 2017.
We get a price prediction of +$20,000 / BTC for february 2018.
Feel free to share constructive comments below.
Happy trading / hodling.


DASH in parabolaThis is a big call. The median parabolic curve is a big draw for critical price path and discovery, furthermore the upper and lower both having a few testings. The more testing and we see the better.
Any breaks to the lower line bull run over.
But so far we have precise indication and obedience. Fear money running to Dash, from BTC. Just check both charts, clear syncing with the recent hack. Institutional money will favor the relatively bare order books, a lot more market cap to come. Network effect in full swing. Dash's huge marketing budget and general the favor for privacy atm all helps.
I called a $1000 Dash by January 2018 back in July, still got a way to go but we are getting there. 2018 should be an important year for crypto and I can see Dash scaling the ranks and outperforming the market.


Bitcoin: Peter Brandt's Parabolic Trend + Elliott Wave TargetsMade a small correction to the curve from Take 2 ()
Added the Potential Bull Run targets for the overlay. ()

Bitcoin: Peter Brandt's Parabolic Trend - Take Two!Thanks to fingerex (www.tradingview.com), he noted I got one point wrong and it all makes much more sense now.
Heinzz (www.tradingview.com) also asked "Can you make another chart projecting the parabolic channel into the future to where they meet?" - So I've extended the lines to show just that.

Bitcoin: Peter Brandt's Parabolic TrendYou can find Peter's post here: twitter.com
I've recreated it almost perfectly I believe.
Just thought I'd share.
I like the comments made in the Twitter thread:
@cyberamine12 - "What happens when the lines meet?"
@PeterLBrandt - "Bull market is over or market blows through the top in a final display of fireworks."
Also of note:
@ChanikPark79 - "Is it possible we retrace to say $3000 and start a new parabola with a new slope?"
@PeterLBrandt - "Nope. Not likely."

Bitcoin soon ending parabolic movement?Are we perhaps looking at one of the greatest corrections in history? If this parabolic pattern carries out, we may be looking at a monstrous retracement of somewhere between 80% to 97%. We are far overdue on our correction, with both a bigger elliott wave soon closing out, with a smaller elliott wave within that wave, and now with the parabolic pattern on the outside.
Give this two months and everyone will be screaming that they were correct about Bitcoin being a bubble, and that's when we buy - at ridiculously low prices. Time to get our own garage to store all our lambo's.

Bitcoin: BTCUSD One Chart of most excellent parabola in historyBITCOIN:BTCUSD One Chart of the Parabolic Baby
At the moment it's found support just above the supports shown on left hand
chart and trying to fly higher - it needs to take out 7500 now to stay positive...
if we see it falter and fail just above or just below 7500 then we have the first
sign that a turn might be approaching fast...next sign would be a breaking below
7061 and a fall below the rising support line shown on left hand chart. Only at
that point will the near term picture start to turn negative for Bitcoin.
It should then fall back to the old highs around 6165 - to the rising support
line shown on right hand chart at around this level - that would be the perfect
entry point for those wishing to ride this tiger...time will tell.
